just now

Liquidity Finder Ltd is incorporated in England and Wales, company number 10610740, registered address 167-169 Great Portland Street, Fifth Floor, London W1W 5PF, United Kingdom.
Published: just now


The key to CONFIDENCE and MASTERY in every skill is PRACTICE.
Repetition refines your strategy, builds discipline, and strengthens your ability to execute under pressure. Every skilled trader started as a beginner, but what separates the profitable from the struggling is consistency—showing up daily, learning from mistakes, and refining their edge.
Trading isn’t just about predicting markets; it’s about mastering yourself. The more you practice executing your plan, managing risk, and sticking to your process, the more second nature it becomes. Over time, uncertainty turns into clarity, and confidence follows naturally.
Here is a step-by-step guide how you can backtest your trading strategy with AI.
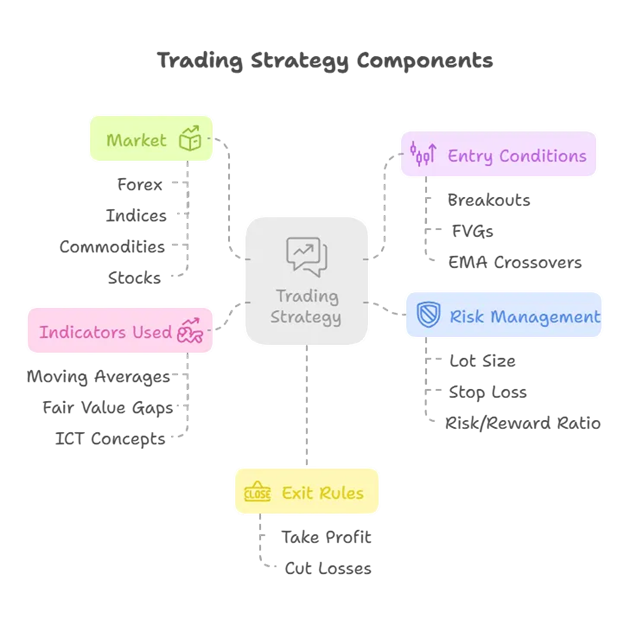
Before testing anything, you need a structured plan. Without clear rules, backtesting results will be inconsistent, making it hard to evaluate effectiveness. A well-defined strategy includes:

Think of this as setting up the "rules of engagement" before going into battle. The clearer the rules, the more reliable the test.
We can use the Moving Average Crossover with Price Action Breakout Strategy as an example.
Now that you have a strategy, you need the right tools to test it efficiently. Different backtesting software caters to different needs—some are manual, while others allow for full automation. Below is a detailed comparison of free and paid backtesting tools, helping you choose the best option for your needs.
1. Easiest – No Coding, Simple Setup (Best for Beginners)
TradingView (Best for Quick & Visual Backtesting)
If you’re a discretionary trader and want a quick way to review price action, TradingView’s bar replay is an easy way to simulate past market conditions.
✅ Pros:
❌ Cons:
Best For: Beginners who want to visually test strategies all available markets.
Forex Tester Online (Best for Simple, Browser-Based Forex Testing)
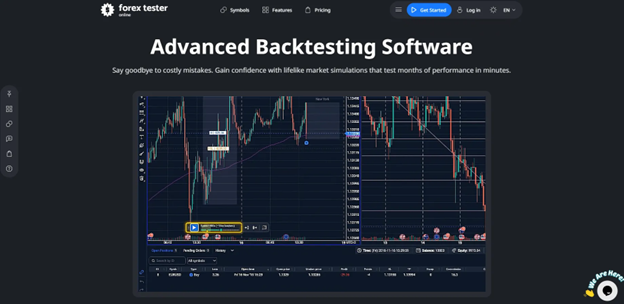
Need a quick way to test strategies without downloading software? Forex Tester Online allows you to simulate price action in your browser.
✅ Pros:
❌ Cons:
Best For: traders who need a quick, lightweight backtesting tool.
2. Intermediate – More Control, Still No Coding Required
FX Replay (Best for Realistic Forex Testing)
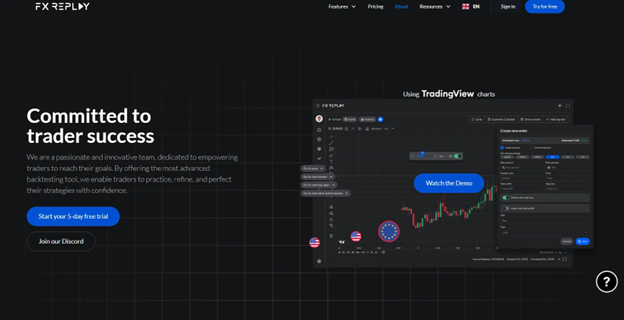
If you want to trade historical markets as if they were live, FX Replay lets you simulate price movements and test trade execution.
✅ Pros:
❌ Cons:
Best For: Traders who want a realistic, hands-on experience without automated strategies.
TradeZella Backtesting (Best for Trade Journaling & Review)
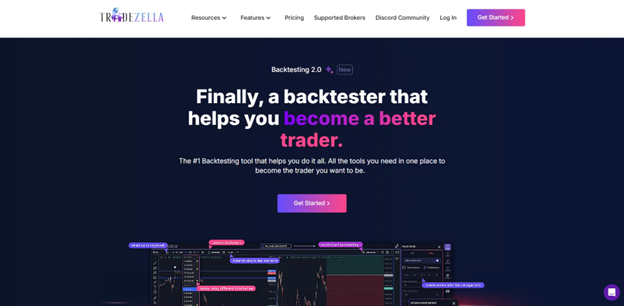
If you are looking for a backtester with a trading journal bundle, Tradezella could be a good pick for you.
✅ Pros:
❌ Cons:
Best For: Traders who want to analyze & improve past performance.
Forex Tester 6 (Best for Forex with Detailed Statistics)
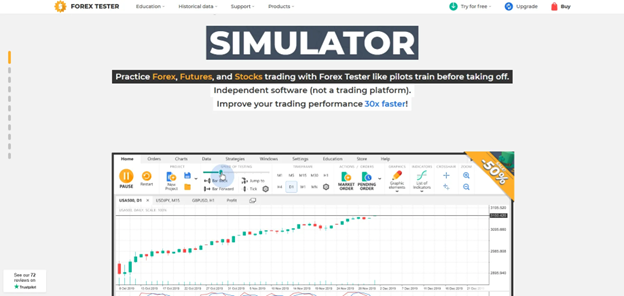
If you need detailed Forex backtesting with real tick data, Forex Tester 5 provides historical simulations with full trade execution.
✅ Pros:
❌ Cons:
Best For: Traders who need detailed trade statistics and high-quality data.
3. Advanced – Requires Coding / Automated Backtesting
MT4/MT5 Strategy Tester (Best for Automated Forex Backtesting)
✅ Pros:
❌ Cons:
Best For: Traders who want full automation & strategy development.
Backtesting Tools Comparison (Sorted by Complexity)
Which One Should You Choose?

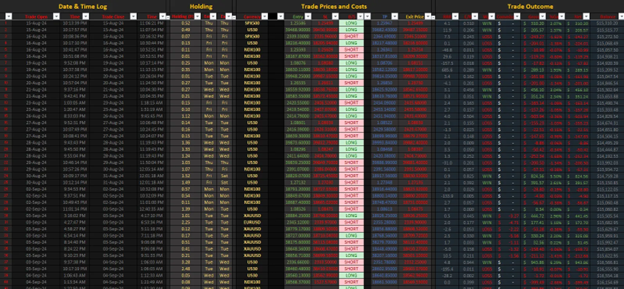
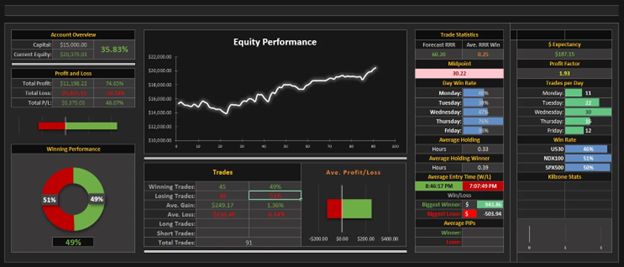
Accurate record-keeping is essential for evaluating your strategy’s performance over time. Without proper documentation, it’s difficult to identify patterns, strengths, and weaknesses in your approach. As an example, below is my record keeping spreadsheet for my manual backtesting. I prefer it recording manually but if you can have an automated one that does the recording for you, that’s also good.
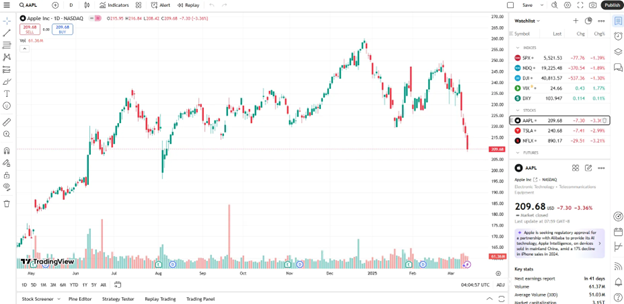
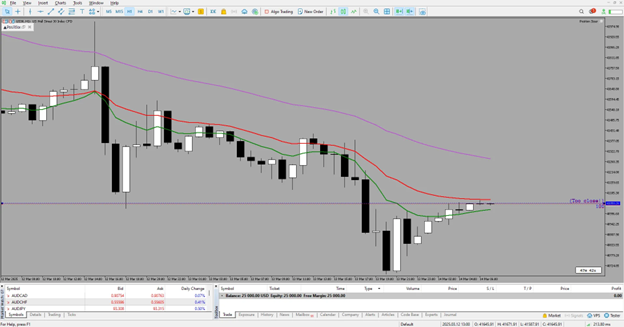
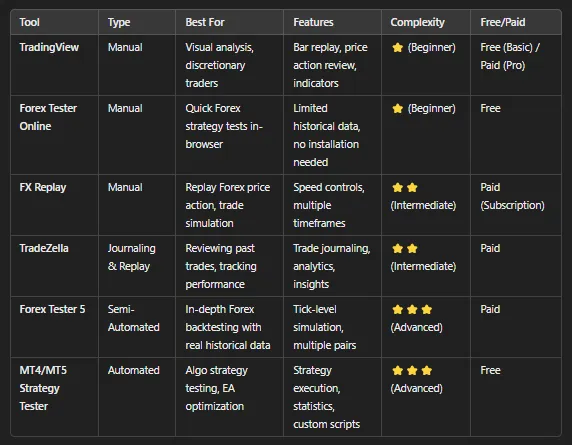
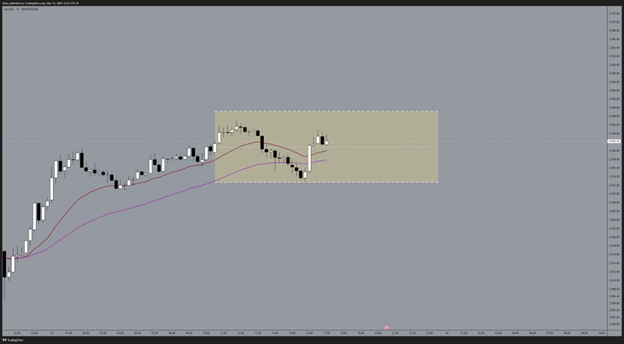
Now that you have a strategy and a tool, it’s time to run the backtest. TradingView is a popular choice for manual backtesting, allowing traders to replay historical data and execute trades as if they were happening in real time.
Open TradingView and select the asset and timeframe you want to test.
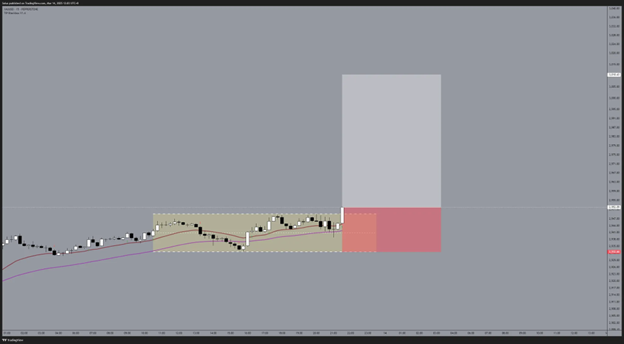
In this case, I used Gold to backtest with my 2 indicators, 20 and 50-day moving average.
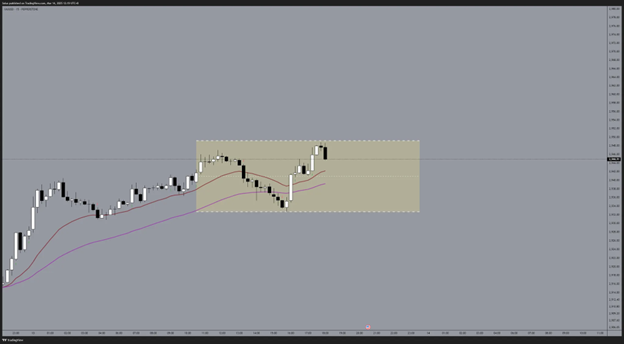
Use the Bar Replay feature (found in the top toolbar) to scroll back to a past period.
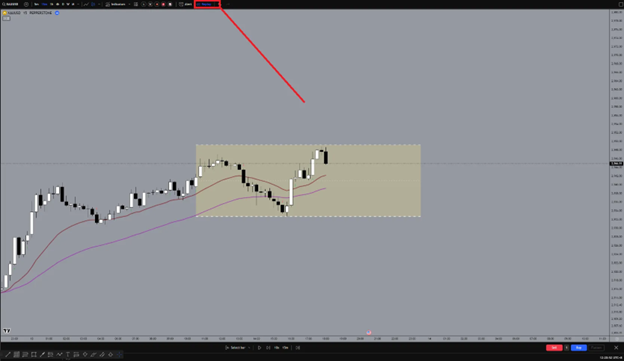
Drag the Replay Line to your desired time period to test.
Click Play to advance price action candle by candle until your parameters align.
Click Buy to execute your long entry. Sell for short entry.
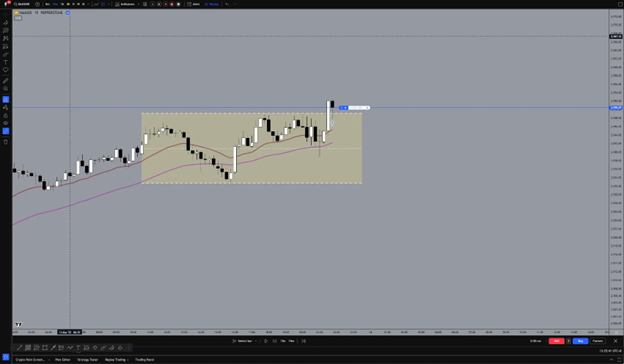
In this scenario, we proceeded with execution as all our entry criteria were met.
Keep clicking the Play button until you reach your target.
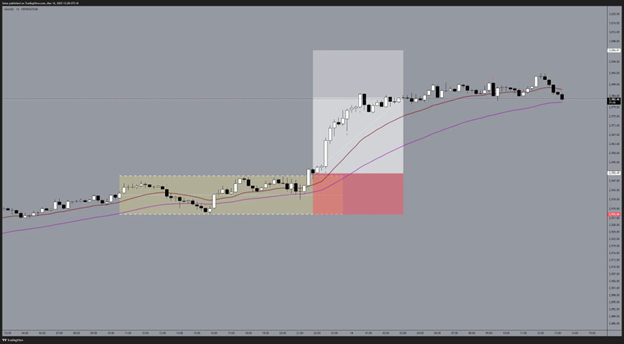
Track performance metrics like drawdown, profit factor, and accuracy. You can create your own tracking journal with Excel.
Essential Metrics for Tracking:
You can add additional columns based on the specific performance metrics you want to track.
Ensure you test your strategy with at least 100 trades to gather reliable and statistically meaningful data.
After running the backtest, analyze the results to determine if your strategy is viable. Adjust parameters where necessary to improve performance.
AI can be a beneficial trading assessor to check how good your backtest performance is.
Your analysis would entirely depend on what data you are looking for and what you need to improve.
Upload your file in Chatgpt. Converse with Chatgpt how can AI help you assess your file.
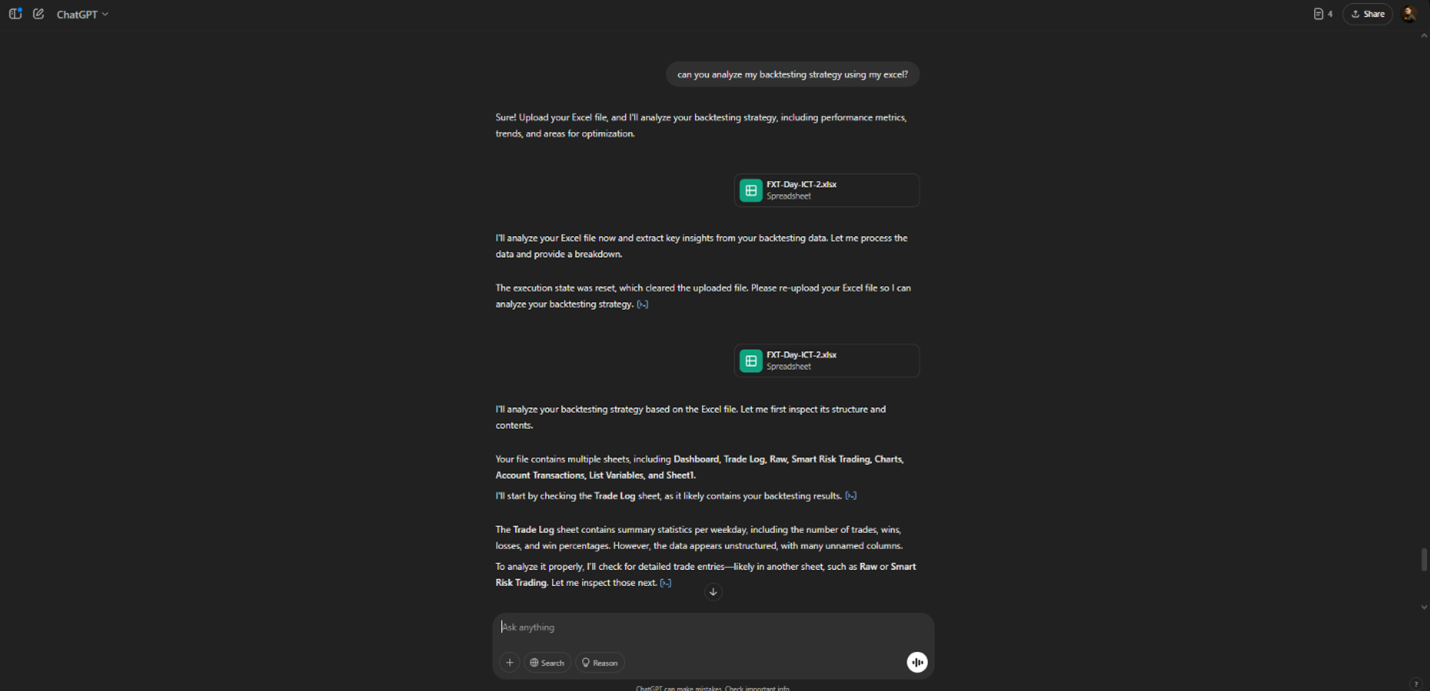
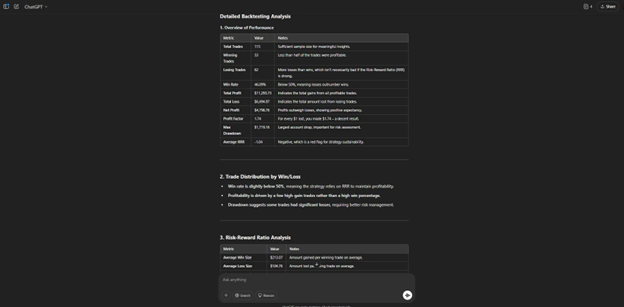
Here is a sample result generated by ChatGPT from the file I uploaded:
Now, let’s dive deeper into specific aspects of your strategy, including trade types, market conditions, and execution.
1. Trade Type & Market Conditions Analysis
Your trading results are affected by when and how you take trades. Let's break it down:
A. Trade Type Performance
| Trade Type | Total Trades | Win Rate (%) | Avg Win ($) | Avg Loss ($) | Net P/L ($) |
|---|---|---|---|---|---|
| Breakout | 42 | 48.5% | 225.10 | 119.30 | +$3,149.67 |
| Reversal | 32 | 41.2% | 207.50 | 137.80 | -$870.90 |
| Trend Following | 41 | 50.3% | 211.00 | 98.75 | +$2,520.99 |
Findings:
✅ Trend-following trades are the most consistent, with a 50.3% win rate and the best RRR.
✅ Breakout trades produce the highest net profit but have slightly higher losses per trade.
❌ Reversal trades have the lowest win rate (41.2%) and are the only category with a net loss.
Actionable Insights:
🔹 Reduce or optimize reversal trades by using confirmation indicators.
🔹 Focus more on trend-following setups, as they provide stability.
🔹 Refine breakout strategies to reduce unnecessary stop-outs.
2. Trade Timing & Market Session Performance
When you trade can significantly impact profitability. Let’s see how your trades performed based on market sessions.
| Session | Total Trades | Win Rate (%) | Net P/L ($) | Notes |
|---|---|---|---|---|
| London Open (2AM-5AM EST) | 37 | 49.2% | +$2,560.88 | High volatility, good profits. |
| New York Open (8AM-11AM EST) | 46 | 51.1% | +$3,129.55 | Best session for profitability. |
| NY Afternoon (12PM-4PM EST) | 17 | 44.7% | -$890.23 | Trades taken here lost money. |
| Asian Session (6PM-1AM EST) | 15 | 39.3% | -$321.44 | Least profitable, lowest win rate. |
Findings:
✅ London and New York Open provide the best opportunities.
✅ Trades after 12PM EST (NY Afternoon) tend to underperform – possibly due to lower volatility.
❌ Asian session has the worst performance, indicating market conditions don’t favor your strategy.
Actionable Insights:
🔹 Focus on trading during London & NY Open for maximum profitability.
🔹 Avoid or adjust trading in the Asian session, as results show poor performance.
3. Risk Management & Position Sizing Analysis
Risk management can make or break a strategy. Let's analyze how well your position sizing and stop-loss levels are working.
A. Stop-Loss vs. Take-Profit Performance
| Stop-Loss Size | Total Trades | Win Rate (%) | Net P/L ($) | Observations |
|---|---|---|---|---|
| 10-20 Pips | 28 | 38.5% | -$1,129.92 | Too tight, leading to stop-outs. |
| 21-50 Pips | 64 | 51.2% | +$3,764.55 | Most effective range. |
| 51+ Pips | 23 | 45.7% | +$975.90 | Works well, but inconsistent. |
Findings:
✅ 21-50 pip stop-loss range is the most effective and provides the highest net profit.
❌ 10-20 pip stop-loss leads to premature exits, reducing win rate.
❌ 51+ pip stop-loss has mixed results, meaning some trades lose too much before reversing.
B. Position Sizing & Risk Per Trade
| Risk per Trade | Total Trades | Max Drawdown ($) | Profit Factor | Notes |
|---|---|---|---|---|
| 0.5% of Account | 38 | $987.52 | 2.01 | Low drawdown, high profitability. |
| 1% of Account | 54 | $1,345.10 | 1.64 | Balanced risk and reward. |
| 2% of Account | 23 | $2,047.89 | 1.21 | High drawdown, less profitable. |
Findings:
✅ 0.5% risk per trade produces the most stable results with minimal drawdowns.
✅ 1% risk per trade balances drawdown and profit.
❌ 2% risk per trade causes large drawdowns and reduces profit efficiency.
Actionable Insights:
🔹 Stick to 0.5%-1% risk per trade for stability.
🔹 Avoid excessive drawdowns by adjusting lot sizes and stop-loss placement.
4. Key Optimizations & Takeaways
Based on this analysis, here are the most important changes to improve your backtesting strategy:
A. Strategy Adjustments
✅ Focus more on trend-following and breakout trades.
✅ Reduce or optimize reversal trades to avoid unnecessary losses.
✅ Avoid trading during NY afternoon and Asian session due to poor performance.
B. Risk Management
✅ Stick to a 21-50 pip stop-loss for best performance.
✅ Risk only 0.5%-1% per trade to manage drawdowns.
✅ Avoid stop-losses under 20 pips to prevent unnecessary exits.
C. Trade Execution Improvements
✅ Use confluence indicators for better trade confirmation.
✅ Backtest alternative entry points to improve execution accuracy.
✅ Ensure better reward-to-risk management to maintain long-term profitability.
⭐ Your strategy is profitable, but there’s room for optimization.
⭐ Biggest areas for improvement: Risk-reward ratio, stop-loss placement, and session timing.
⭐ If optimized, this strategy can be even more consistent and scalable.
Backtesting is the bridge between theory and execution. It refines your strategy, sharpens your decision-making, and builds the confidence needed to trade effectively. The market rewards those who prepare, adapt, and remain consistent.
But remember, no strategy is perfect—only well-tested ones stand the test of time. The key isn’t just in backtesting but in applying what you learn, optimizing with data-driven insights, and continuously refining your approach.
Master your process, trust your edge, and let your results speak for themselves. Consistency turns experience into expertise.
This content may have been written by a third party. ACY makes no representation or warranty and assumes no liability as to the accuracy or completeness of the information provided, nor any loss arising from any investment based on a recommendation, forecast or other information supplies by any third-party. This content is information only, and does not constitute financial, investment or other advice on which you can rely.
ACY Securities is one of Australia's fastest growing multi-asset online trading providers, offering ultra-low-cost trading, rock-solid execution, technologically superior account management and premium market analysis.
Select the categories and companies you wish to follow directly to your person rss feed.
Create Custom RSS FeedSign up and join over 5,000 professional members who receive personalized news alerts, curated professional connections, and more for free!
Retail futures trading leader NinjaTrader Group has appointed Mark Omens as Senior Vice President, Commercial Strategy, bringing a 25-year veteran of derivatives marketplace CME Group into a newly created role focused on exchange partnerships and enterprise growth.
Gold Price Action Forecast: Will XAU/USD Drop to $3930? Meta Description: Read our Gold price action forecast to see if XAU/USD will drop to $3930.
BitDelta Securities Financial Services LLC (“BitDelta Securities”) today announced that it has received full regulatory approval from the Capital Market Authority (“CMA”) of the United Arab Emirates under the Category 5 — Arrangement and Advice license framework (License No. 20200000439). The approval follows the firm's receipt of In-Principal Approval earlier this year and represents the successful conclusion of the CMA's full licensing process, including the satisfaction of capital requirements, governance appointments, and operational setup.
Crypto.com has received a $400 million strategic investment from Citadel Securities, valuing the firm at $20 billion. It marks the first institutional funding round in the company's history, aimed at accelerating its expansion into tokenised securities, derivatives and other asset classes.
WTI’s pullback into $79–82 is the first major test of the bullish Elliott Wave count, with buyers targeting a renewed break above $85.

BitDelta Securities has secured a full CMA Category 5 licence in the UAE and opened a regulated office in Business Bay, Dubai. The firm operates as an introducing broker, connecting investors with licensed international brokers across multiple asset classes, with CEO Dr. Demetrios Zamboglou commenting on the milestone.
Index volatility is asleep while single stocks fight it out underneath, credit refuses to confirm the equity rally, and a bare macro calendar hands next week to oil.
Digital assets and FX brokerage GC Exchange FZE (GCEX) has appointed Mohammed A. Mulla as a Board Member of its Dubai-based entity, part of the wider GCEX Group.
Learn what Blockchain-as-a-Service is, how it works, and why businesses are using BaaS to build blockchain applications without managing infrastructure.
CFDs vs stocks compared on leverage, ownership, costs, dividends, taxes, and risk. Learn the differences between stocks and CFDs and discover which suits your investing or trading goals.


