
A Compilation Of 10 Top Forex Trading Strategies
6 August, 2019 - ## This article is aimed for traders who are either getting their feet wet in financial instruments such as forex or alternatively, seeking out new ways to define their entry mechanism and seek trading opportunities. The article below outlines the most popular and comprehensive, highly effective forex trading strategies that anyone can learn - Ivan Delgado, Head of Market Research, Global Prime.
Trading the currency market in a consistently profitable fashion day in and day out can be understood as the ability to make more than you lose in a certain period of time, over and over.
Let’s be clear, the minuscule group of forex traders that are able to achieve such mastery every day by deploying forex trading strategies, have excelled at key areas such as trading psychology, risk management, which are by far the most important. However, they’ve also taken ownership of a trading methodology that will determine when they enter and exit the markets to amass their hard-earned pips.
This article is aimed for forex traders who are either getting their feet wet in the forex market, or alternatively, are seeking out new ways to define forex trading strategies.
Remember these 10 forex trading strategies tend to work best when a forex trader adds factors of confluence such as trading with the dominant market cycle in higher time frames, alignment with fundamentals, a mechanical risk management and awareness of risk events.
Also don't forget, to the question, what's the best forex trading strategy out there? There is no one size fits all in forex trading. It's all about taking ownership of your approach and building robust conviction of one or several forex trading strategies through one’s own backtesting, a really critical part to stick with it.
Now, before further ado, let’s tackle these 10 forex trading strategies for traders to benefit.
Forex Trading Strategy 1: Swing trading strategy at discounted prices
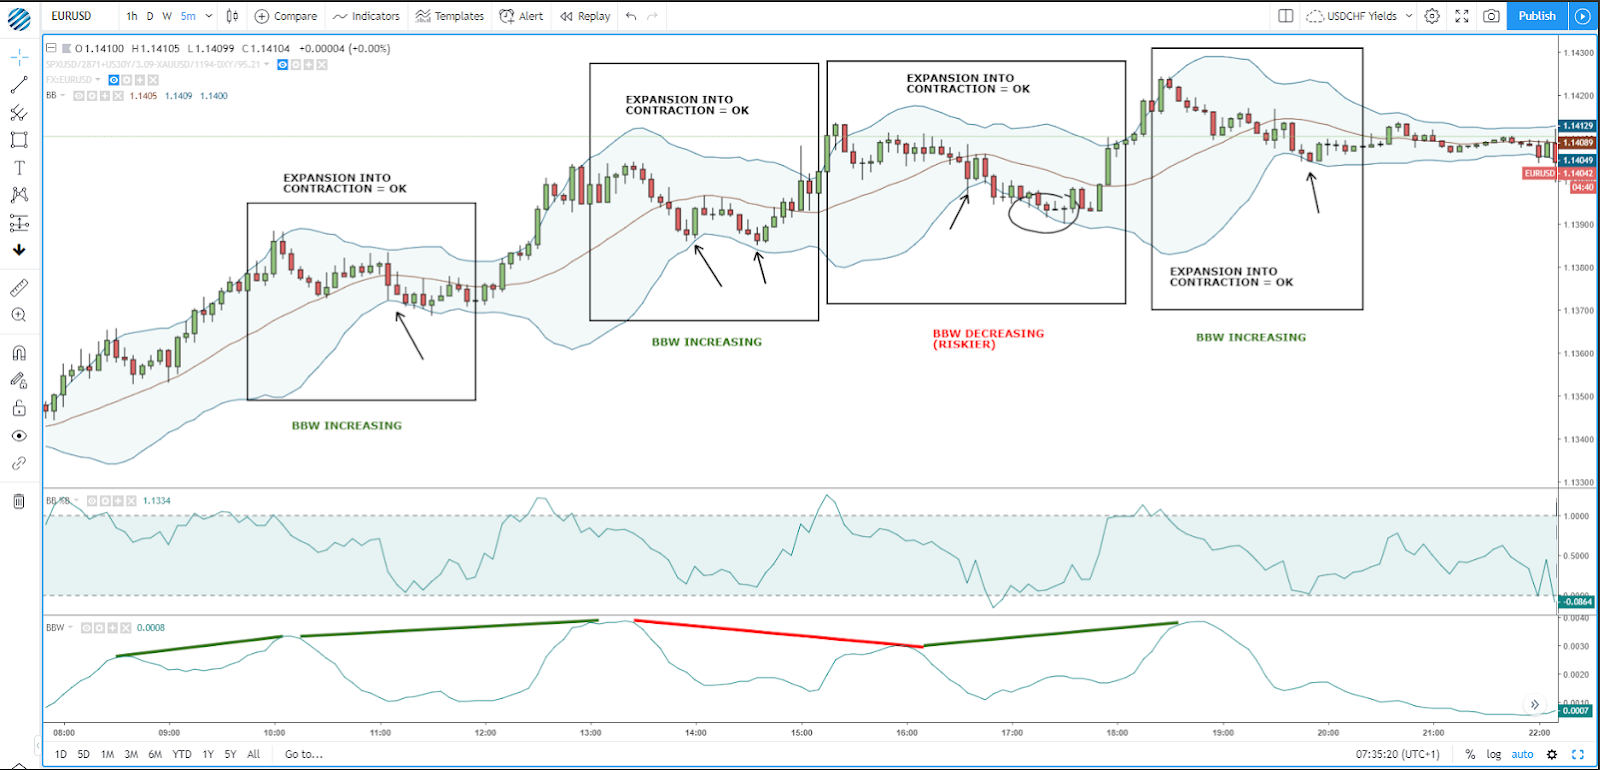
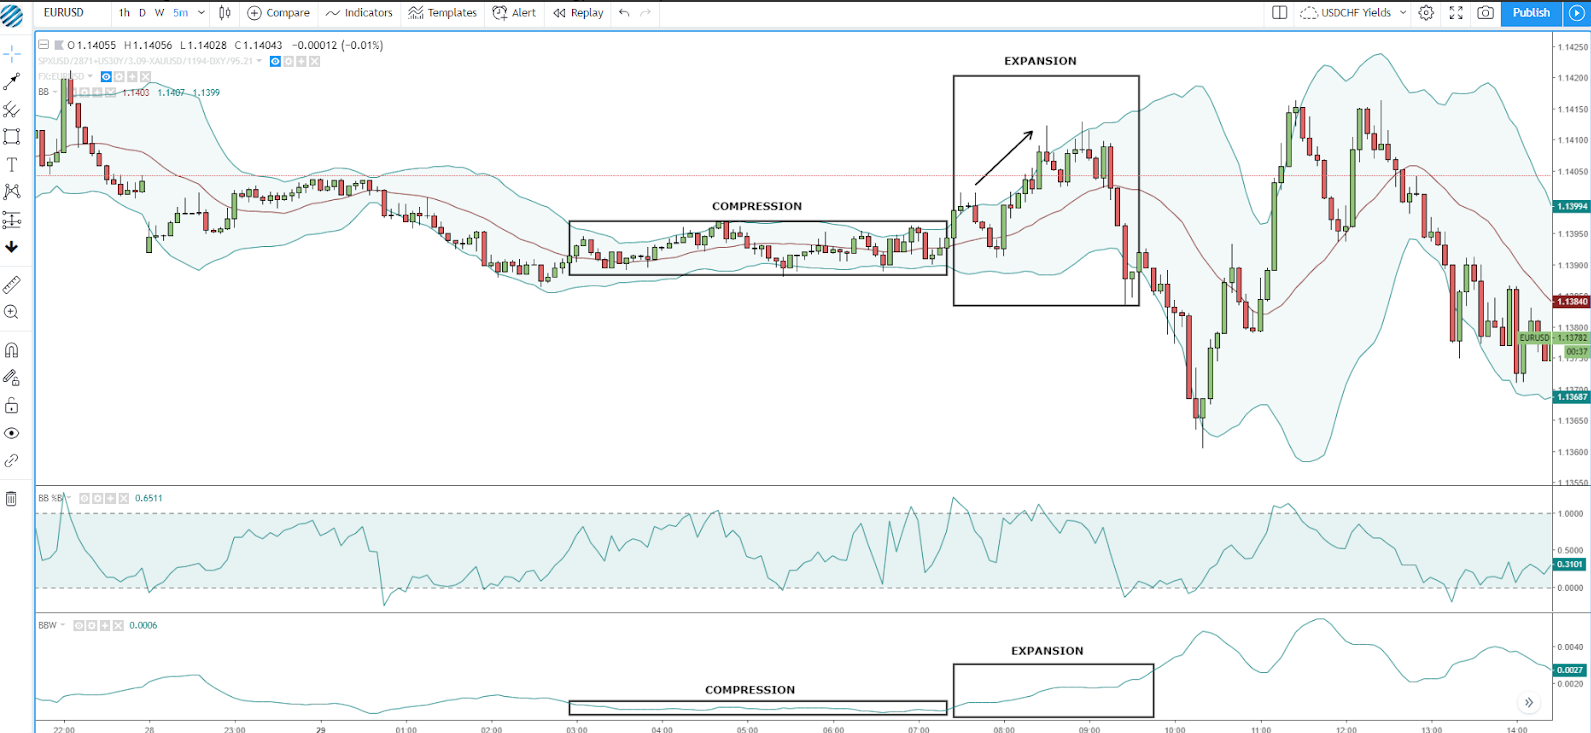
This is a trend-following strategy for forex day traders that orbits around the use of the bollinger bands. One of the common characteristics of trading the forex market is that prices not only tend to return to its equilibrium or mean level, which in bollinger band terms means a revisit of the 20-period moving average, but it often overshoots to the other side of the bollinger band, hence, creating an opportunity to enter at levels that are considered to be at wholesale or at a discount but in the context of an ongoing trend.
As a validation, a forex day trader must enter in line with the underlying trend as determined by the bollinger band. Another precondition of this forex trading strategy is to make sure that the new swing high or low is greater in magnitude than the previous one as it will communicate a strong commitment by buyers or sellers is still in place. To assess this latter concept, the bollinger band width (BBW) indicator will be our best tool to illustrate that.
If the BBW is breaking into new highs, that means the commitment to participate in buy or sell-side campaigns is on the rise, therefore, we’d be interested to enter if the price moves outside the opposing side of the most distant bollinger band (low band in uptrends, high band in downtrends).
In terms of placing your stop loss, as a rule of thumb, a distance equal to 2 times the ATR on a 14-period (average true range) of that particular time frame is a sensible approach to account for the volatility currently at play. The profit target could be split into 50% on a retest of the latest high (in an uptrend) or low (in a downtrend), while the remaining position would run for a target 3 to 4 times the ATR from your entry. Once the price makes it to the first target, the position will be moved to break even. This is a strategy that is best suited to enter on a market order as the entry point is dynamic.
Find below an example on the EUR/USD in the 5m timeframe.
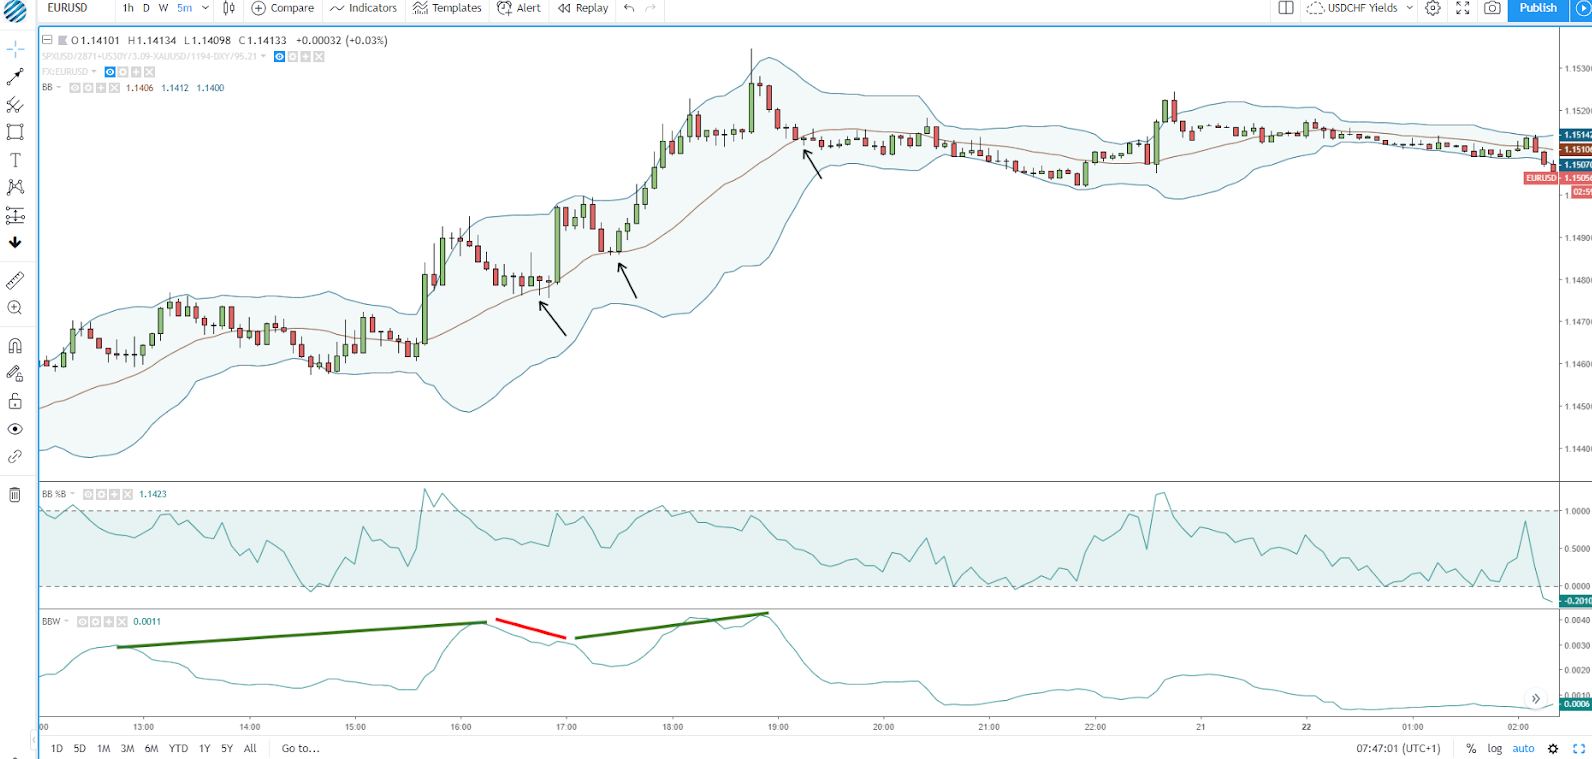
Forex Trading Strategy 2: Swing trading at fair prices
If you are looking to engage in a trend at what would be classified as fair price rather than a discounted price, you could opt to get into the trade at the 20-period moving average as part of this forex trading strategy for day traders. The rest of the pre-conditions described in the first example would still apply, with the only difference that this entry would be more aggressive in nature since the trader is willing to pay what's considered a fair price vs a discounted price. The same stop loss and risk management logic apply as in the case of the discounted entry modality.
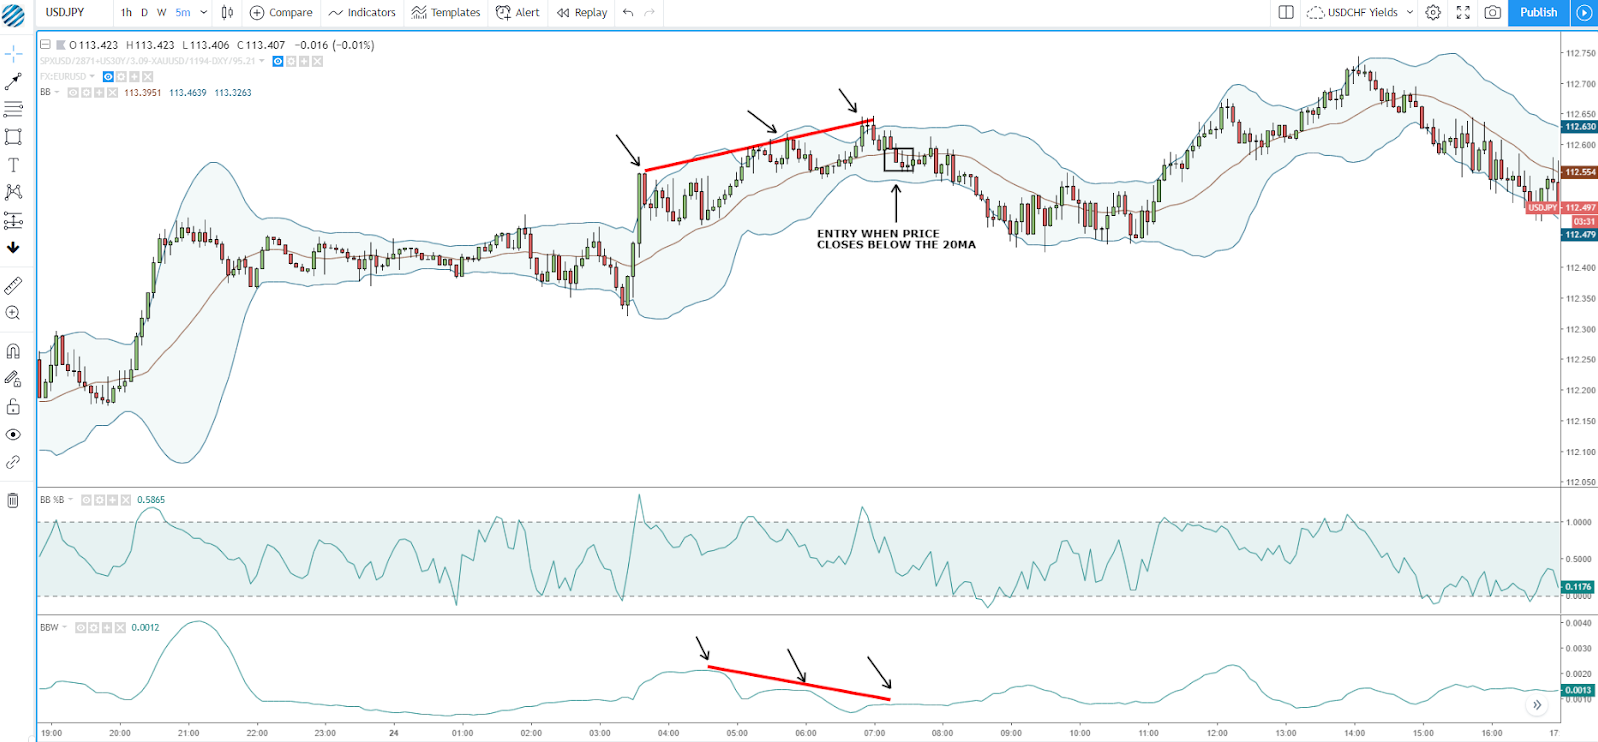
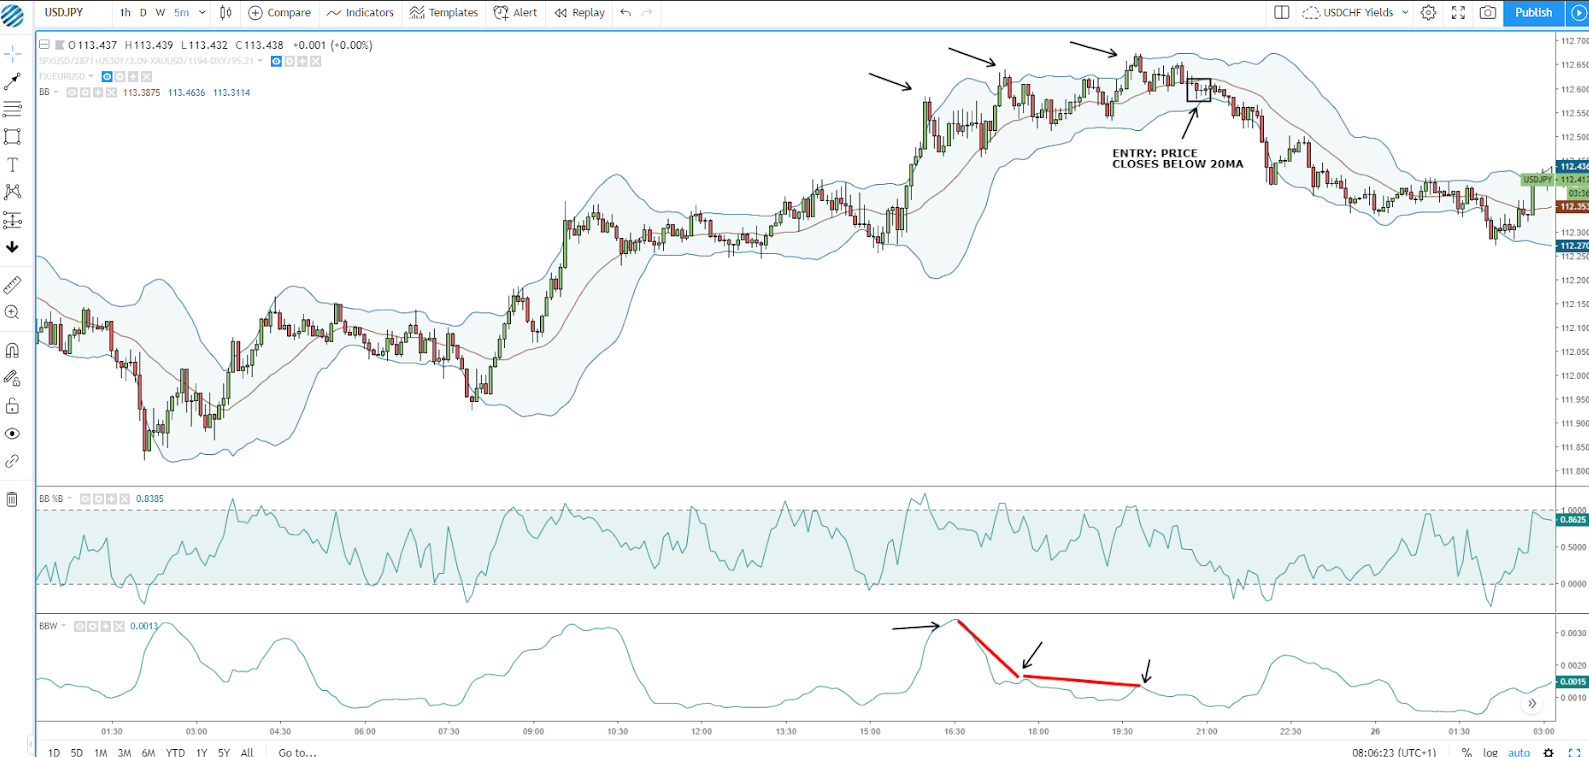
Forex Trading Strategy 3: Trend exhaustion strategy
This is a counter-trend forex trading strategy as what you are looking to exploit is a reversal. A trend exhaustion during the day refers to the eventual lack of momentum to extend a directional move. The precondition is to first spot a sequence of at least 3 pushes up or down, with each pass showing a divergence between the price and the bollinger band width (BBW) in a movement often referred to as ‘compression’.
At this stage, what we then need to see is the price closing below (in the case of a downtrend) the 20-period moving average to gather enough evidence that the market is done accepting higher prices and is ready to roll over to find the next level of equilibrium, wherever that might be.
If you are going to take this type of day trade as part of your forex trading strategy, the most logical area to place your stop would obviously be above or below the highest or lowest point of the cycle. Your targets could be split into 50% at a 1 time ATR, which is when the position is moved to break even, with the remaining position aiming to reach target 2 and 3 at a distance of 2 times and 3 times the ATR of the timeframe traded. The best way to enter this forex trading strategy, given its dynamism, is on a market order.
Forex Trading Strategy 4: Breakout strategy
A breakout trade can be played in many different ways. However, for the purpose of keeping it simple yet effective, the use of the bollinger band will be helpful here.
First, one must understand that the bollinger band follows the universal law of contraction followed by expansion. What this means is that when the bands squeeze together, it suggests that energy (volatility) must be released, which is why expansion, which acts like a rubber band or spring. It is on this transition from contraction to expansion that the opportunity to trade this breakout forex trading strategy may arise.
To qualify a breakout trade as valid, we must first find acceptance via a couple of closes outside the broken range as the period of compression comes to an end. Once that is confirmed, we can start looking for a potential entry on a retest of the mid bollinger band (20 moving average). The stop could then be placed at the other extreme of the range with a few pips of a buffer. As above, your targets could be split into 50% at a 1 time ATR, which is when the position is moved to break even, with the remaining position aiming to reach target 2 and 3 at a distance of 2 times and 3 times the ATR of the timeframe traded.
In the chart below, you can find an illustration on how a day breakout out of a compression period plays out.
Forex Trading Strategy 5: 100% Fibonacci projection strategy
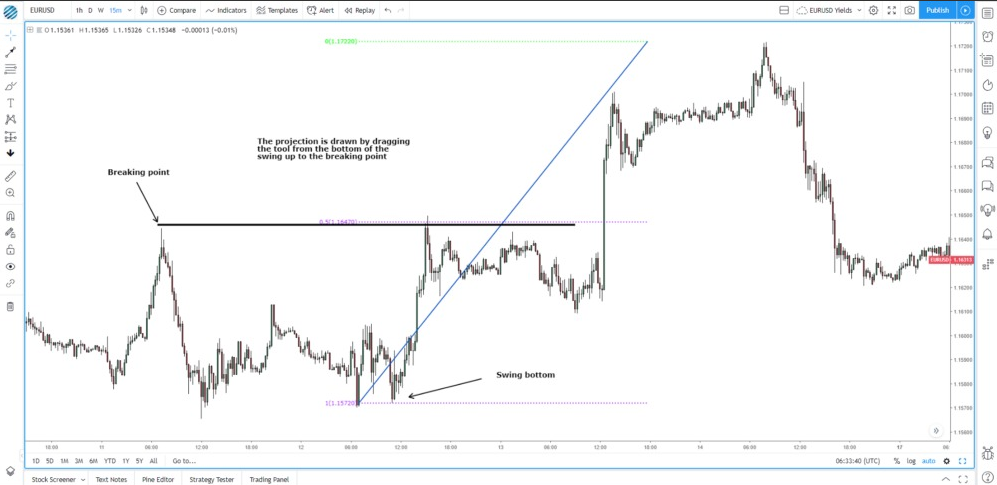
This technical analysis trading strategy can be categorized as counter-trend, as it aims to pick potential tops and bottoms based on the concept of symmetries around market cycles. By drawing a 100% Fibonacci projection, the trade will aim to get the best possible pricing for that day before a potential reversal in price.
These reversals often occur due to the side in control taking profits off the table, counter-trend positions added by contrarian players or market makers incentivized to fill out the area with heavy limit orders.
The way to draw the projection is by dragging the Fibonacci tool from the latest swing high/low to the breaking point that confirms a new cycle. The type of entry would be a limit order with a stop loss at the same distance as the ATR (average true range) of the chart traded. Your targets will still remain the same as the other strategies, which means taking 50% off the table at a 1 time ATR and move to break even, take another 20/30% at target 2 at a distance of 2 times and the remaining at 3 times the ATR.
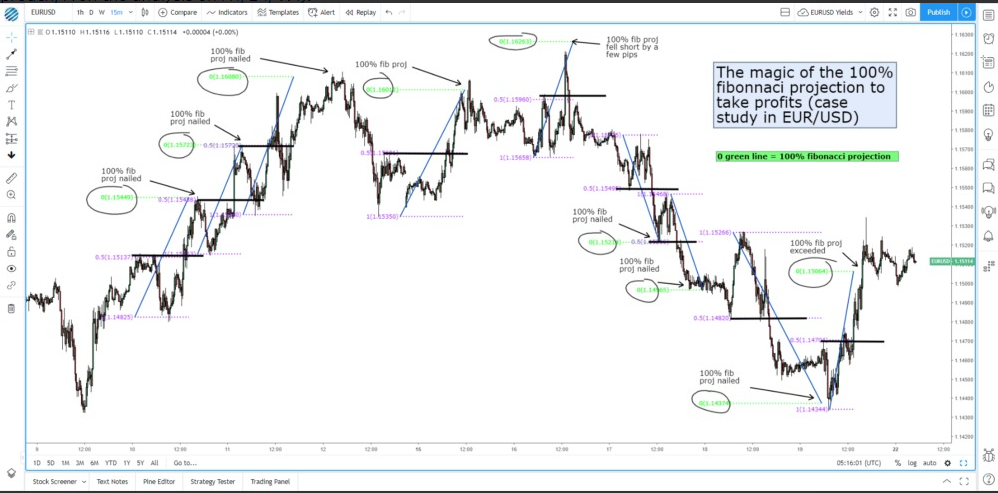
In this EUR/USD Case Study, the 15m chart has been selected to demonstrate a multitude of examples and the high accuracy rate for the 100% projection target to be an inflection point for price to reverse. The higher the timeframe to calculate your target projections, the more relevant it’s going to be. Out of the 9 projections drawn, in 7 occasions, the 100% projection represented the exact level where price turned around. In 1 instance, the 100% projection failed to be reached by a few pips (Oct 16). In the 100% projection on Oct 19, it was the only time that this forex trading strategy, 100% projection was shrugged off and price continued.
Forex Trading Strategy 6: Liquidity grab strategy
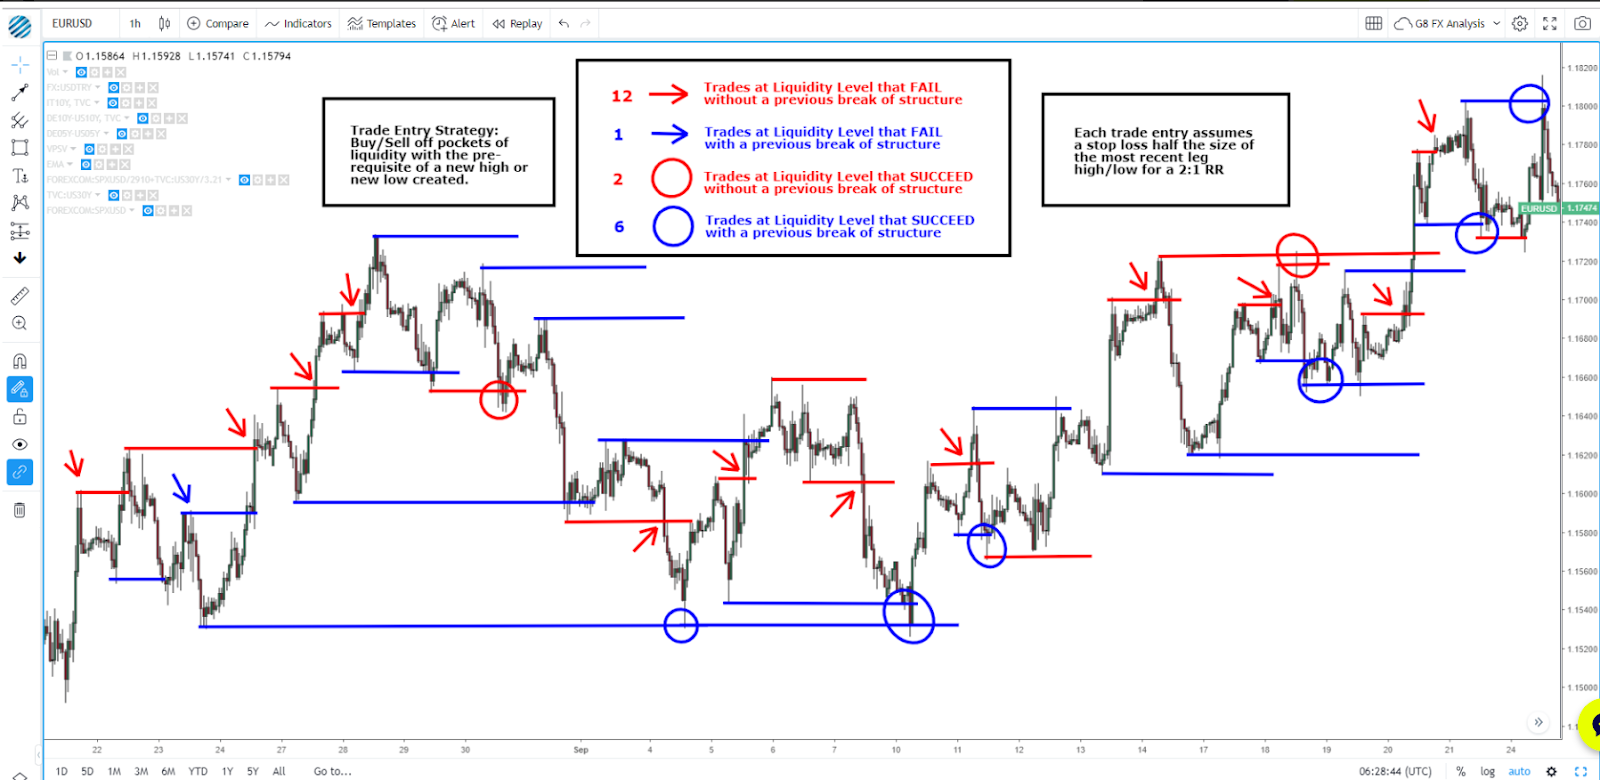
This is generally a day trend-following strategy best executed via a limit order at a level of liquidity, which in layman terms, it means to engage at a key horizontal support or resistance if the pre-conditions are met. What it consists of, firstly, is to identify these levels in the chart by drawing a line from the latest swing high/low and extend it all the way until it intersects with price again. Next, out of all the lines drawn, you will only trade the levels that led to a break in the market structure (via higher highs or lower lows).
Once this occurs, the pre-conditions are validated to engage in a buy or sell on a test of the level, as long as the market structure still remains bullish for longs or bearish for shorts. In the EURUSD hourly chart presented below, I randomly selected over a month worth of trading the EURUSD, with a blue line drawn if the liquidity level led to a break in the market structure (via higher highs or lower lows).
The entry as part of this forex trading strategy sets a limit buy or sell, with a 2:1 risk-reward, placing a stop loss at a distance half the size of the previous swing low/high extension, which would make it quite a challenge to reach the stop before an opportunity to move to break even. The trade is secured after the price runs a distance equal to the stop loss size, time when a move to break even is warranted.
In the charting exercise, trading at the liquidity levels in blue, which respects the parameters to validate trades on this particular strategy, clearly maximize one’s odds of success with over 6 winners for 2:1 risk-reward and only 1 loser. This might well be a strategy that may suit your trading style.
Forex Trading Strategy 7: Right shoulder strategy
Unlike most conventional forex trading guides out there, where it advises to take the breakout of the neckline as your entry signal in the head and shoulder pattern, there is a better way to strategize the entry of a head and shoulder forex trading strategy. But before that, let's ask ourselves, what does the H&S pattern communicate? Well, the risk that the market may be carving out a potential top or bottom, hence a trend change might be in store any day.
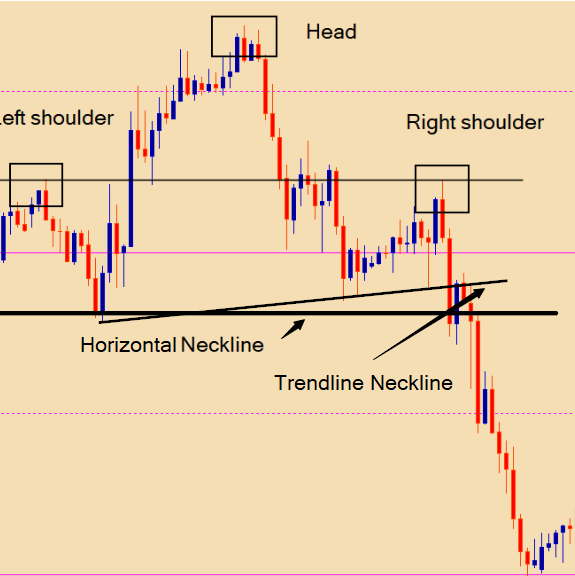
In many cases, trading the break of the neckline (1) forces you to broaden your stop to a distance that makes it harder to achieve an attractive risk-reward. Conversely, if instead, you trade based on the expectation that the 2nd shoulder will be formed (2), you place yourself, from a risk-reward standpoint, in a far better position. You can get to reduce the stop size by over 50%, if not more.
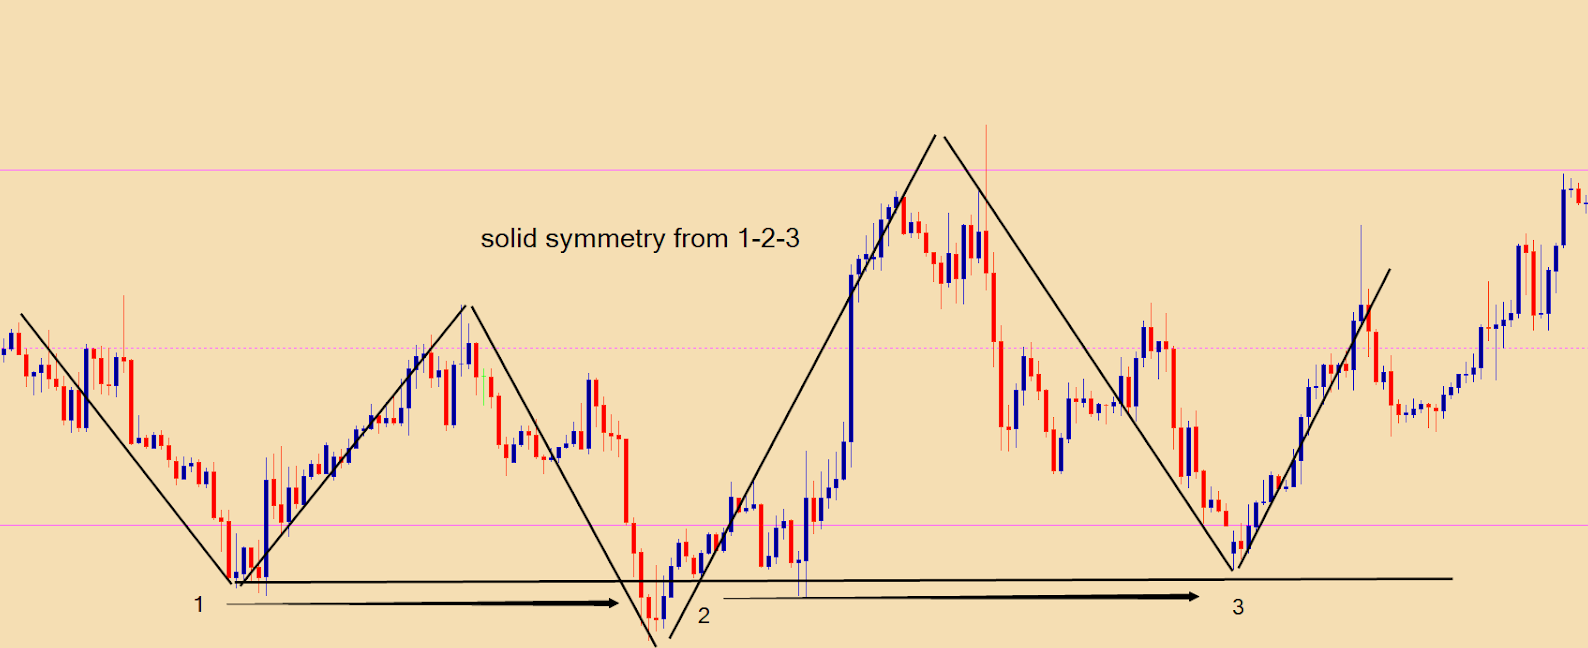
Therefore, this forex trading strategy is meant to capitalize on the anticipation that the 2nd shoulder will be created at a level similar to where the first shoulder was formed as the image below illustrates.
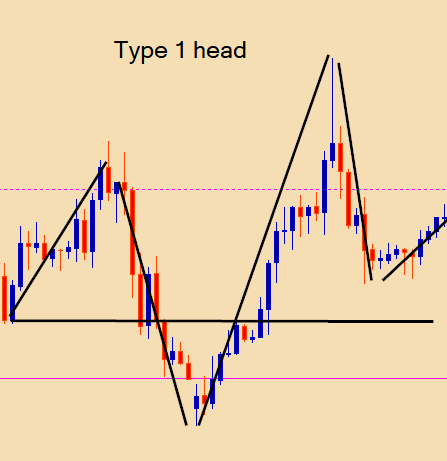
As a qualifier, keep track of the acceleration and the magnitude of the movement in the formation of the head sequence. The stronger the impulsive departure and what it achieves, the more chances that when/if revisited, the 2nd shoulder will offer value as a reference point for an entry.
Below is the best case. It consists of a strong imbalance of demand or supply that break above or below the 1 shoulder’s swing high/low. It achieves what’s often referred to as a break of structure, hence why a retest of the point of reference created by the 2nd shoulder represents an attractive proposition.
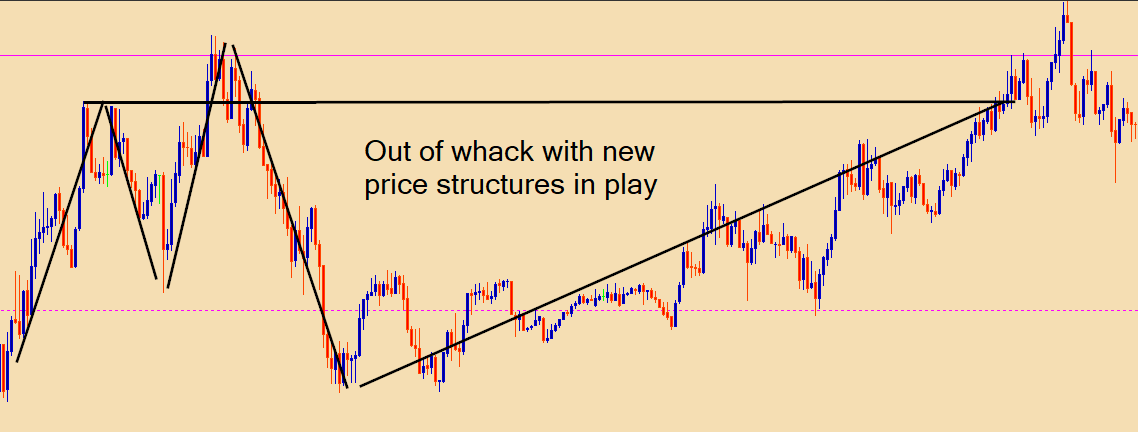
Besides, the H&S trade must respect certain symmetrical traits to be valid. While you will be hard-pressed trying to find head and shoulder sequences with an exact symmetrical composition, you must set your own limit on how tolerant you get to be. If the test of the 2nd shoulder occurs at a time when the context of the pattern has completely lost its relevance given what’s occurred, in terms of price action, since the test of the first shoulder, it no longer makes it a tradable valid pattern. See below 2 examples, the first where the pattern still holds symmetrical relevance, while the second doesn’t.
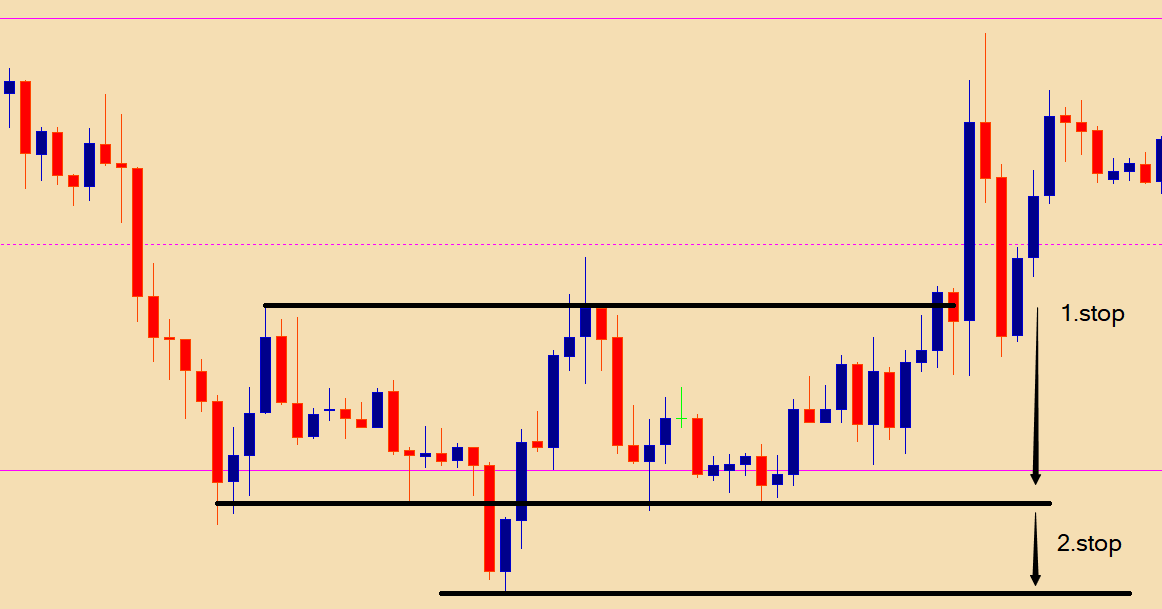
The trade, to recap, would be to execute a limit order around the level where we expect the 2nd shoulder to be formed, with a stop loss a few pips beyond the head as that’s what would invalidate the pattern. The move to break even should occur when the price has run the distance of our stop and take profit targets could be as follows: 50% at the neckline, which should offer at least a 2:1 risk-reward, with the rest of the position at different intervals of 25% each at target 2 and 3, which are tentative based on context.
Forex Trading Strategy 8: Baseline breakout strategy
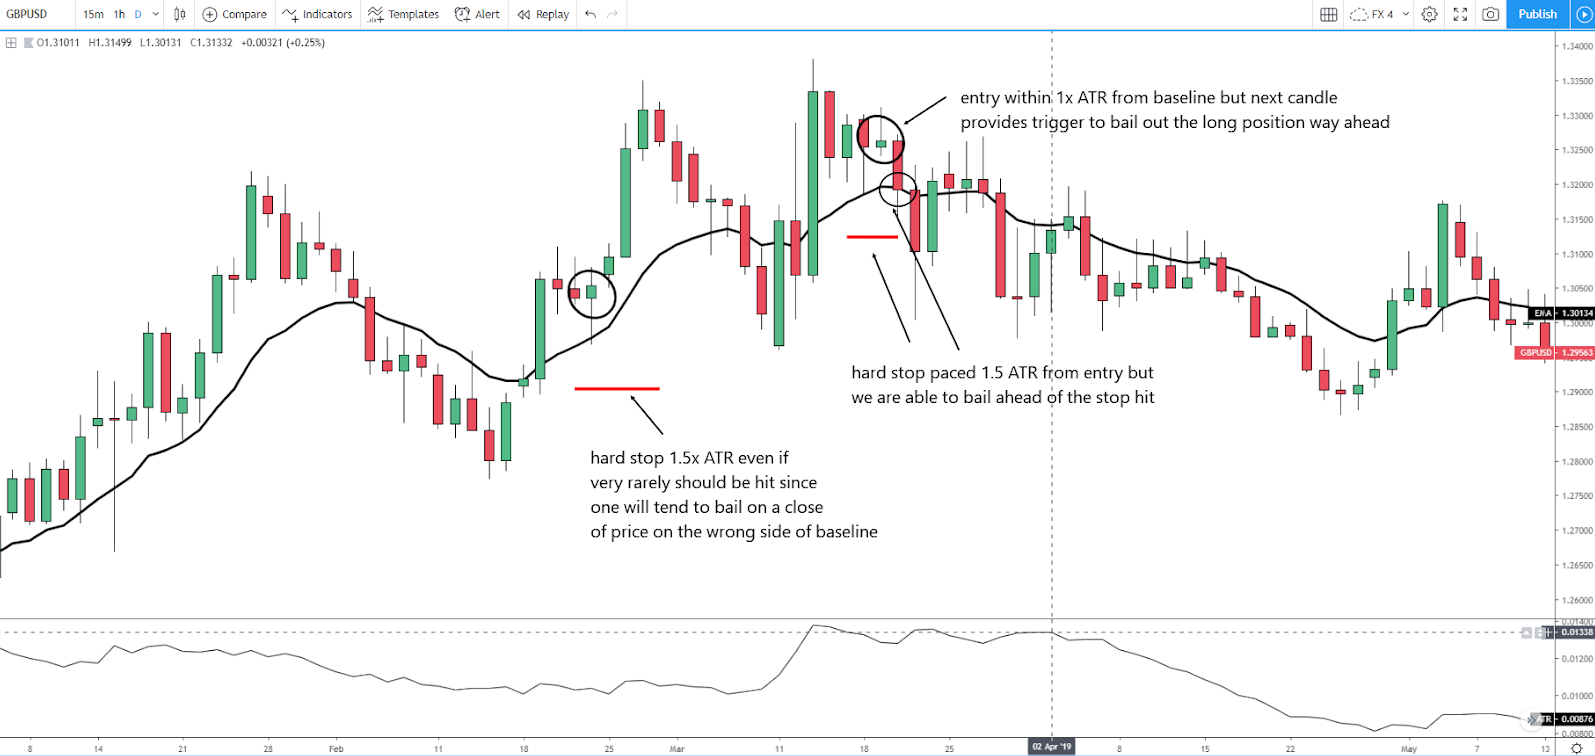
This is a trend-following forex trading strategy with a few elements that must be in congruence to validate the trade that day. Firstly, price must close above the 13-ema (baseline) for a long signal or below for a short signal. Secondly, the penetration of the baseline must occur with rising tick volume, ideally above its average. This would be an important pre-qualifier to understand the commitment of players to acts as a trigger.
Next, one needs to account the ATR. The way the ATR can be married with the baseline to make the strategy more robust in order to minimize unnecessary losses and controlling our risk management is by setting the following rule: If the close of the candle above or below the baseline is beyond 1 time (1x) the ATR value, we will determine that the entry price is far from ideal as the price paid is overstretched. Any distance lower than 1x the ATR from the baseline would be an acceptable entry as part of this strategy.
The ATR will also be used as the go-to indicator to objectively define, based on the pair’s volatility, where the most sensible location in the chart will be to place the stop. If the entry is subject to get a filling at a price no further than a distance 1x the ATR from the baseline, the hard stop will be located at 1.5x ATR. However, the moment the price closes on the other side of the baseline, we immediately close the position to minimize the potential loss, which should be seen as just one trade that didn’t work out.
The ATR will also predefine locations to take profits. If the price moves in favor by 1x ATR, that’s enough evidence to activate a break even move. Profits could then be taken at different intervals such as 1x, 2x, 3x ATR and subject to the percentage that resonates most with your profile as a trader.
See below the example of two trades as part of the baseline breakout strategy.
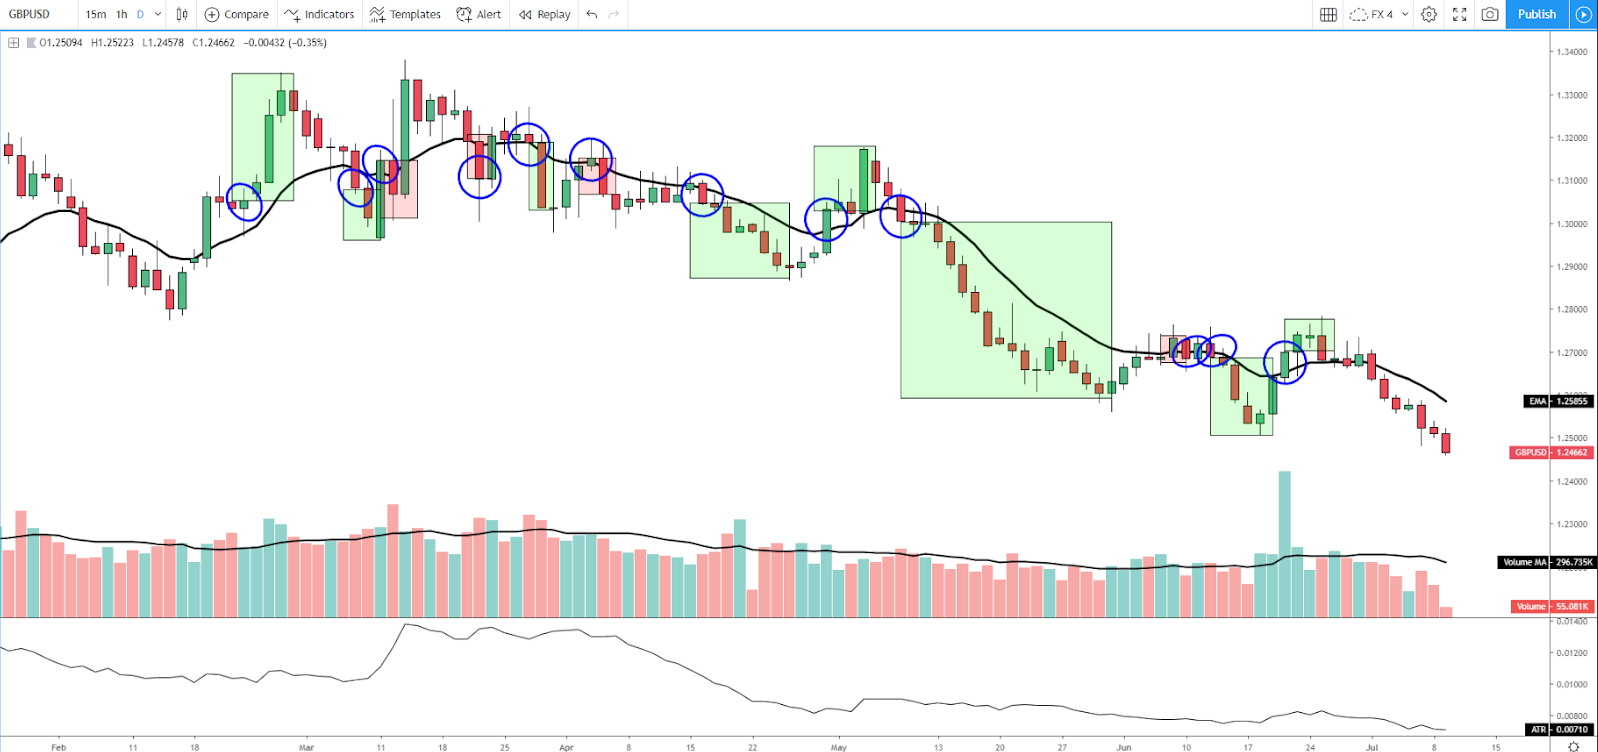
As the chart below illustrates, by factoring in the ATR to control risk management, alongside tick volume as an added pre-qualifier, out of 19 trades in GBP/USD during 2019, it gives 12 winners with only 4 small losses, taking the win rate to 66%, and not to forget that the risk-reward continues skewed largely towards much larger profits than losses as the system gets us out of bad trades once the baseline is retaken.
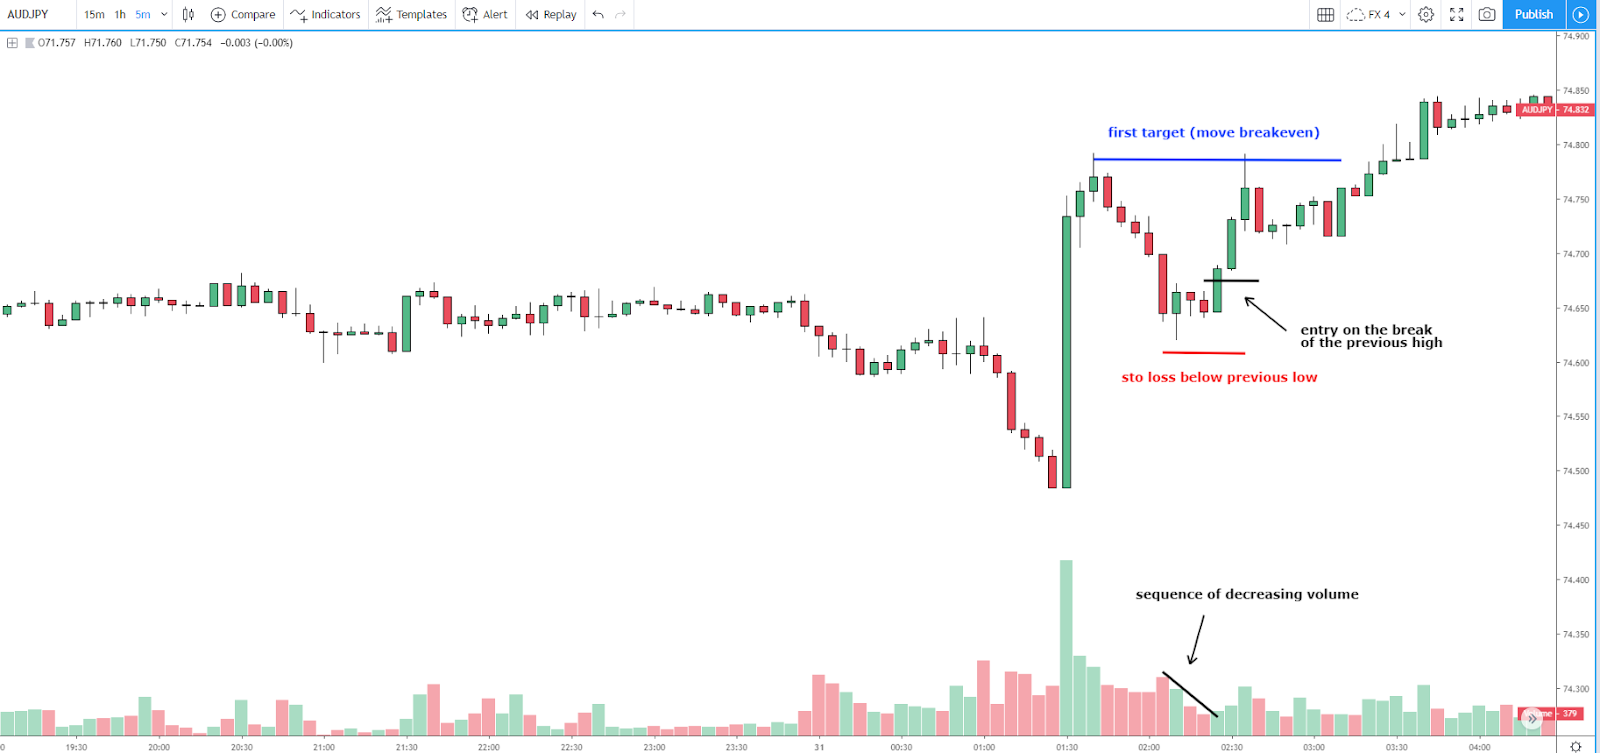
Forex Trading Strategy 9: Squeeze strategy
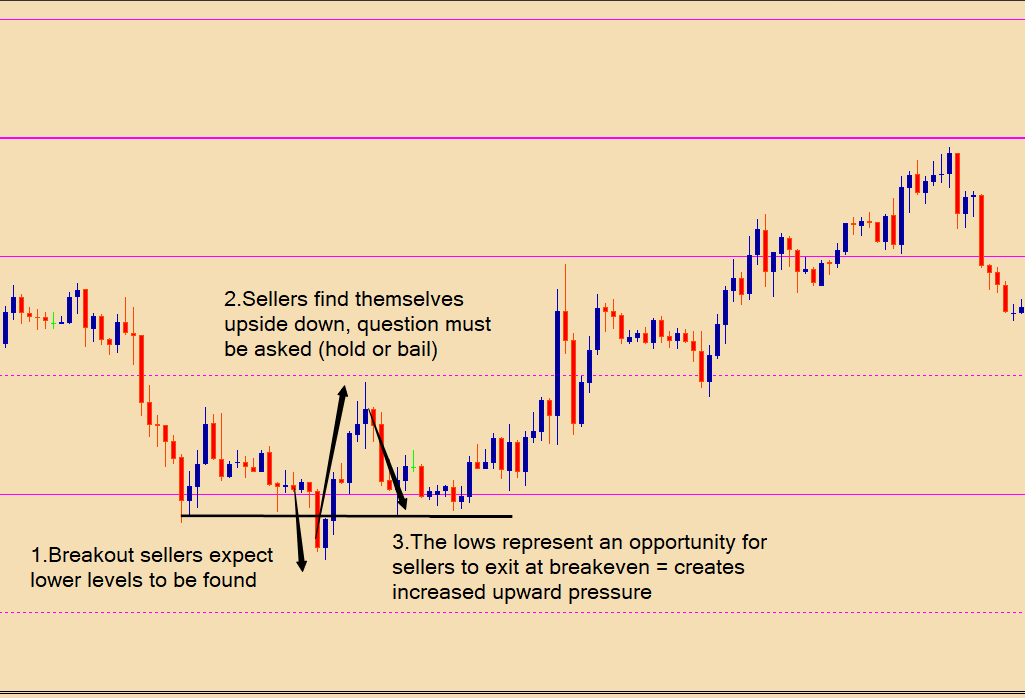
This trend-following setup is all about identifying what’s called in financial market terminology a failure to rotate in the context of a typical ABC correction context. The rotation is successful when the price reaches the previous fractal pivot point or swing high (in an uptrend).
Squeezes are generally against weak-handed players. If markets has been trending up, there will be an inertia by market participants to set limit orders in the direction of the overall trend, which suggests a squeeze at the top edge and vice versa.
The entry is confirmed on a break of the candle high (if uptrend) after a sequence of decreasing volume candles, with the stop loss placement below the most recent low (if uptrend), targeting as first objective for the strategy a retest of the most recent high, where the position will be moved to breakeven and as a rule of thumb, 50% of profits should be cashed out, while the remaining position could aim to target a move to the 100% projection target, as per the concept explained in this article.
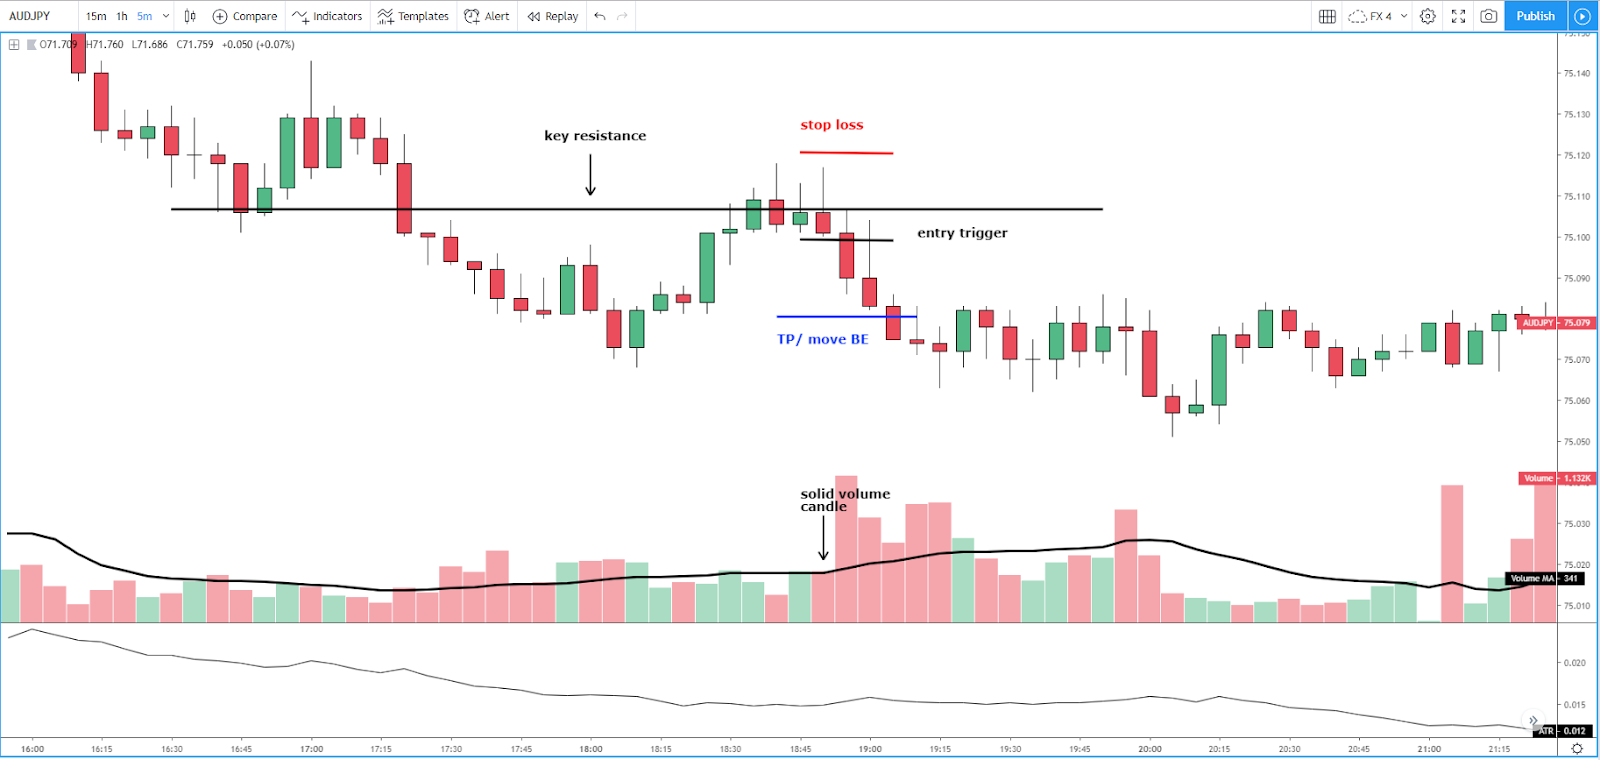
Forex Trading Strategy 10: Outside bar strategy
This candle pattern is characterized by the formation of two candles, each of different colours, with the body of the second candle with a higher high and a lower low than the first candle as part of the pattern.
The close of the second candle should be on the last third as a sign of conviction by the side creating the reversal. When an outside candle pattern occurs, it means there has been a sudden shift in order flow, and it communicates that the prospects of a reversal in favor of the direction of the outside candle.
Other factors that must be in line to add to the odds include volume in the formation of the pattern. The higher the volume, the better as it tells us more involvement by large capital accounts. As a reference, we want the volume to break above the first candle as part of the pattern but ideally to be above the average.
Another important consideration is to trade this strategy at a key level of support and resistance, as those are the areas where decisions to revert a direction will be made. If the trade is taken in the context of higher timeframe trends, all the better as it adds to the evidence of playing in one’s favor.
The chart below shows how to manage this trade. The entry would be on the break of the outside bar low, the stop loss a few pips above the high, while a move to break even would occur at a distance identical to the stop loss placement to guarantee that the trade is not a loss. The profit targets may vary, but as a general rule, aiming for a 2:1 risk-reward on 50% and the rest hoping for a runner makes sense.
How to choose the best Forex trading strategy?
I hope this article can help you identify and further understand the different Forex trading strategies. Ultimately, you must learn and adopt a trading style that resonates with your personality and understand what makes it unique for you to have an edge in the market.
Start to build experience by back testing the trading strategies, define the rules to trade the strategies that make the most sense to you, and own it.
What is the best time of the day to trade forex?
Also remember, you too must understand the following question: What is the best time of the day to trade forex? Over many decades of sample data, the forex market shows distinctive and repetitive characteristics as to when is the best time to trade, which is directly correlated to the levels of volatility.
The more the speed and magnitude of price fluctuations for the day, the better trading opportunities that exist. The overlapping of forex trading between NY and London is the perfect time to deploy one's preferred forex trading strategy.
At Global Prime, we ensure that this trading experience is facilitated with the lowest possible spreads and lightning fast execution. What will make the difference is to identify and follow your own idiosyncratic way of trading the markets rather than follow someone else’s trading style.
However, even after taking ownership of how you are going to be trading the markets, you still need a guiding purpose and to be authentic with yourself about your performance. This article will help you open the first doors of experimentation.
To learn more about the institutional / professional trading services provided by Global Prime, or to contact the firm, please click on the link below:
LiquidityFinder
LiquidityFinder was created to take the friction out of the process of sourcing Business to Business (B2B) liquidity; to become the central reference point for liquidity in OTC electronic markets, and the means to access them. Our mission is to provide streamlined modern solutions and share valuable insight and knowledge that benefit our users.
If you would like to contribute to our website or wish to contact us, please click here or you can email us directly at press@liquidityfinder.com.