

Analysis of CCI and Gold: How Does Consumer Confidence Actually Shift the Market?
 ACY Securities - Ira Reyes
How Does Consumer Confidence Trigger Safe-Haven Demand?
A decline in Consumer Confidence serves as an early warning for a GDP slowdown, as reduced household optimism directly translates into lower future spending. Since consumption is the primary engine of economic growth, a sharp drop in outlook signals a transition from expansion to recession, forcing investors to abandon growth-oriented stocks.
What is GDP?
GDP (Gross Domestic Product) is the ultimate scorecard for a nation's economic performance. It calculates the total market value of every product made and every service provided within a country's borders over a set timeframe, such as a quarter or a full year.
Why is it critical for your strategy?
Consumer Confidence Index (CCI) is a critical pillar of strategy because it acts as a high-frequency proxy for future GDP. Since household spending accounts for approximately 70% of economic activity, the CCI provides a real-time window into the economy’s primary engine long before official growth data is released.
GDP is the most comprehensive tool for measuring economic strength.
Growth vs. Recession: When GDP is rising, the economy is in an expansion phase, which generally supports higher stock prices. When it drops, the economy is contracting, which signals a potential recession and often leads to market sell-offs.
The strategic flow for trading based on CCI news.
The Macroeconomic Trading Flow
To trade the CCI effectively, you must understand the economic surprise. Markets rarely react to the absolute number, they react to how the actual release compares to the consensus forecast (what analysts expected). In simple terms, the economic surprise is the difference between what the market expected to happen and what happened. It is technically referred to as data deviation. It is the formal measure of how much an incoming data point deviates from the market's pre-existing expectation.
Markets are efficient, they price in what they think is going to happen before the news is even released. Because of this, the news itself doesn't move the market as much as the shock of being wrong.
Key Highlights
- The Price is Already Set: Before the news comes out, the market has already guessed the result and adjusted prices to match that guess. This is called being priced in.
- The Number Doesn't Matter, the Gap Does: If the news says 100 and everyone expected 100, the market won't move. The actual number isn't new, it's just confirmation.
- The Shock Moves the Market: Trading happens when the market is wrong. If everyone expected 100 but the news says 80, investors must hurry and change their trades to fit the new reality.
- The Bottom Line: You aren't trading the report; you are trading the gap between what people thought would happen and what happened.
- Pre-Release of the data
When the numbers finally drop, your trading reaction depends entirely on the data comparison. This is the Economic Calendar.
The difference dictates the move. Depending on the exact numbers printed, you can expect two main scenarios to unfold very quickly on your trading charts. Let the data guide you.
Better than Expected: If the actual index is higher than the forecast, it signals higher future spending and optimism for corporate profits (Bullish for Equities and USD).
Worse than Expected: A lower index signals future caution, reduced spending, and a potential economic slowdown. (Bearish for Equities and USD).
Execution & Portfolio Impact
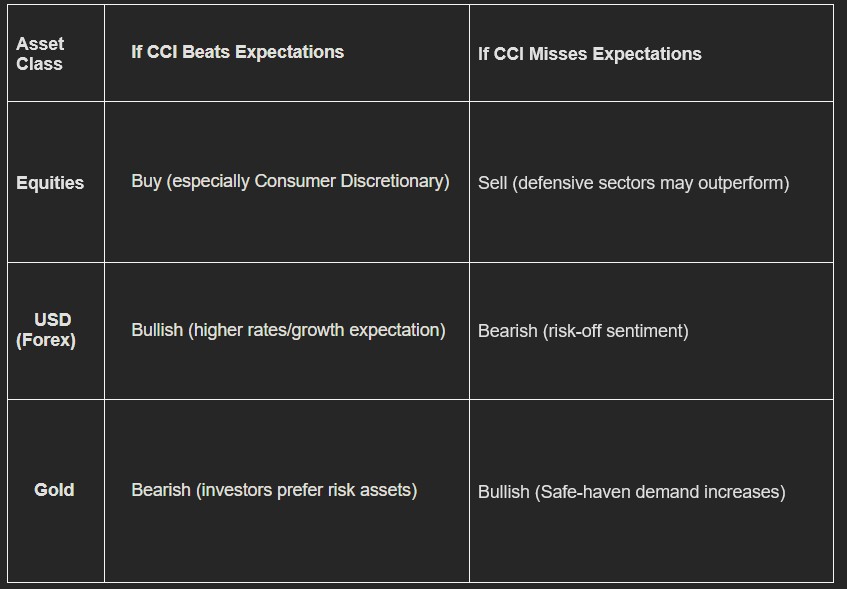
Table below explains how expectations of CCI provide movement signals per asset class.
When the Consumer Confidence Index (CCI) beats expectations, it signals economic optimism, leading investors to buy equities and the US Dollar while moving away from gold. Conversely, a CCI miss triggers a risk-off sentiment where stocks and the dollar typically fall as investors seek safety in gold and defensive sectors. Essentially, this table illustrates how high consumer confidence fuels growth-oriented assets, while low confidence drives a shift toward capital preservation.
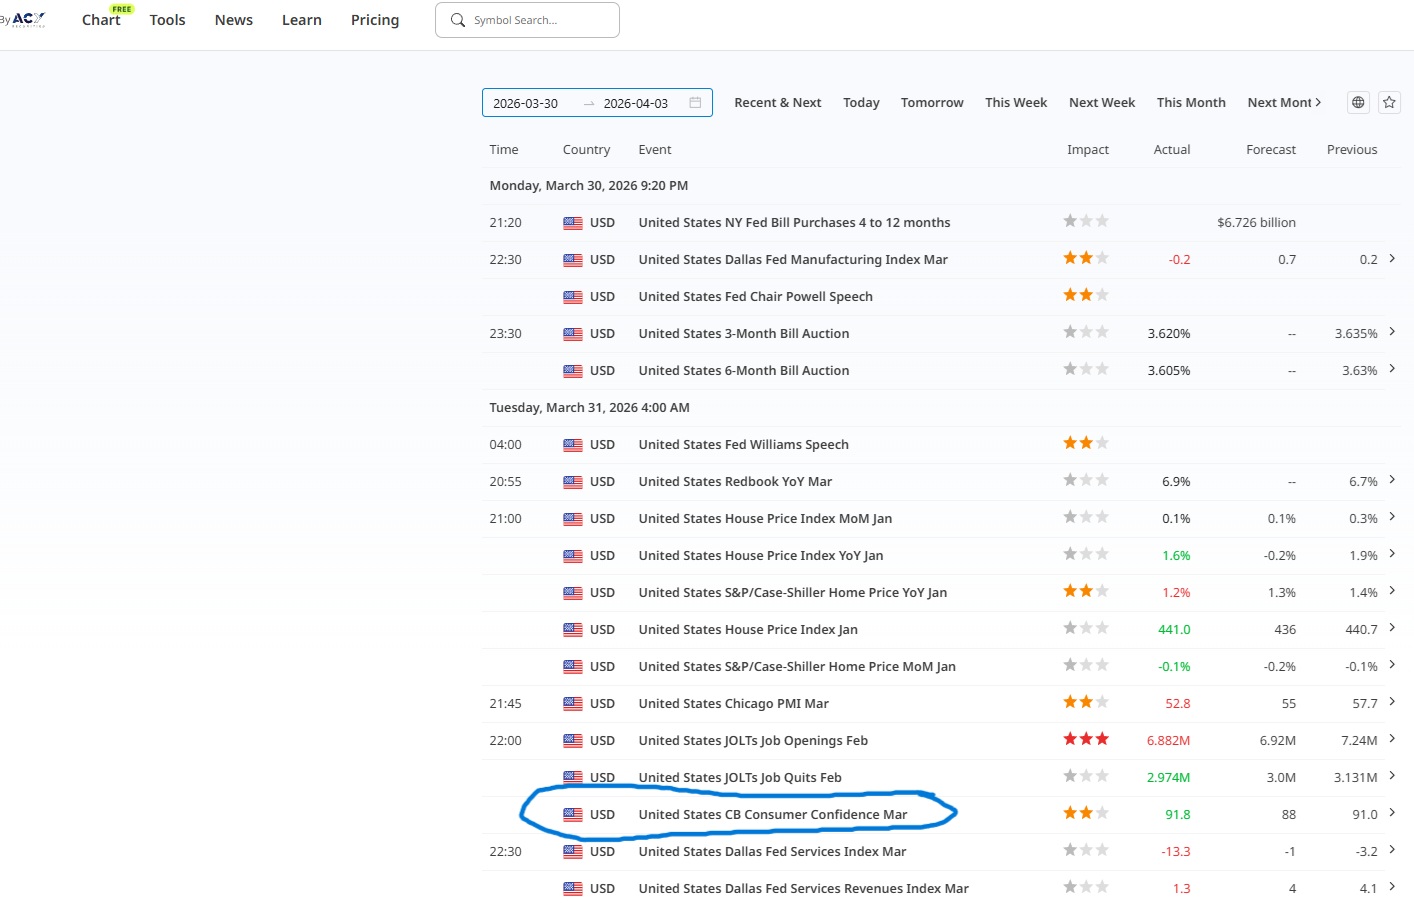
Example: March 2026 U.S. Consumer Confidence. Based on data released last Tuesday, March 31, 2026.
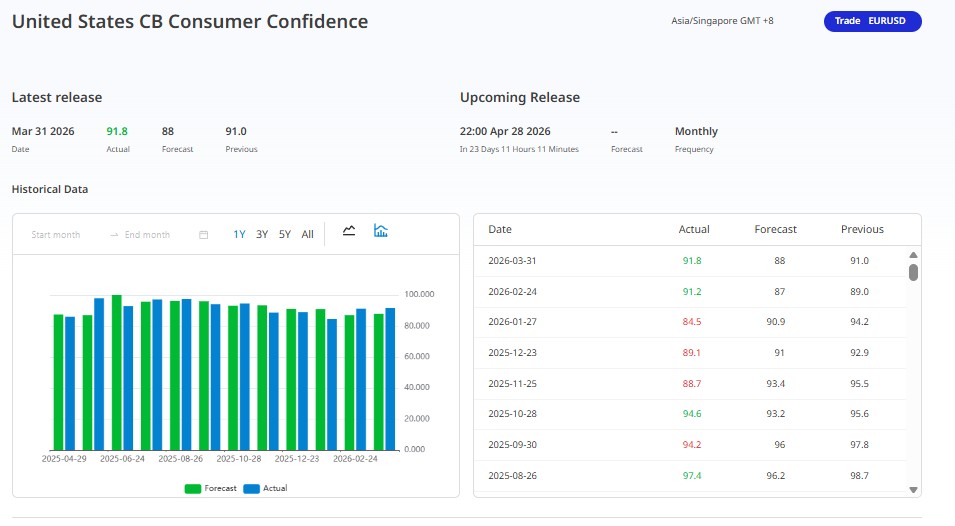
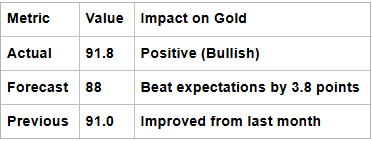
- The Data: The Conference Board reported a March CCI of 91.8.
- The Expectation: Analysts had a forecast lower figure of 88.
- The Result: The report was a beat (91.8 > 88.)
The Market Reaction (Trade)
- Immediate Impact: Gold, which is sensitive to economic signals, initially reacted to the broader uncertainty mentioned in the report (inflation/geopolitical fears). However, the general market sentiment focused on the strength of the consumer.
- Strategy Applied: A trader looking at this data will note the surprise increase. In a normal environment, this would boost USD and equities. However, because the report also highlighted rising inflation expectations (due to an ongoing oil shock), the market reaction was complex. Gold spiked above $4,600/oz, not just because of the CCI number, but because consumers also signaled, they were worried about higher interest rates and persistent inflation.
Case Study: Gold’s Reaction to the March 31 CCI Release
This illustrates the direct relationship between a high-impact economic indicator, the Consumer Confidence Index (CCI) and the price of Gold vs Dollar (XAUUSD).
While a strong economic beat is traditionally bearish for gold (as it strengthens the USD), the market action on March 31, 2026, at 22:00 provided a unique lesson in trading the narrative rather than just the headline.
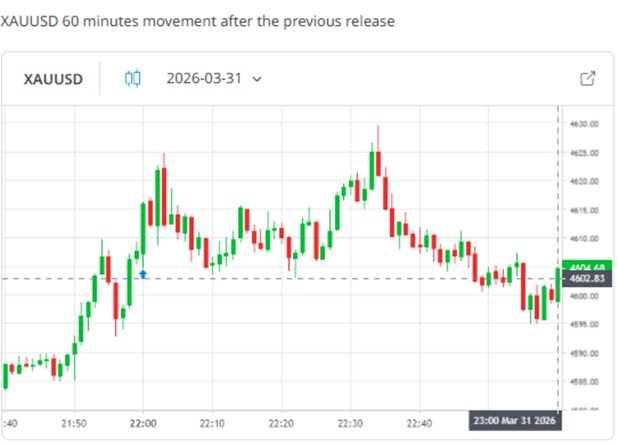
Chart Analysis: (GOLD vs US Dollar) XAUUSD 60-Minute Movement
This 1-hour candlestick chart tracks the immediate volatility triggered by the data release.
- The Initial Reaction: At exactly 22:00, the chart printed a sharp bullish (green) candle. Despite the Actual data (91.8) beating both the forecast (88) and the previous month (91.0), gold prices surged. This suggests that while the headline was strong, the market was prioritizing the underlying inflation fears cited in the report.
- Intraday Volatility: After the initial spike toward 4,622.00, the market experienced a liquidity sweep, a temporary pullback where late buyers were shaken out before resuming its climb to a session peak around 22:30.
- The Closing Trend: By 23:00, the price consolidated near 4,604.68. Although gold ended the hour higher than its pre-release level, it surrendered a portion of its shock gains as the market fully digested the report's implications for interest rates.
Always look for the Inside the Data details. The headline index (91.8) was positive, which generally supports economic growth. However, the report also contained pessimistic components regarding inflation expectations. A sophisticated trader doesn't just trade the beat, they trade the narrative behind the numbers (example, The consumer is strong, but they are terrified of inflation).
Use the Present Situation vs. Expectations. The CCI is usually split into two parts. If the Present Situation is high, but Expectations are crashing, the market may front-run a recession regardless of the headline number.
Wait for the Initial Volatility: Economic news releases often cause whipsaws (sharp, misleading price moves) in the first 5–15 minutes. Wait for the market to digest the report before placing large positions.
Conclusion & The ACY Edge
The Consumer Confidence Index is a vital indicator that reveals future spending trends and economic health long before official growth data arrives. While a beat in the numbers usually signals investors to buy stocks and the dollar, a discerning strategist must always look for hidden clues like inflation or geopolitical fears that can override these standard rules. Ultimately, successful trading requires looking beyond the headline figure to understand the deeper market narrative driving price action.
Disclaimer: This content may have been written by a third party. ACY makes no representation or warranty and assumes no liability as to the accuracy or completeness of the information provided, nor any loss arising from any investment based on a recommendation, forecast or other information supplies by any third-party. This content is information only, and does not constitute financial, investment or other advice on which you can rely.
LiquidityFinder
LiquidityFinder was created to take the friction out of the process of sourcing Business to Business (B2B) liquidity; to become the central reference point for liquidity in OTC electronic markets, and the means to access them. Our mission is to provide streamlined modern solutions and share valuable insight and knowledge that benefit our users.
If you would like to contribute to our website or wish to contact us, please click here or you can email us directly at press@liquidityfinder.com.