just now

Liquidity Finder Ltd is incorporated in England and Wales, company number 10610740, registered address 167-169 Great Portland Street, Fifth Floor, London W1W 5PF, United Kingdom.
Published: just now

Bitcoin entered the week with fragile footing - and it didn’t take much to spark panic. A whale offloaded nearly 24,000 BTC (~$2.7 billion), causing Bitcoin to collapse from $117,400 to as low as $110,000 in a matter of hours. This move erased more than $550 million in leveraged longs, exposing just how vulnerable liquidity remains when large players strike.
The sharp selloff resembled a classic liquidity sweep, a move often discussed in institutional trading frameworks like Smart Money Concepts, where price aggressively clears positions before seeking equilibrium. The timing - during thin weekend markets - amplified volatility, underscoring how accumulation and distribution cycles can drive exaggerated swings.
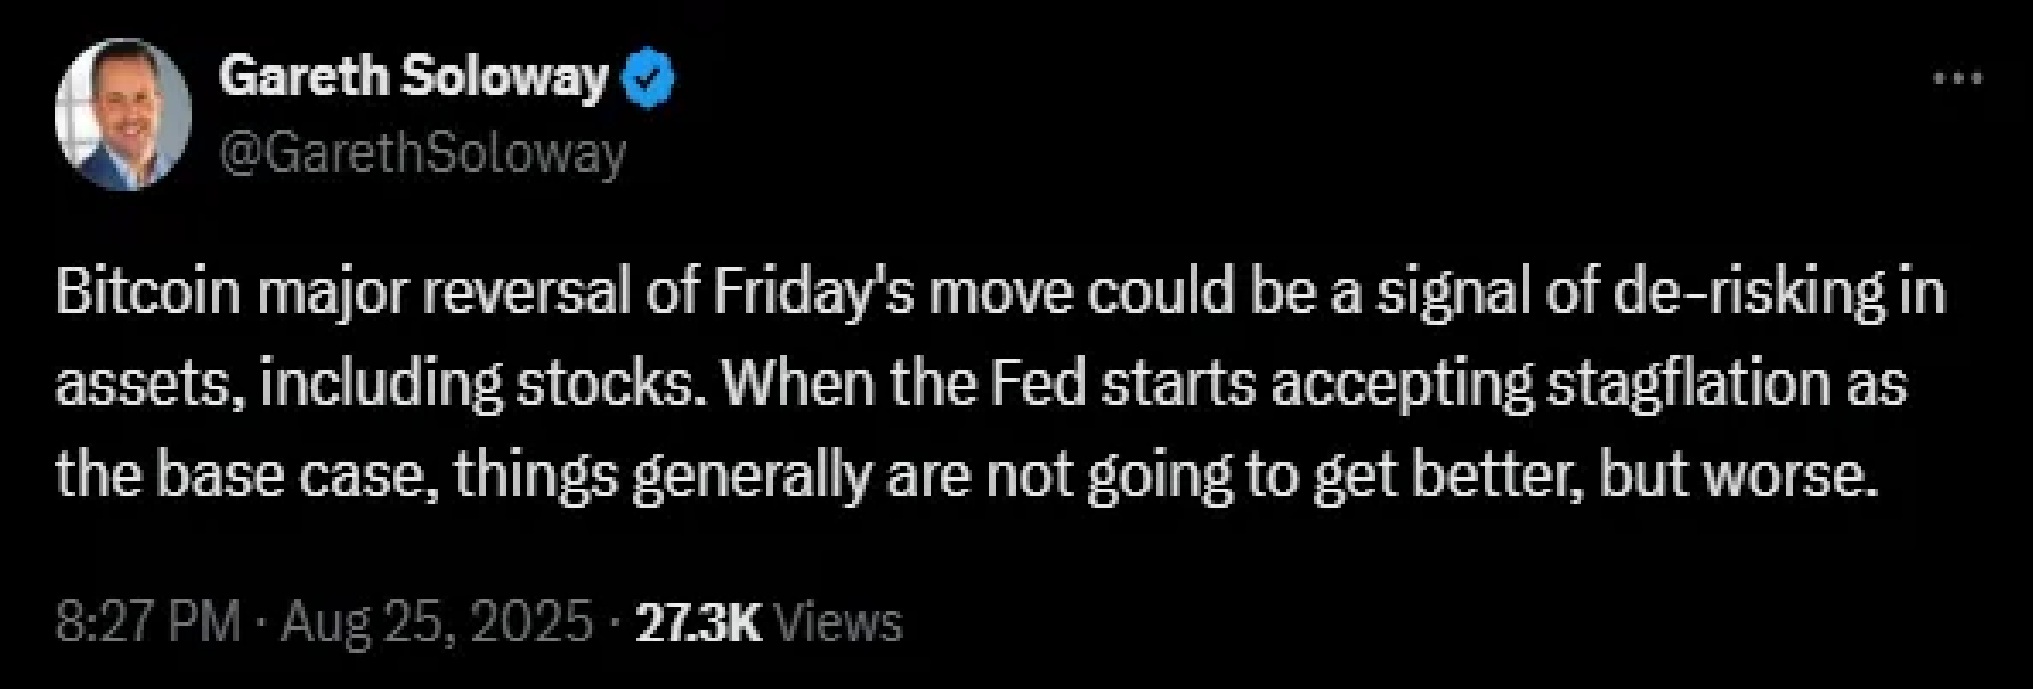
Beyond the whale dump, the macro environment is turning toxic. Market strategists are now warning the Federal Reserve may be forced to accept stagflation - the combination of weak growth and sticky inflation - as its new baseline.
For Bitcoin, this is a double-edged sword:
As a result, Bitcoin is currently priced more like a tech stock proxy than a safe-haven hedge, meaning those without a clear risk management plan (Why Risk Management Is the Only Edge That Lasts) are the most exposed when volatility spikes.
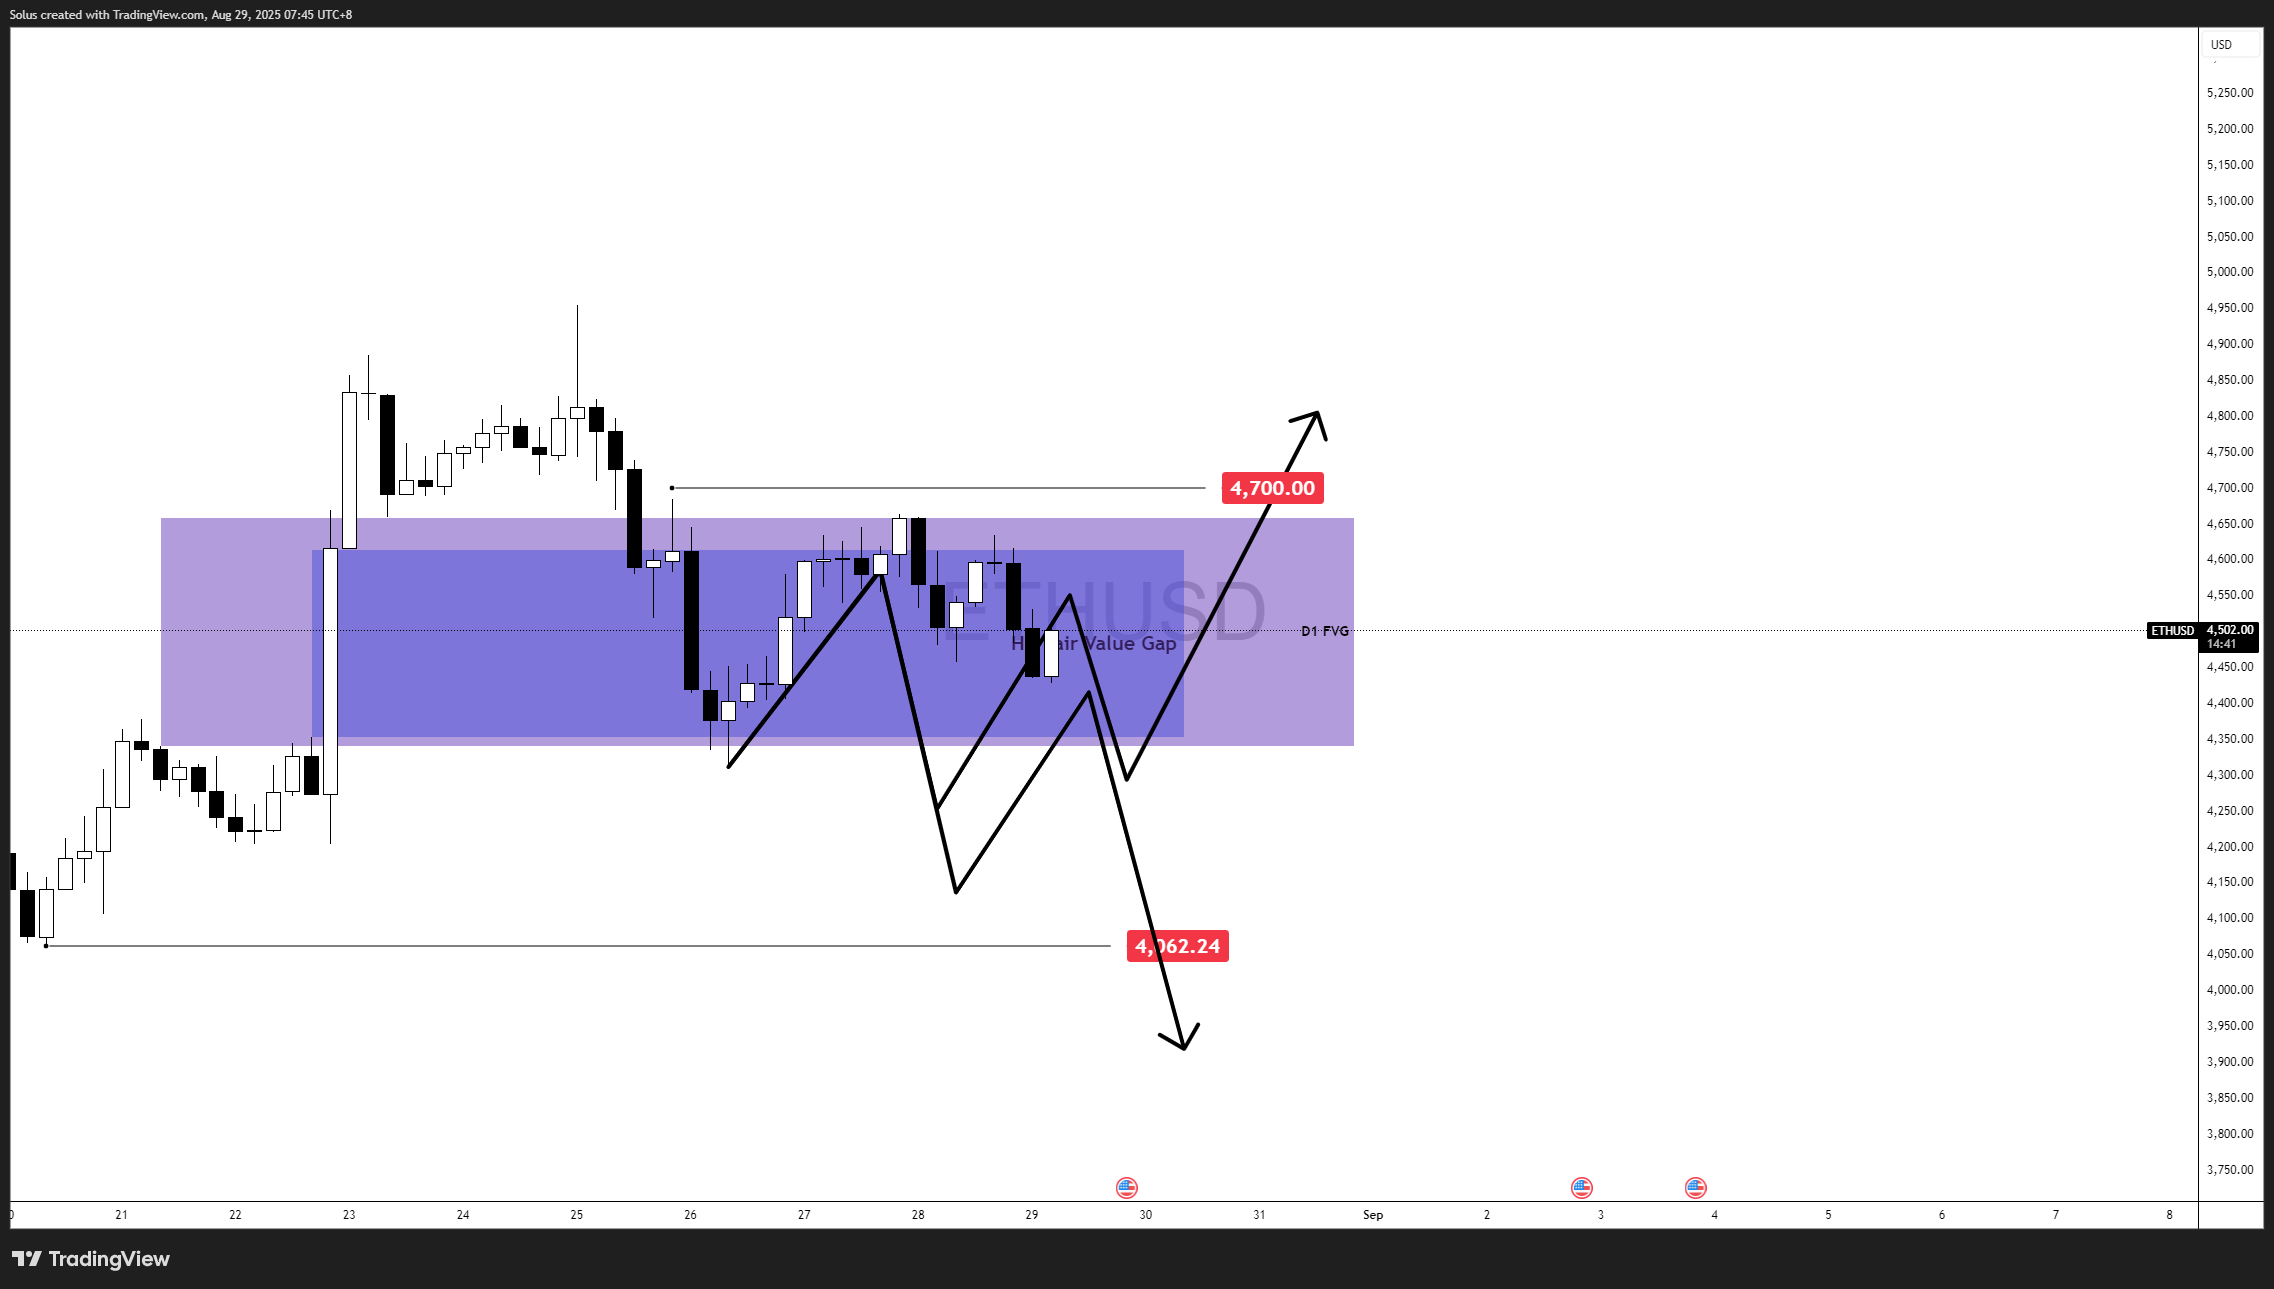
In contrast, Ethereum (ETH/USD) showed relative strength, trading near $4,427 even as Bitcoin tumbled. Buyers defended the $4,350 support, supported by rotation flows away from BTC.
This resilience reflects Ethereum’s institutional credibility and role as a yield-bearing ecosystem. For traders, this divergence highlights the importance of focusing on key price action levels (Mastering Price Action at Key Levels) rather than simply following dominance metrics.
If ETH can hold above $4,350, the path toward $4,700–$4,900 remains open, while BTC must reclaim $113K to stabilize.

The $108K level remains the key liquidity pocket. Price has tested it but not broken down, creating a “holding pattern” where both bulls and bears are positioning for the next expansion.
This type of consolidation often precedes an impulsive move, making it critical for traders to lean on liquidity sweep concepts and confirmation models rather than guessing direction. As explained in Fair Value Gaps, ranges like these are often where Smart Money builds positions before displacing price.
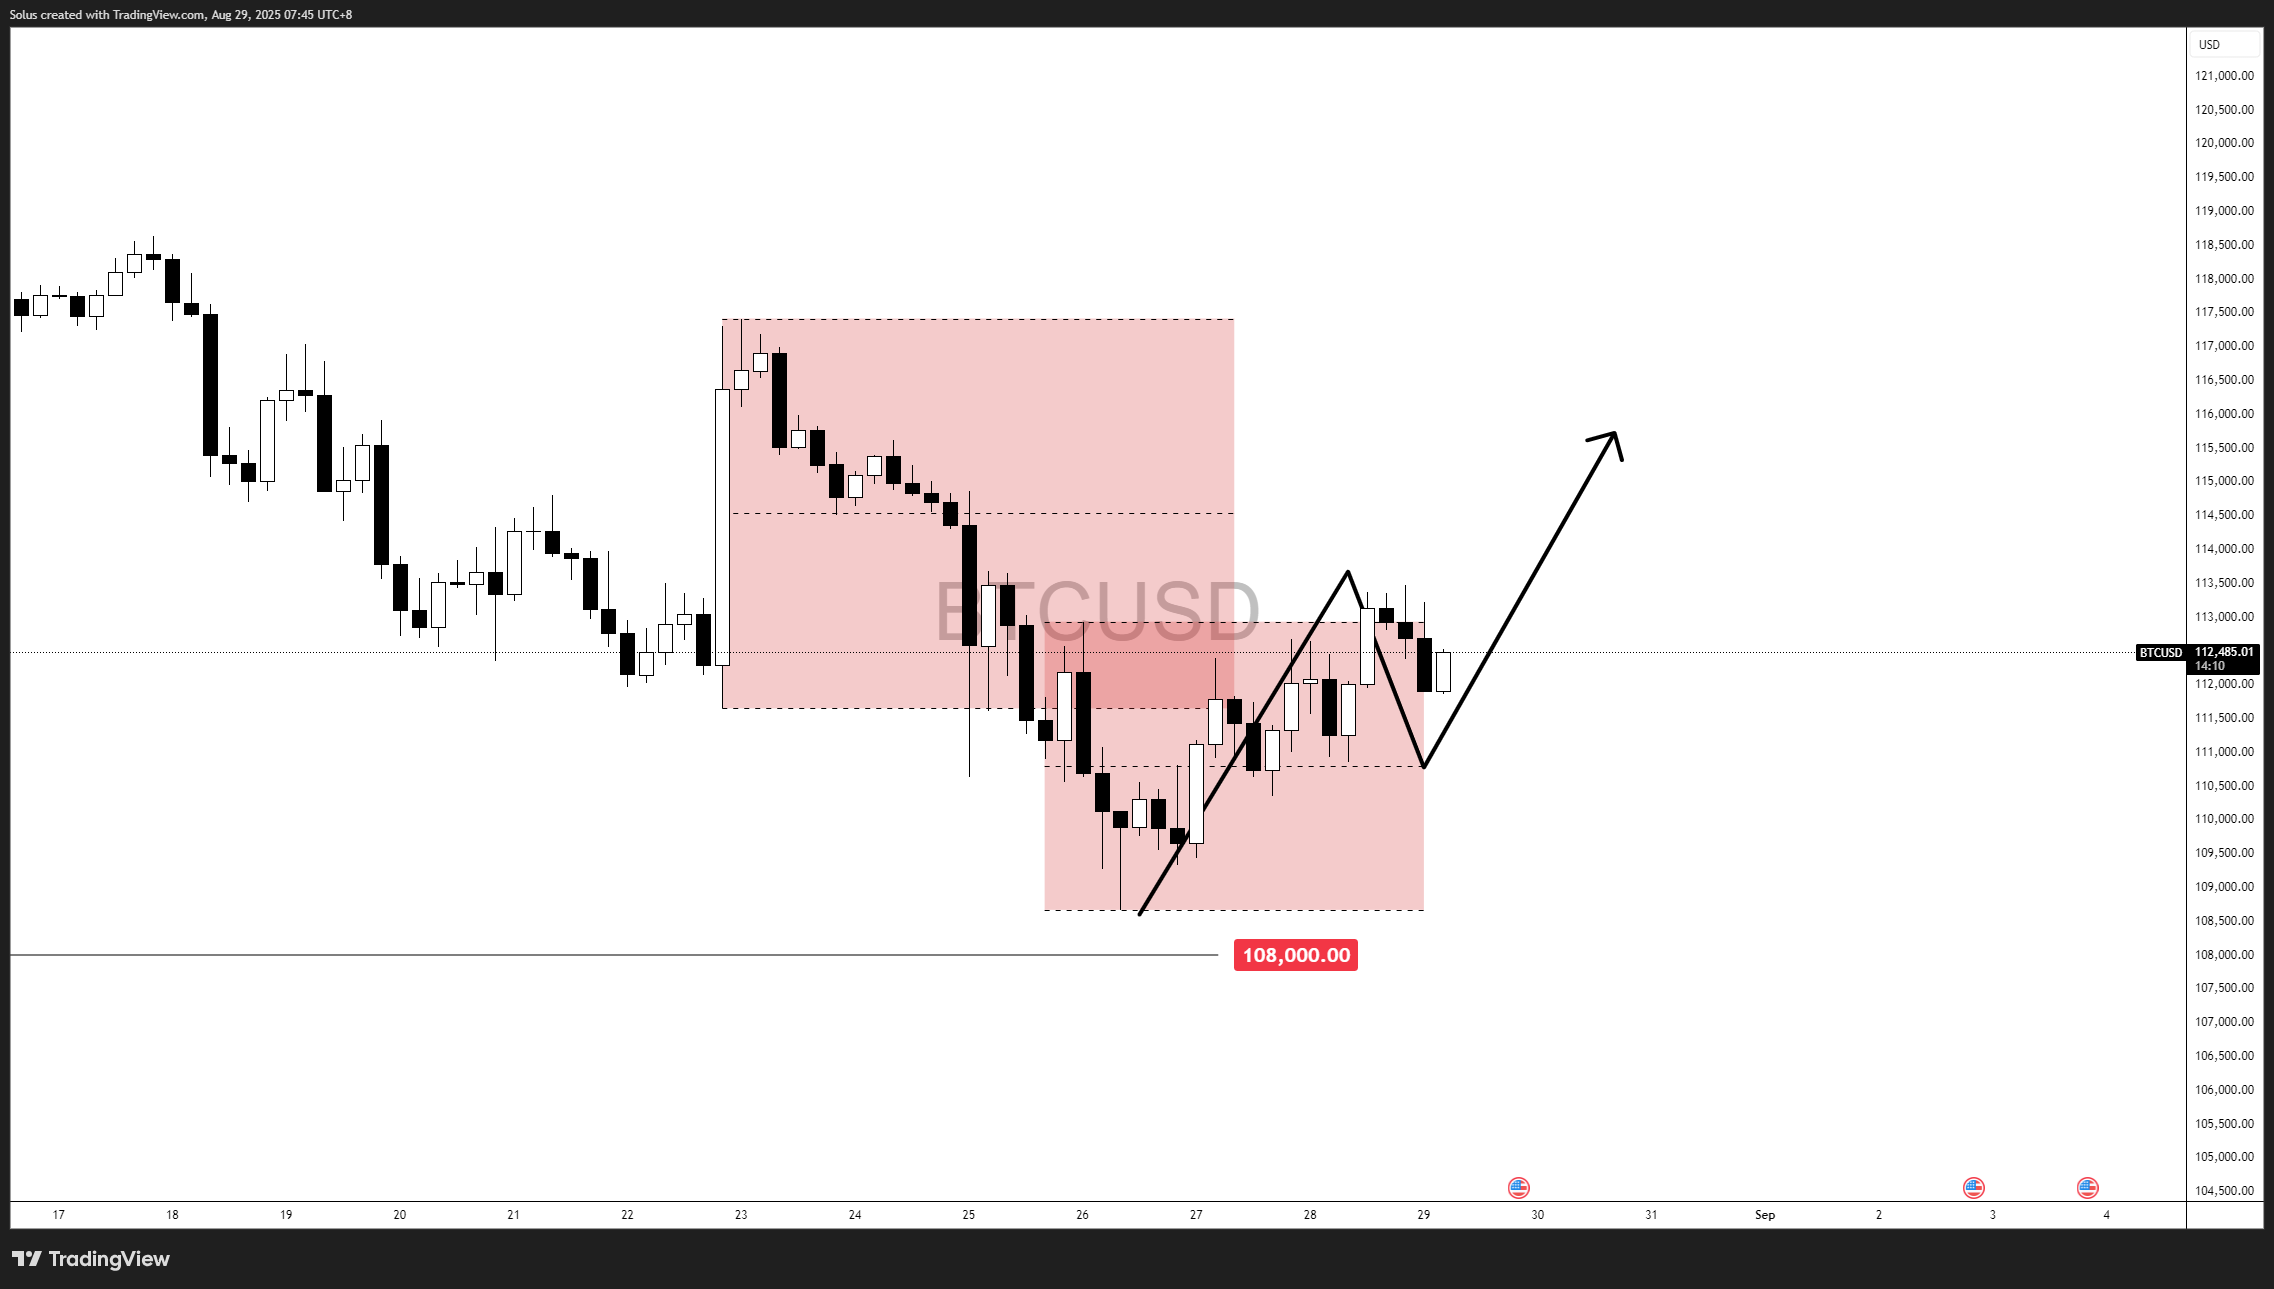
If Bitcoin dips into $108K and sweeps liquidity, buyers may step in for a relief rally:
Another scenario that we could look at: If Bitcoin breaks above $113K, we could see a continuation to the upside reaching until the $115K-$117K level.
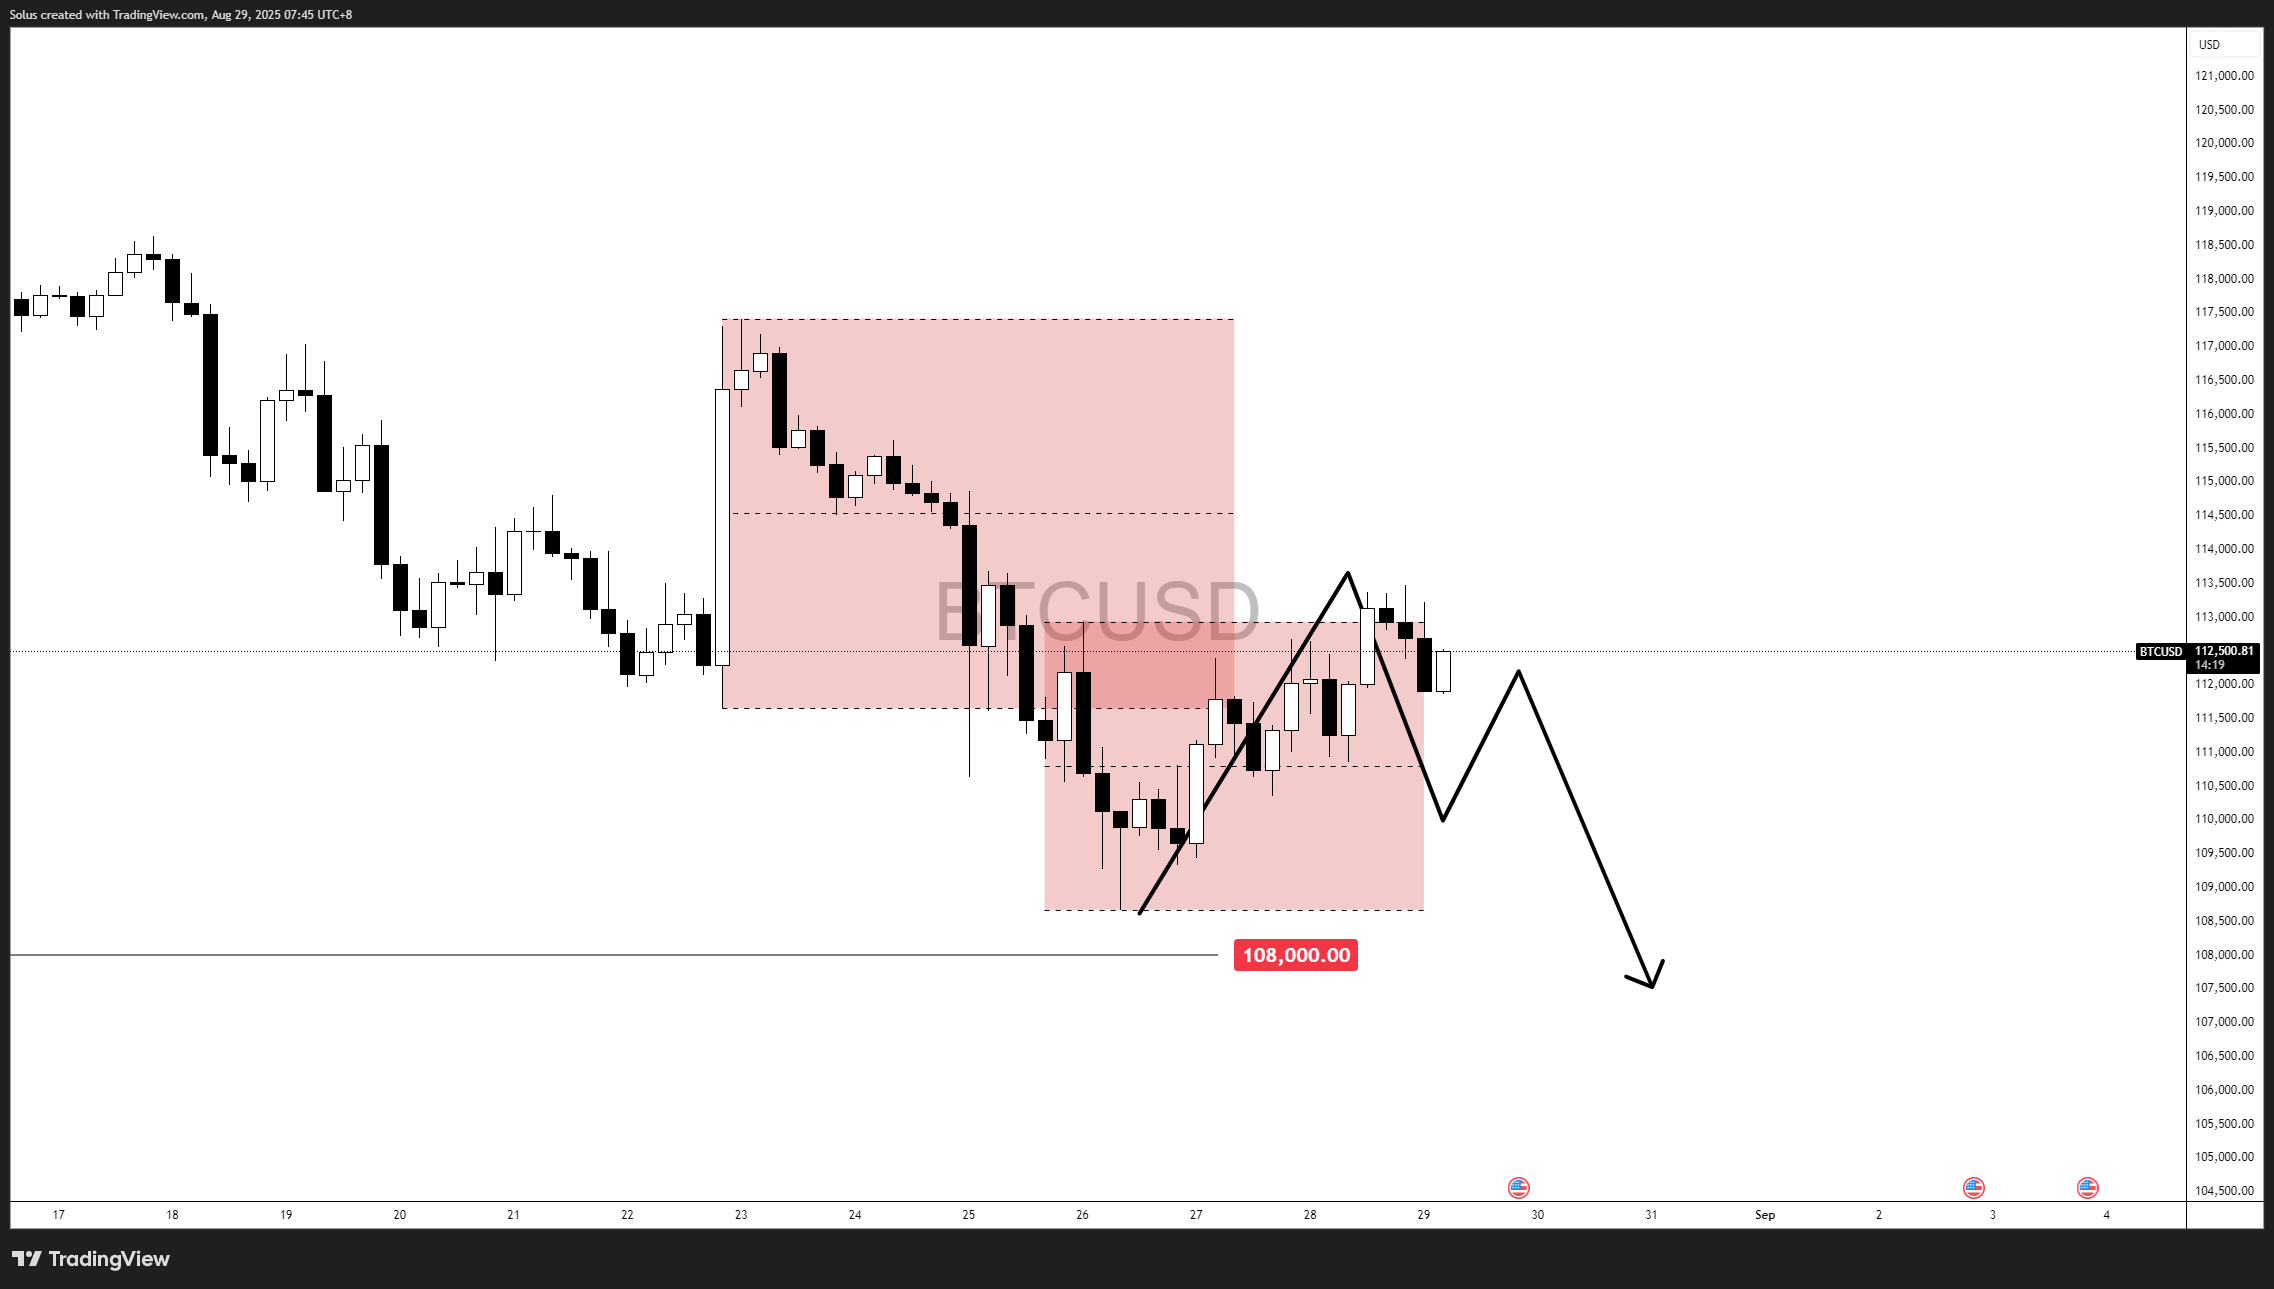
If BTC attempts a relief bounce but stalls below $113K, it risks confirming distribution. A failed breakout followed by rejection could lead to another leg down, breaking $108K and opening deeper downside liquidity pools.
Bitcoin is no longer in free fall - but it’s far from recovery. The market has entered a compressed consolidation zone between $108K and $113K, where liquidity is building before the next decisive move. This range now acts as the battleground between bulls and bears.
Ethereum’s relative resilience suggests that capital isn’t leaving crypto entirely, but rather rotating - a sign that Bitcoin is temporarily being treated as the weaker high-beta play.
For traders, the message is simple: the $108K–$113K range is the hinge point. The breakout or breakdown from this zone will dictate whether Bitcoin sees relief toward $117K or sinks deeper into stagflation-fueled downside. In this environment, success won’t come from guessing direction but from trading confirmation after liquidity sweeps and respecting risk parameters.
As Smart Money Concepts remind us, ranges like this are where big players prepare their next move - the key is waiting for them to show their hand.
It’s time to go from theory to execution - risk-free.
Create an Account. Start Your Free Demo!
Looking for step-by-step approaches you can plug straight into the charts? Start here:
Sharpen your edge with proven tools and frameworks:
News moves markets fast. Learn how to keep pace with SMC-based playbooks:
From NASDAQ opens to DAX trends, here’s how to approach indices like a pro:
Gold remains one of the most traded assets — here’s how to approach it with confidence:
Candlesticks are the building blocks of price action. Master the most powerful ones:
Ready to go intraday? Here’s how to build consistency step by step:
Markets swing between calm and chaos. Learn to read risk-on vs risk-off like a pro:
Step inside the playbook of institutional traders with SMC concepts explained:
Forex pairs aren’t created equal — some are stable, some are volatile, others tied to commodities or sessions.
If you’ve ever been stopped out right before the market reverses — this is why:
Mindset is the deciding factor between growth and blowups. Explore these essentials:
The real edge in trading isn’t strategy — it’s how you protect your capital:
If you’re not sure where to start, follow this roadmap:
This way, you’ll grow from foundation → application → mastery, instead of jumping around randomly.
Follow me for more daily market insights!
Jasper Osita - LinkedIn - FXStreet - YouTube
This content may have been written by a third party. ACY makes no representation or warranty and assumes no liability as to the accuracy or completeness of the information provided, nor any loss arising from any investment based on a recommendation, forecast or other information supplies by any third-party. This content is information only, and does not constitute financial, investment or other advice on which you can rely.
ACY Securities is one of Australia's fastest growing multi-asset online trading providers, offering ultra-low-cost trading, rock-solid execution, technologically superior account management and premium market analysis.
Select the categories and companies you wish to follow directly to your person rss feed.
Create Custom RSS FeedSign up and join over 5,000 professional members who receive personalized news alerts, curated professional connections, and more for free!
Retail futures trading leader NinjaTrader Group has appointed Mark Omens as Senior Vice President, Commercial Strategy, bringing a 25-year veteran of derivatives marketplace CME Group into a newly created role focused on exchange partnerships and enterprise growth.
Gold Price Action Forecast: Will XAU/USD Drop to $3930? Meta Description: Read our Gold price action forecast to see if XAU/USD will drop to $3930.
BitDelta Securities Financial Services LLC (“BitDelta Securities”) today announced that it has received full regulatory approval from the Capital Market Authority (“CMA”) of the United Arab Emirates under the Category 5 — Arrangement and Advice license framework (License No. 20200000439). The approval follows the firm's receipt of In-Principal Approval earlier this year and represents the successful conclusion of the CMA's full licensing process, including the satisfaction of capital requirements, governance appointments, and operational setup.
Crypto.com has received a $400 million strategic investment from Citadel Securities, valuing the firm at $20 billion. It marks the first institutional funding round in the company's history, aimed at accelerating its expansion into tokenised securities, derivatives and other asset classes.
WTI’s pullback into $79–82 is the first major test of the bullish Elliott Wave count, with buyers targeting a renewed break above $85.

BitDelta Securities has secured a full CMA Category 5 licence in the UAE and opened a regulated office in Business Bay, Dubai. The firm operates as an introducing broker, connecting investors with licensed international brokers across multiple asset classes, with CEO Dr. Demetrios Zamboglou commenting on the milestone.
Index volatility is asleep while single stocks fight it out underneath, credit refuses to confirm the equity rally, and a bare macro calendar hands next week to oil.
Digital assets and FX brokerage GC Exchange FZE (GCEX) has appointed Mohammed A. Mulla as a Board Member of its Dubai-based entity, part of the wider GCEX Group.
Learn what Blockchain-as-a-Service is, how it works, and why businesses are using BaaS to build blockchain applications without managing infrastructure.
CFDs vs stocks compared on leverage, ownership, costs, dividends, taxes, and risk. Learn the differences between stocks and CFDs and discover which suits your investing or trading goals.


