just now

Liquidity Finder Ltd is incorporated in England and Wales, company number 10610740, registered address 167-169 Great Portland Street, Fifth Floor, London W1W 5PF, United Kingdom.
Published: just now

After a strong two-month rebound, the S&P 500 has entered July hovering near all-time highs. But can this momentum continue, or are we topping into volatility?
Historically, the first two weeks of July are the most bullish stretch of the year. Seasonality wise as well, July is on average a bullish month for the SPX across the last 20 years. However, while seasonal trends look great, several catalysts could shake things up this time.
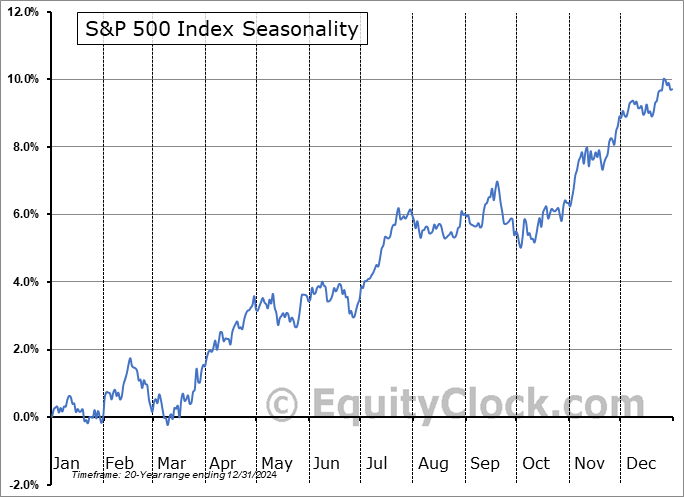
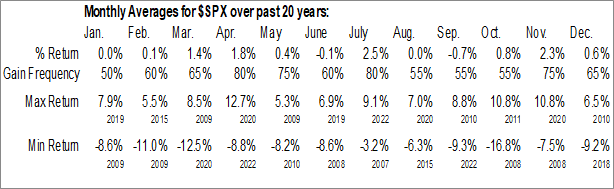
Source: EquityClock
The key fundamental risks to watch for this July are the following:
Watch for key results from the MAG-7 (Microsoft, Apple, Google, Amazon, Meta, Nvidia, Tesla).
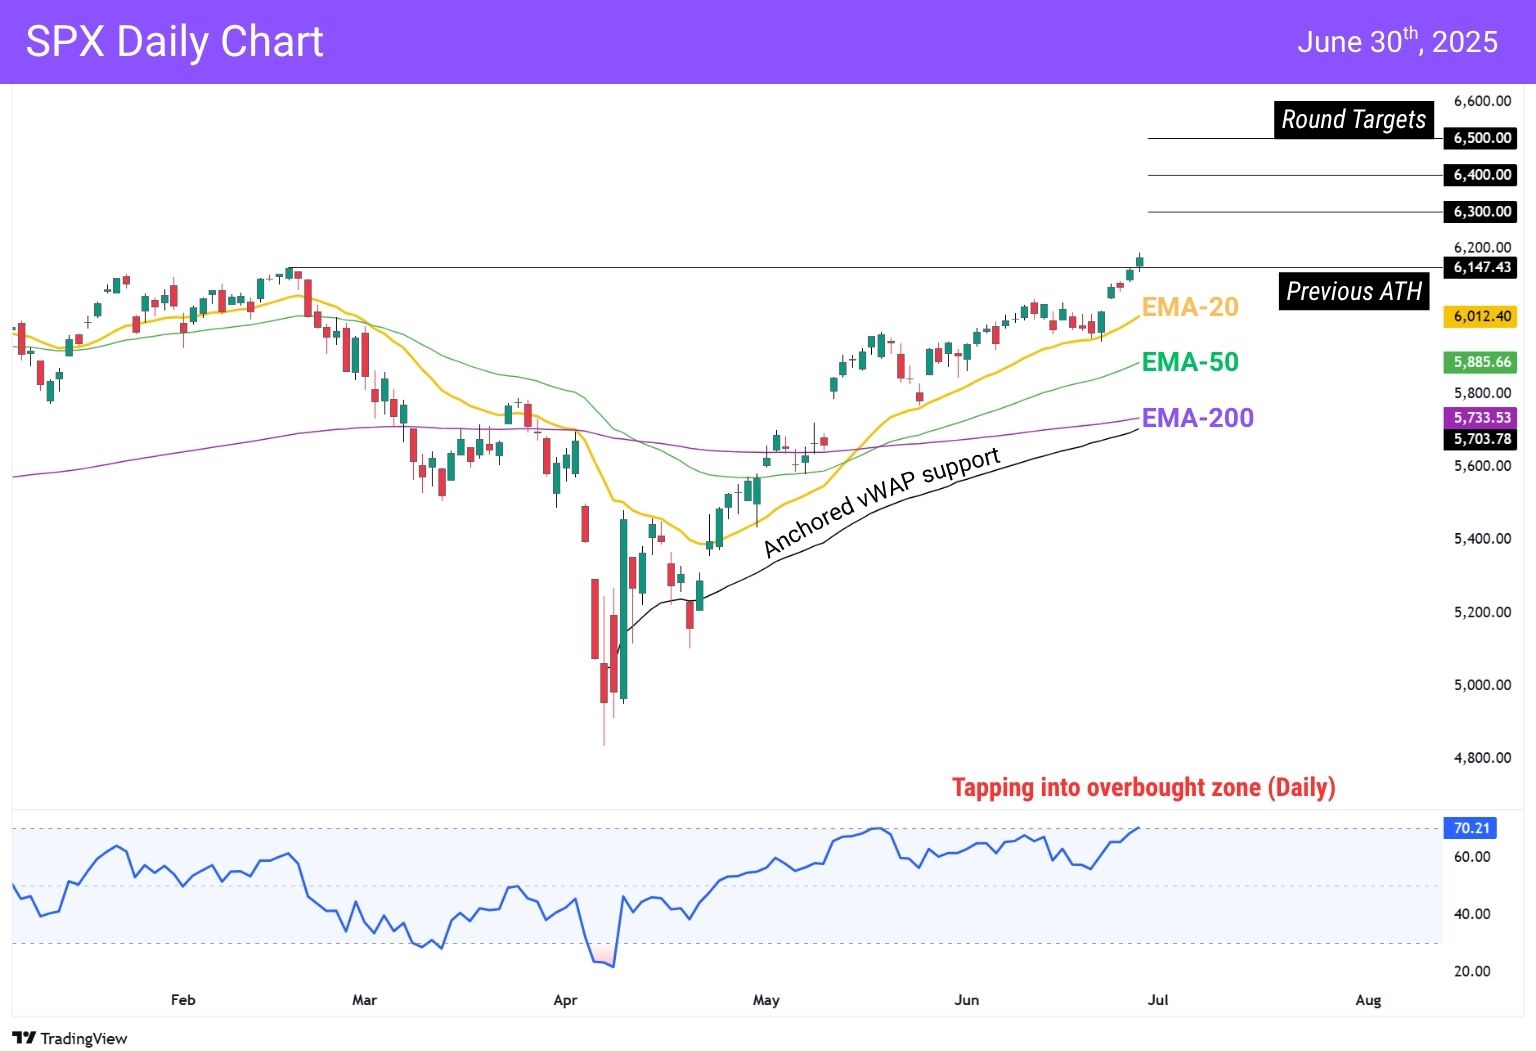
This structure favours continuation if sentiment holds — but we’re also nearing round-number resistance zones and overbought territory.
July is known for strong performance —but this time, macro risk, policy deadlines, and earnings volatility are looming. While we’re technically bullish, it remains a good idea to keep a close eye on fundamental developments.
Overall, the mini rally seems to be a go, even if we cool off a little here and retest the EMA-20 or even EMA-200 zones — as long as we can stay above those prices ($6,000 and $5,700 respectively).
You may also be interested in:
Q3 2025 Forecast: USD Looks For Relief From Oversold Conditions
DISCLAIMER: For educational purposes only. Trading comes with substantial risk, leading to possible loss of your capital. Traders are advised to do their own due diligence before investing.
Alchemy Markets is a multi-asset brokerage providing retail traders with the same elite trading conditions, tools, and transparency typically reserved for institutions.
Select the categories and companies you wish to follow directly to your person rss feed.
Create Custom RSS FeedSign up and join over 5,000 professional members who receive personalized news alerts, curated professional connections, and more for free!
Sterling steadies after political uncertainty rattled gilt markets, while EUR/USD and EUR/GBP approach key technical levels ahead of today's European session.
GBP/AUD remains trapped in a well-defined bearish trend on both the weekly and daily timeframes.
Discover the key drivers, technical levels, and central bank expectations shaping the EUR/USD trend as the ECB prepares to hold rates and markets watch for a potential breakout.
Sydney-based multi-asset broker ACY Securities has introduced PAXGUSD, a new CFD instrument that allows clients to trade tokenised gold against the US Dollar 24 hours a day, seven days a week. The instrument is available across MetaTrader 4, MetaTrader 5, and the ACY Trading Platform.
Binance has lowered its VIP 3 Wallet Assets threshold from $3 million to $1 million and will now count OTC Spot Trading Volume at a 4x multiplier toward VIP qualification, removing the previous VIP 4 cap and allowing eligible users to progress through the full tier framework up to VIP 9.
Retail futures trading leader NinjaTrader Group has appointed Mark Omens as Senior Vice President, Commercial Strategy, bringing a 25-year veteran of derivatives marketplace CME Group into a newly created role focused on exchange partnerships and enterprise growth.
Gold Price Action Forecast: Will XAU/USD Drop to $3930? Meta Description: Read our Gold price action forecast to see if XAU/USD will drop to $3930.
BitDelta Securities Financial Services LLC (“BitDelta Securities”) today announced that it has received full regulatory approval from the Capital Market Authority (“CMA”) of the United Arab Emirates under the Category 5 — Arrangement and Advice license framework (License No. 20200000439). The approval follows the firm's receipt of In-Principal Approval earlier this year and represents the successful conclusion of the CMA's full licensing process, including the satisfaction of capital requirements, governance appointments, and operational setup.
Crypto.com has received a $400 million strategic investment from Citadel Securities, valuing the firm at $20 billion. It marks the first institutional funding round in the company's history, aimed at accelerating its expansion into tokenised securities, derivatives and other asset classes.
WTI’s pullback into $79–82 is the first major test of the bullish Elliott Wave count, with buyers targeting a renewed break above $85.


