just now

Liquidity Finder Ltd is incorporated in England and Wales, company number 10610740, registered address 167-169 Great Portland Street, Fifth Floor, London W1W 5PF, United Kingdom.
Published: just now

After tapping into $4,750, Ethereum has potentially completed a 5-wave rally structure — making an ABC correction towards $4,000 or deeper to $3,100 a possibility.
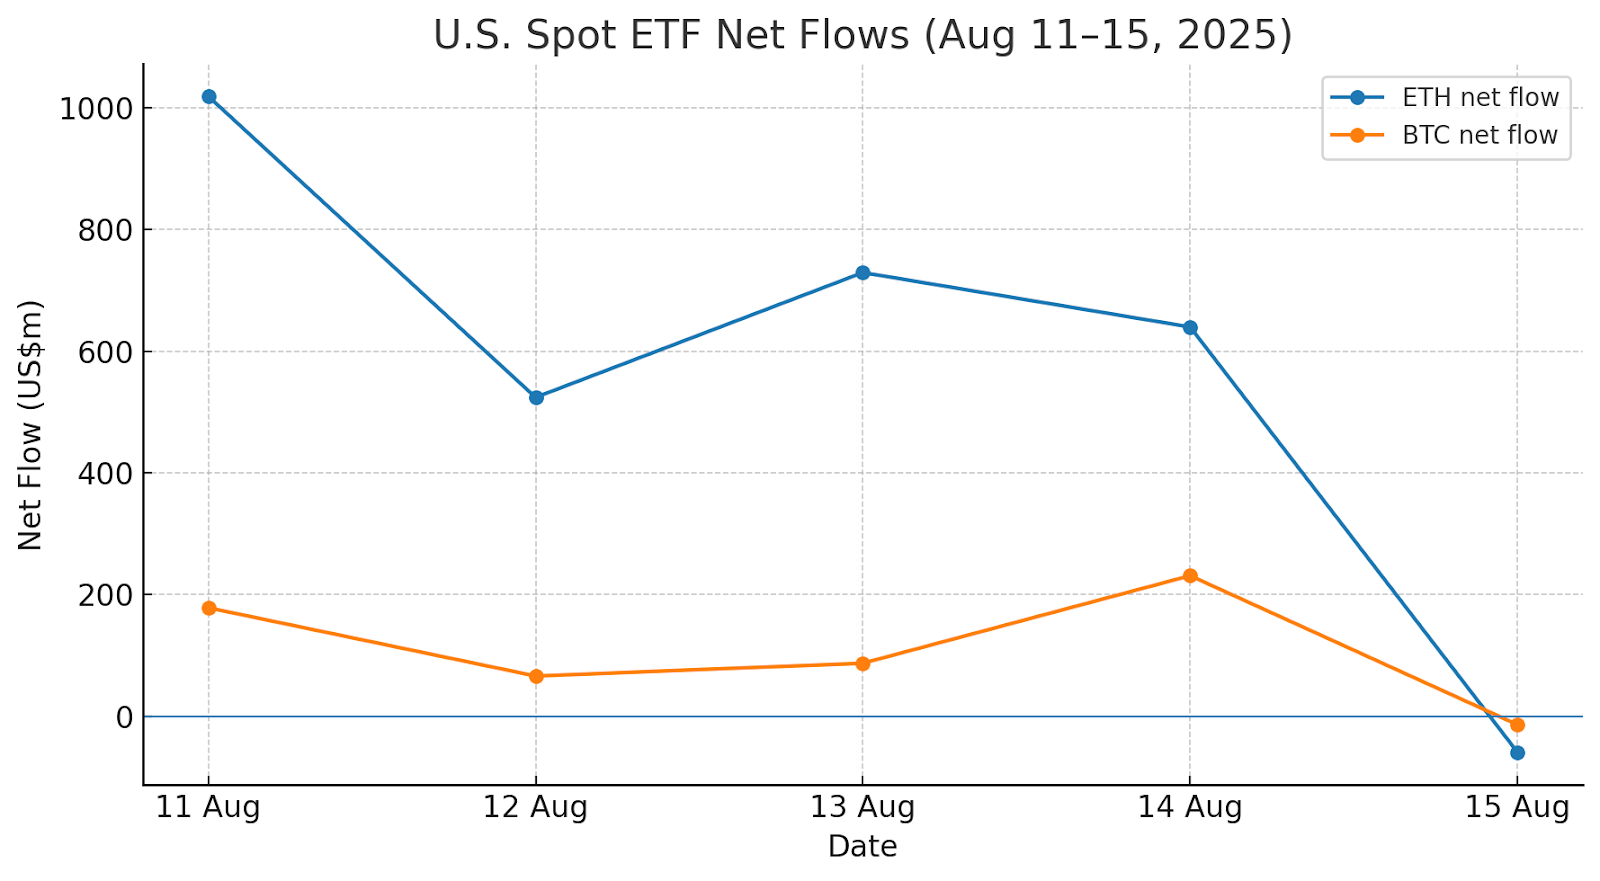
Perhaps the first warning sign we should have noticed was Ethereum’s Spot ETF net flows. Last week, it totalled at around $3.5 Billion USD and eclipsed Bitcoin’s net flows for 4 days in a row, indicating that institutions were accumulating. ETHA, Blackrock’s Ethereum Spot ETF, has been confirmed to have accumulated over 100,000 ETH (~433 million) alone in the past week.
The warning sign occurred on Friday, where Ethereum Spot ETFs experienced a sharp drop in net flows, reaching a net flow of -59.3 million USD and finally ending that accumulation strength over Bitcoin ETFs.
On the daily timeframe, we can spot a clear 5-wave structure on the Ethereum/USDT chart. What usually follows after is an ABC correction to the downside, before continuing in a bullish trend direction.
Let’s break down scenarios to consider for a retracement; if we don’t just continue higher now and invalidate the completed 5-wave idea.
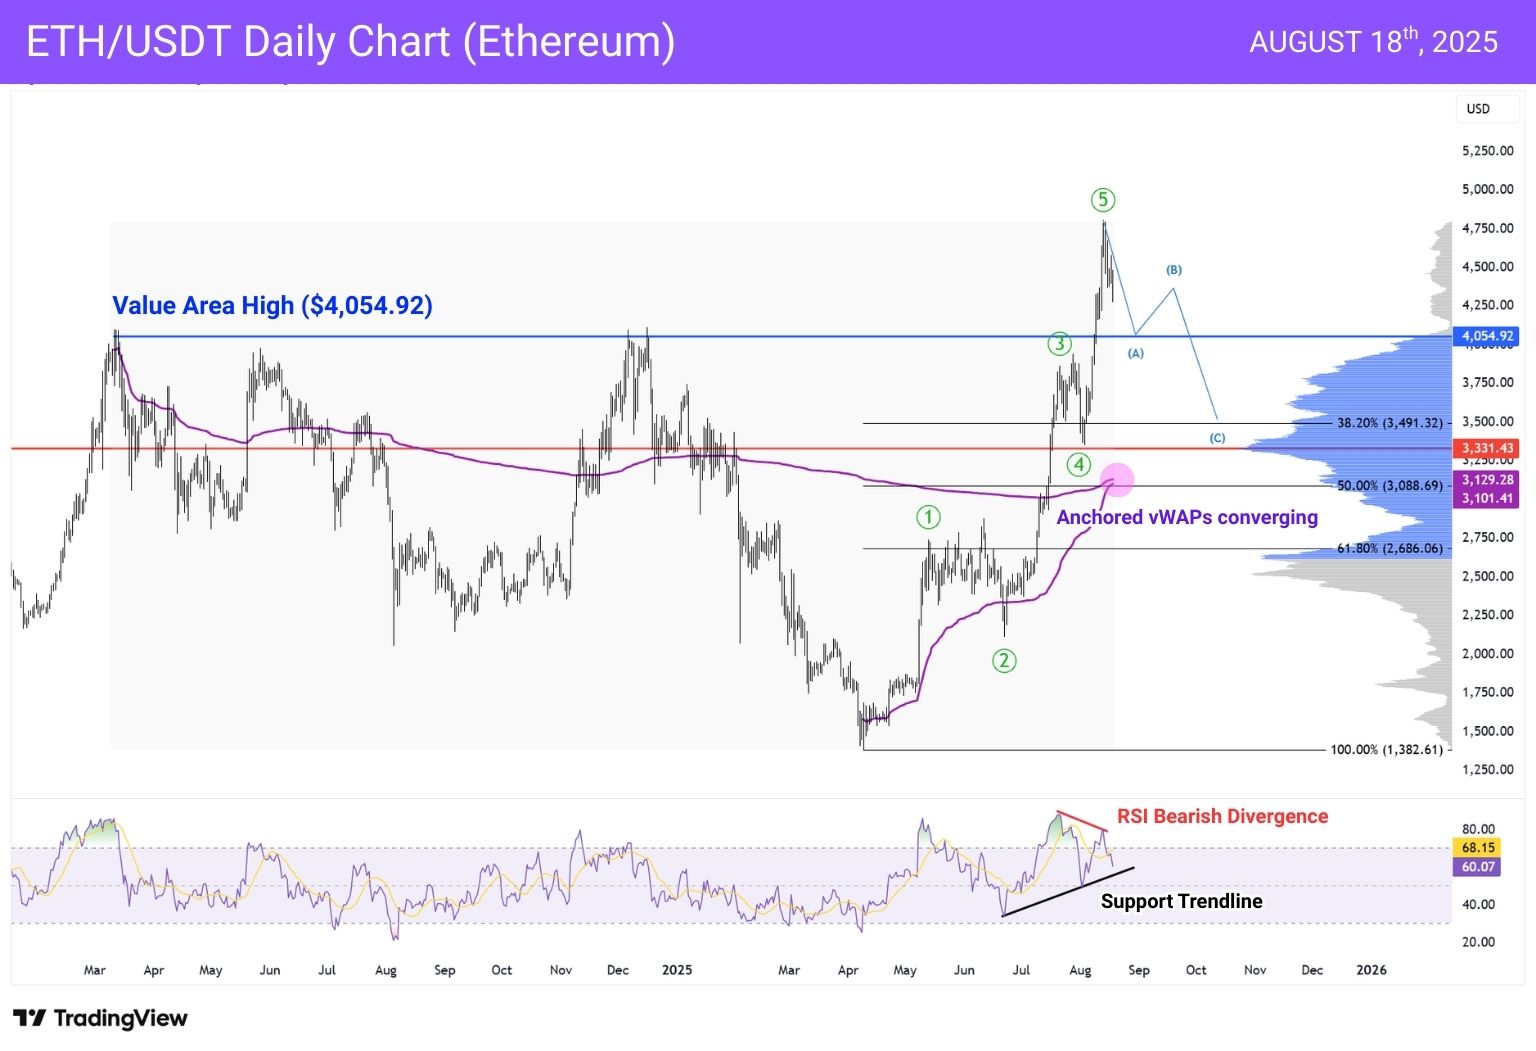
Scenario 1: Shallow Pullback to ~$3,500
Elliot Wave Theory dictates that ABC corrections following a 5-wave rally would at least tap into the 38.2% Fibonacci retracement of the entire structure. If it pivots from here, it signifies that ETH is in a strong uptrend.
Wave A — Reach $4,000, which aligns with previous highs and the Value Area High since March 2024
Wave B — Retrace back to $4,400 to $4,500 (Fib levels)
Wave C — Continue to 38.2% Fib Retracement at $3,491.32
Scenario 2: Deeper Correction to ~$3,100
The usual suspects for a stop and reverse in a 5-wave rally are the 50% and 61.8% Fib retracements. This would align strongly with an anchored vWAP cluster at around $3,100.
Wave A and B — Same as above
Wave C — Continue to 50% Fib Retracement at $3,088.69
Alternative Bullish Case: Stop and Accumulate at ~$4,000
This would imply a running flat correction where ETH never breaks significantly lower. It’s rare, but strong institutional accumulation (Blackrock, inflows) makes it a scenario worth watching.
$4,000 is also a significant level as it acted as the top for ETH/USDT for the entirety for 2024.
For now, the 38.2% retracement near $3,500 remains the base case. But if $4,000 holds, it signals institutions are stepping in aggressively, shortening the correction phase.
You may also be interested in:
Shocking Fed Shift? 5 Jackson Hole Questions That Could Move Markets – SPX Outlook Inside
DISCLAIMER: For educational purposes only. Trading comes with substantial risk, leading to possible loss of your capital. Traders are advised to do their own due diligence before investing.
Alchemy Markets is a multi-asset brokerage providing retail traders with the same elite trading conditions, tools, and transparency typically reserved for institutions.
Select the categories and companies you wish to follow directly to your person rss feed.
Create Custom RSS FeedSign up and join over 5,000 professional members who receive personalized news alerts, curated professional connections, and more for free!
Retail futures trading leader NinjaTrader Group has appointed Mark Omens as Senior Vice President, Commercial Strategy, bringing a 25-year veteran of derivatives marketplace CME Group into a newly created role focused on exchange partnerships and enterprise growth.
Gold Price Action Forecast: Will XAU/USD Drop to $3930? Meta Description: Read our Gold price action forecast to see if XAU/USD will drop to $3930.
BitDelta Securities Financial Services LLC (“BitDelta Securities”) today announced that it has received full regulatory approval from the Capital Market Authority (“CMA”) of the United Arab Emirates under the Category 5 — Arrangement and Advice license framework (License No. 20200000439). The approval follows the firm's receipt of In-Principal Approval earlier this year and represents the successful conclusion of the CMA's full licensing process, including the satisfaction of capital requirements, governance appointments, and operational setup.
Crypto.com has received a $400 million strategic investment from Citadel Securities, valuing the firm at $20 billion. It marks the first institutional funding round in the company's history, aimed at accelerating its expansion into tokenised securities, derivatives and other asset classes.
WTI’s pullback into $79–82 is the first major test of the bullish Elliott Wave count, with buyers targeting a renewed break above $85.

BitDelta Securities has secured a full CMA Category 5 licence in the UAE and opened a regulated office in Business Bay, Dubai. The firm operates as an introducing broker, connecting investors with licensed international brokers across multiple asset classes, with CEO Dr. Demetrios Zamboglou commenting on the milestone.
Index volatility is asleep while single stocks fight it out underneath, credit refuses to confirm the equity rally, and a bare macro calendar hands next week to oil.
Digital assets and FX brokerage GC Exchange FZE (GCEX) has appointed Mohammed A. Mulla as a Board Member of its Dubai-based entity, part of the wider GCEX Group.
Learn what Blockchain-as-a-Service is, how it works, and why businesses are using BaaS to build blockchain applications without managing infrastructure.
CFDs vs stocks compared on leverage, ownership, costs, dividends, taxes, and risk. Learn the differences between stocks and CFDs and discover which suits your investing or trading goals.


