just now

Liquidity Finder Ltd is incorporated in England and Wales, company number 10610740, registered address 167-169 Great Portland Street, Fifth Floor, London W1W 5PF, United Kingdom.
Published: just now

With Q1 behind us, let’s look ahead and see what the price patterns suggest regarding key forex trends in Q2 2025. We use Elliott Wave Theory as a basis for these forecasts. We’ll analyse the current patterns, see where the current price is within those patterns, and discuss anticipated trends for the Q2 2025.
As of December 2024, the market was anticipating 50 basis point rate cuts from the Fed in 2025. Now, with the first quarter under our belt and no rate cuts (yet), the anticipation of rate cuts is beginning to grow. speed up. There is now an expectation of 75 basis point rate cuts in 2025 with the first cut anticipated for June 18.
Much of the rate cutting is a result of softening inflation. If this trend continues, then the trend for US dollar weakness likely continues for a large portion of Q2.
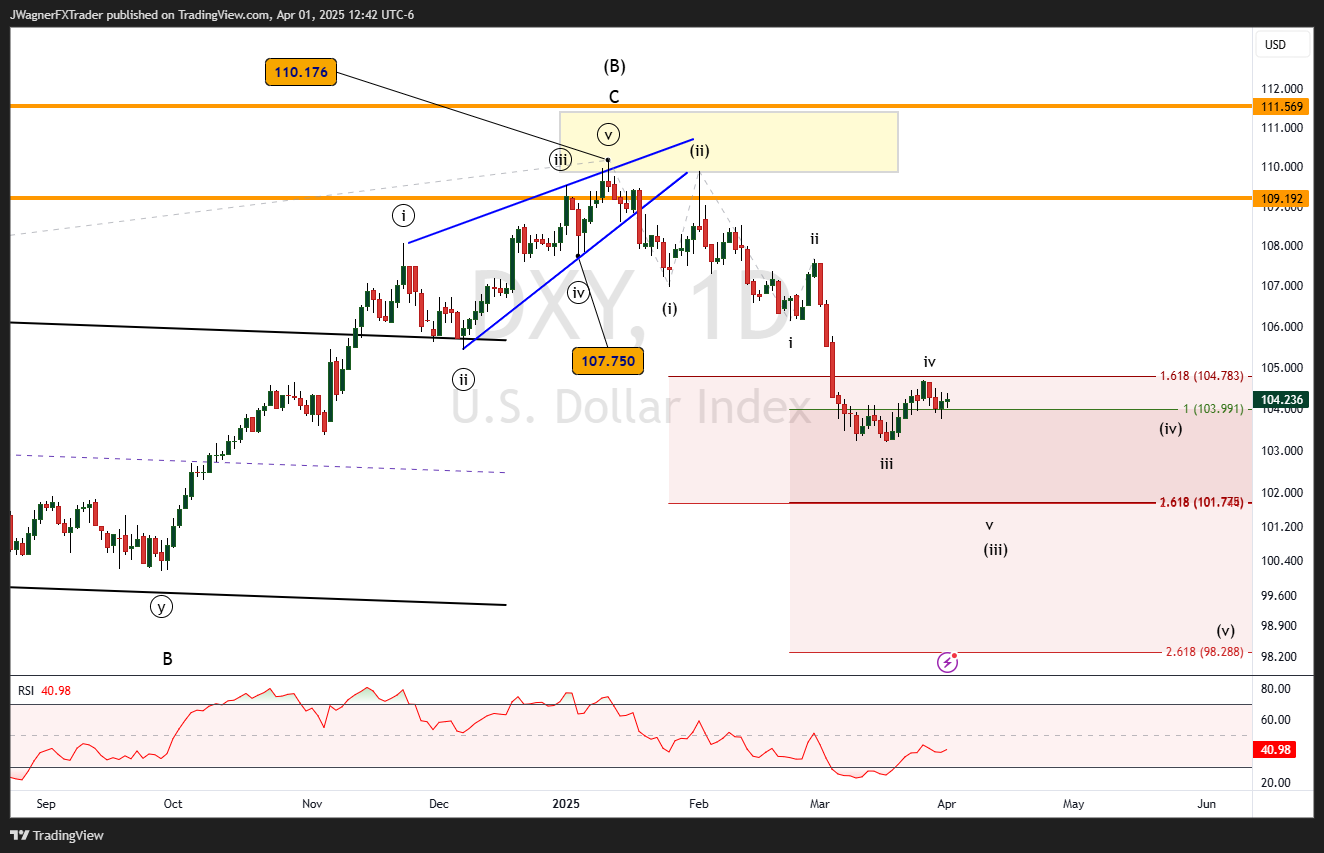
Our Q1 forecast for DXY was spot on. At the time, the dollar was in a strong trend and we anticipated upside targets between 110-111 with a larger bearish reversal at hand.
We now know that DXY topped on January 13, 2025 at 110.18. Since then, DXY has pushed down to 104 at the time of this writing.
This downtrend does not appear over when assessing through the lens of Elliott wave. It appears DXY is in wave iv of (iii). This implies an unfolding bearish impulse that still has a couple of more waves lower to go.
I suspect DXY finalizes wave (iii) near 101.50 in the early parts of Q2. Then, wave (iv) likely proves to be a temporary rally that carries back near 104. Once wave (iv) is in place, then (v) would be a bearish wave to new lows below 100.
It is possible, the wave (v) trend lower could appear towards the end of Q2. The main price action to follow in Q2 is another trend lower to finalize (iii) to near 101.50, then a wave (iv) relief rally to 104.
Bottom line, we are anticipating wave (iii) to trend down to around 101.50, then a temporary rally in wave (iv) to 104. This likely takes up most of Q2. If wave (v) does begin, it would trend lower from around 104 to new lows below 100.
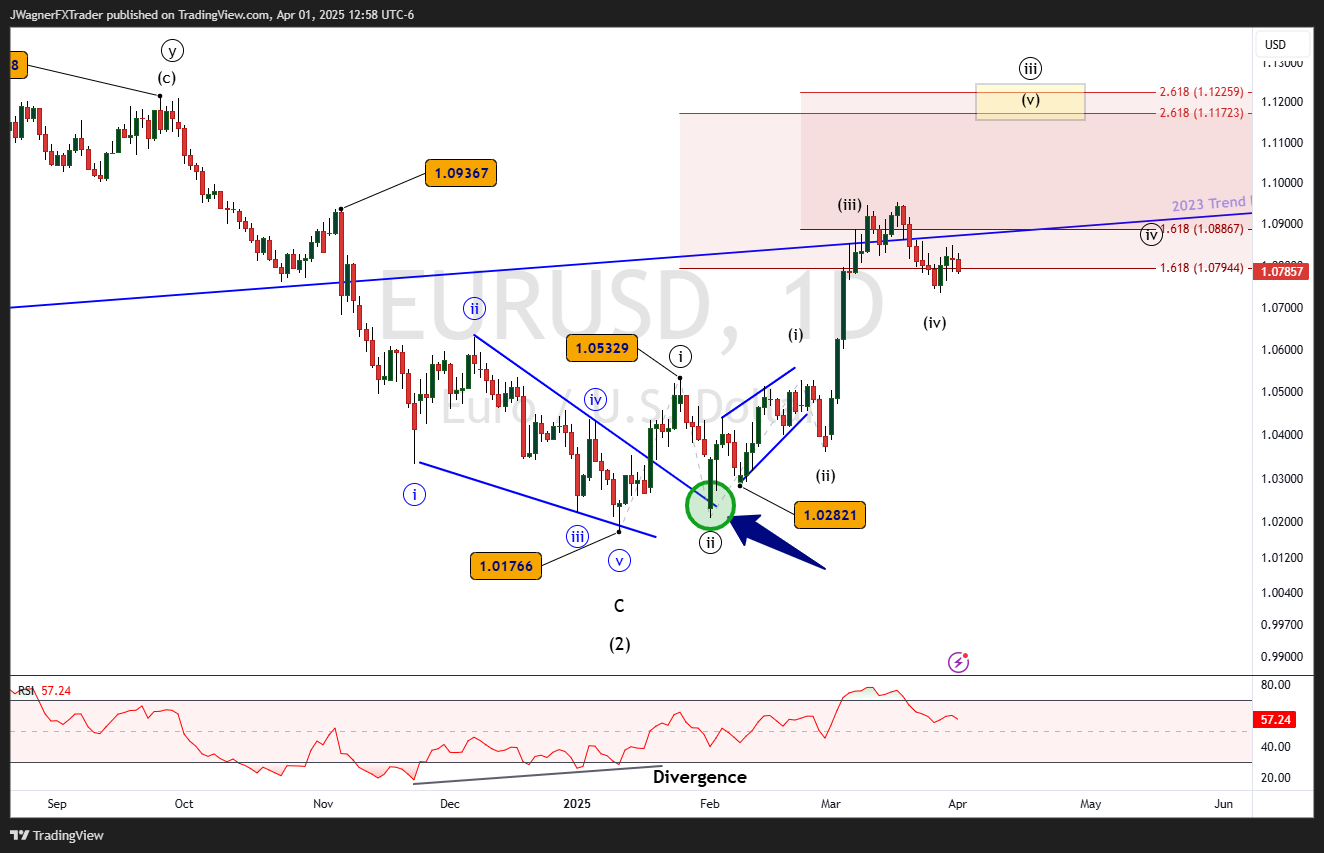
As anticipated in our Q1 report, EURUSD did put in a major low at 1.0177 on January 13, just below our targeted range. EURUSD does appear to be in a cyclical uptrend that likely carries to 1.18 and potentially higher levels in the coming quarters.
The current Elliott wave pattern depicts EURUSD at wave (iv) of ((iii)). Once this wave ends, then wave (v) of ((iii)) rallies to the upside and likely carries to 1.12.
There are several wave relationships popping up near 1.12. Therefore, I suspect EURUSD punches a wave ((iii)) high around 1.12 and begins a wave ((iv)) correction to carry it down to near 1.08.
If all of this happens prior to the end of Q2, then the remainder of Q2 would imply a wave ((v)) beginning to levels above 1.12.
Bottom line, EURUSD appears poised to rally in wave (v) of ((iii)) to 1.12 in the beginning part of Q2. Then, the latter part of Q2 may be spent in a wave ((iv)) decline down to 1.08.
View our other Q2 forecasts at:
Q2 Equities
Alchemy Markets is a multi-asset brokerage providing retail traders with the same elite trading conditions, tools, and transparency typically reserved for institutions.
Select the categories and companies you wish to follow directly to your person rss feed.
Create Custom RSS FeedSign up and join over 5,000 professional members who receive personalized news alerts, curated professional connections, and more for free!
Retail futures trading leader NinjaTrader Group has appointed Mark Omens as Senior Vice President, Commercial Strategy, bringing a 25-year veteran of derivatives marketplace CME Group into a newly created role focused on exchange partnerships and enterprise growth.
Gold Price Action Forecast: Will XAU/USD Drop to $3930? Meta Description: Read our Gold price action forecast to see if XAU/USD will drop to $3930.
BitDelta Securities Financial Services LLC (“BitDelta Securities”) today announced that it has received full regulatory approval from the Capital Market Authority (“CMA”) of the United Arab Emirates under the Category 5 — Arrangement and Advice license framework (License No. 20200000439). The approval follows the firm's receipt of In-Principal Approval earlier this year and represents the successful conclusion of the CMA's full licensing process, including the satisfaction of capital requirements, governance appointments, and operational setup.
Crypto.com has received a $400 million strategic investment from Citadel Securities, valuing the firm at $20 billion. It marks the first institutional funding round in the company's history, aimed at accelerating its expansion into tokenised securities, derivatives and other asset classes.
WTI’s pullback into $79–82 is the first major test of the bullish Elliott Wave count, with buyers targeting a renewed break above $85.

BitDelta Securities has secured a full CMA Category 5 licence in the UAE and opened a regulated office in Business Bay, Dubai. The firm operates as an introducing broker, connecting investors with licensed international brokers across multiple asset classes, with CEO Dr. Demetrios Zamboglou commenting on the milestone.
Index volatility is asleep while single stocks fight it out underneath, credit refuses to confirm the equity rally, and a bare macro calendar hands next week to oil.
Digital assets and FX brokerage GC Exchange FZE (GCEX) has appointed Mohammed A. Mulla as a Board Member of its Dubai-based entity, part of the wider GCEX Group.
Learn what Blockchain-as-a-Service is, how it works, and why businesses are using BaaS to build blockchain applications without managing infrastructure.
CFDs vs stocks compared on leverage, ownership, costs, dividends, taxes, and risk. Learn the differences between stocks and CFDs and discover which suits your investing or trading goals.