just now

Liquidity Finder Ltd is incorporated in England and Wales, company number 10610740, registered address 167-169 Great Portland Street, Fifth Floor, London W1W 5PF, United Kingdom.
Published: just now

Black Monday refers to a capitulation move that occurs on a Monday, severely bringing down stock and gold prices, with Gold being the overall winner as the safe haven (but sometimes also taking a hit).
Infamously coined in October 1987, the original “Black Monday” resulted in a -22.6% decline on the DJIA in a single day, and now the same fears are sweeping across the markets for an overwhelming bearish move.
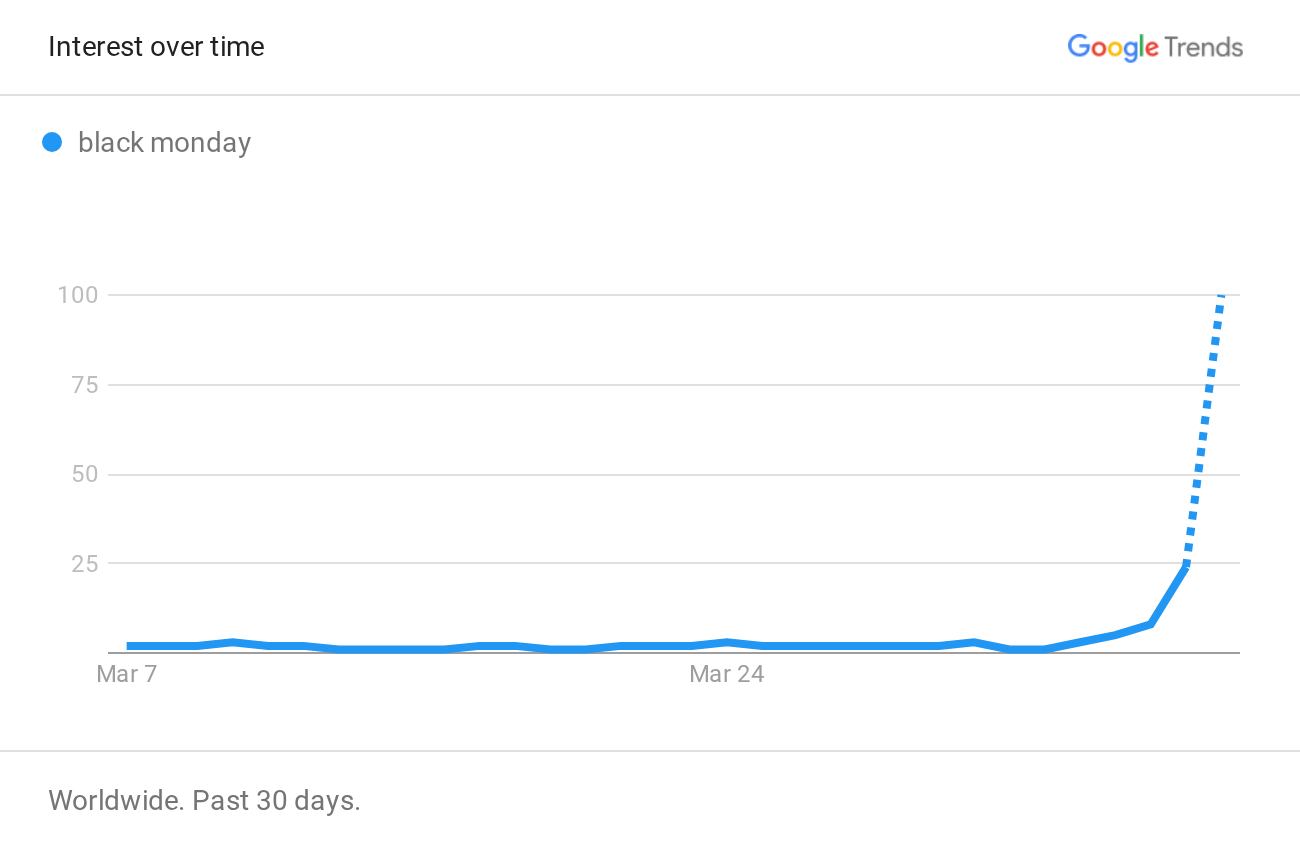
Source: Google Trends
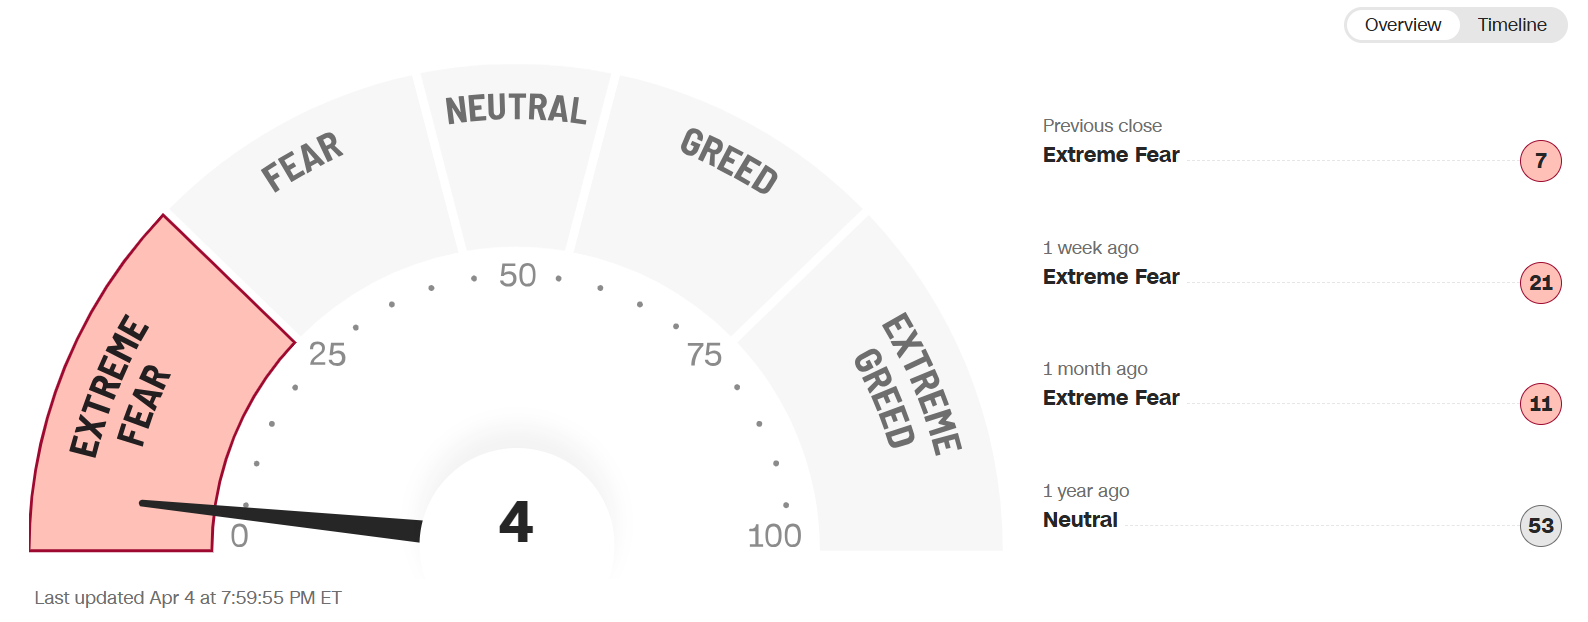
Source: CNN
Searches for the term: “Black Monday” have exploded across the weekend and today, as indicated by Google’s Trends tool. Paired with this sentiment indication is the Fear & Greed index, which has now plummeted to extreme fear readings at 4.
Part of this is due to the aggressive gap down on the S&P 500 last Friday, where the index opened lower by -1.83%, and then moved closed even lower by -4.20%.
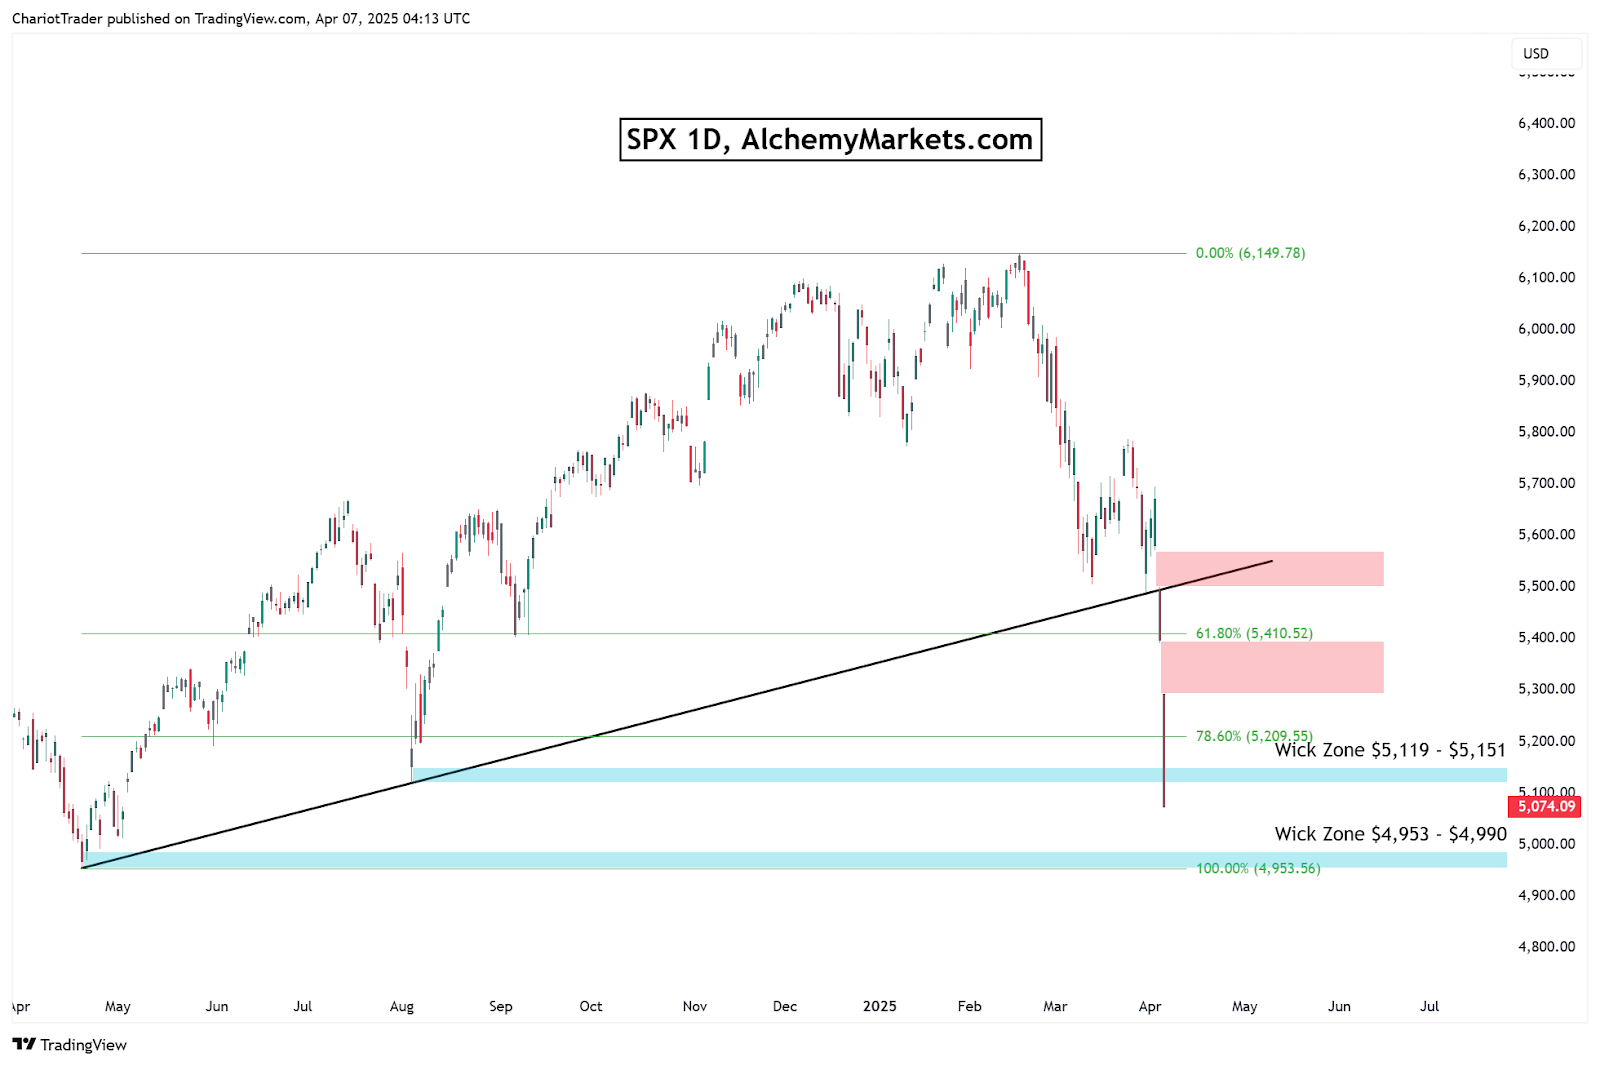
The SPX is currently in a precarious position, with the price closing a weekly candle beneath its weekly trendline, as mentioned in the previous analysis, and even chopping through critical Fibonacci support such as the 61.8% and 78.6%.
Additionally, the wick zone at $5,119–$5,151 expected to provide some relief for the SPX has been cleanly chopped through, leaving only the support at $4,953–$4,990 to champion the asset.
Technically, it’s possible the SPX is experiencing ABC correction, and the worst is over if we can begin to form a higher low, then a higher high above the previous high. These numbers have not yet formed in the chart, but the general concept should be kept in mind as we continue to print new daily and weekly candles.
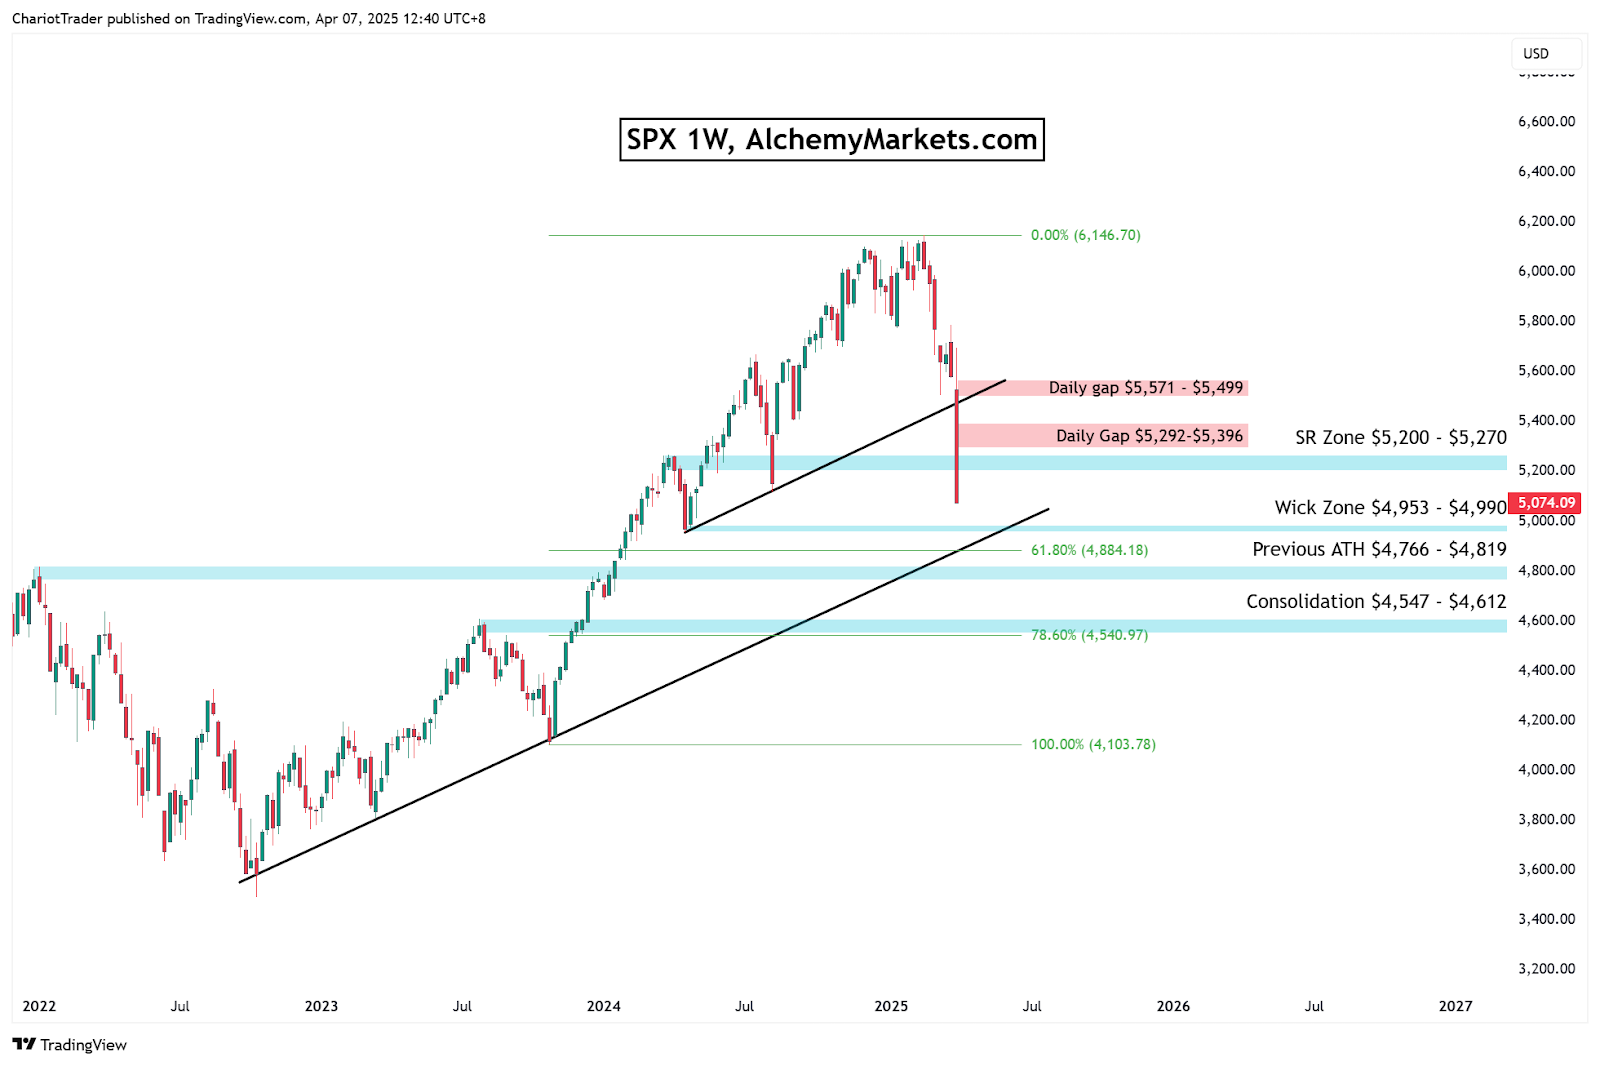
Where S&P 500 could bounce
Notice that the S&P 500 has a weekly trendline dating back to late 2022, which is coming into contact with the 61.8% Fib and Previous ATH.
However, due to time constraints, the wick zone is unlikely to align with the trendline if price continues to descend in coming days, so proceed with caution if you plan to open a long position there.
SPX needs to overcome the daily gaps between $5,292–$5,396, then subsequently the $5,499 – $5,571 region to confirm a bullish outlook. These gaps are technical resistances that will clearly inform us of the markets’ intentions, as highlighted in our previous analysis with historical data.
You may also be interested in:
Navigating Tariffs, Inflation, and Interest Rate Decisions
*Trading leveraged products carries a high level of risk and may result in losses exceeding your initial investment; ensure you fully understand the risks involved.
Alchemy Markets is a multi-asset brokerage providing retail traders with the same elite trading conditions, tools, and transparency typically reserved for institutions.
Select the categories and companies you wish to follow directly to your person rss feed.
Create Custom RSS Feed
just now
Sign up and join over 5,000 professional members who receive personalized news alerts, curated professional connections, and more for free!
Retail futures trading leader NinjaTrader Group has appointed Mark Omens as Senior Vice President, Commercial Strategy, bringing a 25-year veteran of derivatives marketplace CME Group into a newly created role focused on exchange partnerships and enterprise growth.
Gold Price Action Forecast: Will XAU/USD Drop to $3930? Meta Description: Read our Gold price action forecast to see if XAU/USD will drop to $3930.
BitDelta Securities Financial Services LLC (“BitDelta Securities”) today announced that it has received full regulatory approval from the Capital Market Authority (“CMA”) of the United Arab Emirates under the Category 5 — Arrangement and Advice license framework (License No. 20200000439). The approval follows the firm's receipt of In-Principal Approval earlier this year and represents the successful conclusion of the CMA's full licensing process, including the satisfaction of capital requirements, governance appointments, and operational setup.
Crypto.com has received a $400 million strategic investment from Citadel Securities, valuing the firm at $20 billion. It marks the first institutional funding round in the company's history, aimed at accelerating its expansion into tokenised securities, derivatives and other asset classes.
WTI’s pullback into $79–82 is the first major test of the bullish Elliott Wave count, with buyers targeting a renewed break above $85.

BitDelta Securities has secured a full CMA Category 5 licence in the UAE and opened a regulated office in Business Bay, Dubai. The firm operates as an introducing broker, connecting investors with licensed international brokers across multiple asset classes, with CEO Dr. Demetrios Zamboglou commenting on the milestone.
Index volatility is asleep while single stocks fight it out underneath, credit refuses to confirm the equity rally, and a bare macro calendar hands next week to oil.
Digital assets and FX brokerage GC Exchange FZE (GCEX) has appointed Mohammed A. Mulla as a Board Member of its Dubai-based entity, part of the wider GCEX Group.
Learn what Blockchain-as-a-Service is, how it works, and why businesses are using BaaS to build blockchain applications without managing infrastructure.
CFDs vs stocks compared on leverage, ownership, costs, dividends, taxes, and risk. Learn the differences between stocks and CFDs and discover which suits your investing or trading goals.


