just now
Liquidity Finder Ltd is incorporated in England and Wales, company number 10610740, registered address 167-169 Great Portland Street, Fifth Floor, London W1W 5PF, United Kingdom.
Published: just now
To help you understand why Fibonacci levels often create reactions in the market, not because of magic numbers or hidden math, but because of trader psychology, order clustering, and most importantly, confluences that align with those levels.
By the end of this lesson, you’ll see Fibonacci as a tool to organize your thinking and stack trade ideas—not as a standalone signal.

Picture a player taking a three-point shot. The hoop never moves—but whether the shot goes in depends on many factors:
A Fibonacci level is like the hoop. It’s a fixed reference point. But the shot—your trade—only succeeds when multiple conditions line up.
It’s not just the timing, but the combination of events that creates the biggest emotional shift.
In trading, Fibonacci works the same way:
Not because the 0.618 is magical, but because other elements align at that level—support/resistance, liquidity grabs, fair value gaps, structure shifts, making the level an opportunity with the highest probability.
That’s what gives it power.

Fibonacci levels reflect crowd behavior and order placement. But they only trigger meaningful reactions when other trade ideas support them.
Without confluence, they’re just floating numbers.
| Fibonacci Level | What It Reflects Psychologically | When It Works Best |
|---|---|---|
| 0.236 | Overconfidence or minor correction | In ultra-strong trends with shallow pullbacks |
| 0.382 | Early believers jumping in | When trend is strong and there's nearby structure or a gap |
| 0.500 | Cautious re-entry; psychological midpoint | Works best with double-bottom/top structure or round-number support |
| 0.618 | Golden ratio = golden trap | When aligned with FVG, OB, sweep, or BOS |
| 0.705 | Hidden sniper entry | Ideal for smart money entries after retail panic |
| 0.786 | Deep pain zone—retail stops triggered | Works when price sweeps structure and reclaims it (fakeout + confirmation) |
Fibonacci is not a magic level. Price doesn’t respect 0.618 because the number is sacred.
It respects it when other forces align at the same point.
Fibonacci levels don’t work because of sacred geometry or hidden market codes. They work because they align with other technical and psychological factors that influence how traders behave.
The Real Magic = Confluence
The more reasons price has to reverse at a level, the higher the probability it actually does.
Fibonacci is a framework. But the real edge comes from confluence.
The real power of Fibonacci lies in confluence—when multiple trade ideas and technical elements overlap at or near a Fib level. That’s when a price zone becomes a decision zone.
Confluence means multiple trade ideas, tools, or market behaviors aligning around the same zone. It means stacking multiple technical or contextual reasons to support a potential trade at a Fibonacci level. When more reasons stack around a Fibonacci level, the chances of price reacting there increase significantly.
Fibonacci gives you the area to watch—but it’s the confluence that gives you the reason to act.
Fibonacci becomes a confirmation framework, not a prediction model.
Use this as your personal checklist when price enters a Fibonacci zone. The more of these align, the stronger the setup:
Why it matters: Structure shows where traders are already anchored. When structure and Fibonacci meet, reactions are more reliable.
Why it matters: Imbalances show where price wants to rebalance. If Fib and FVG align, you have both a price and value reason to enter.
Why it matters: Fib levels provide the zone; price action provides the confirmation.
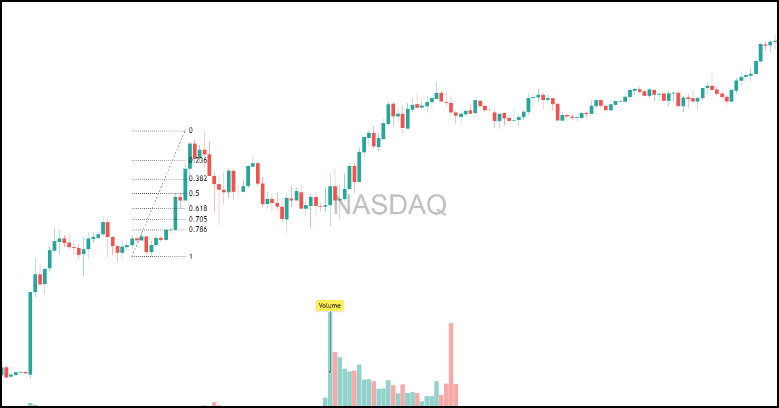
Why it matters: Smart money positions are often loaded during low volatility and executed at key zones with high volume.
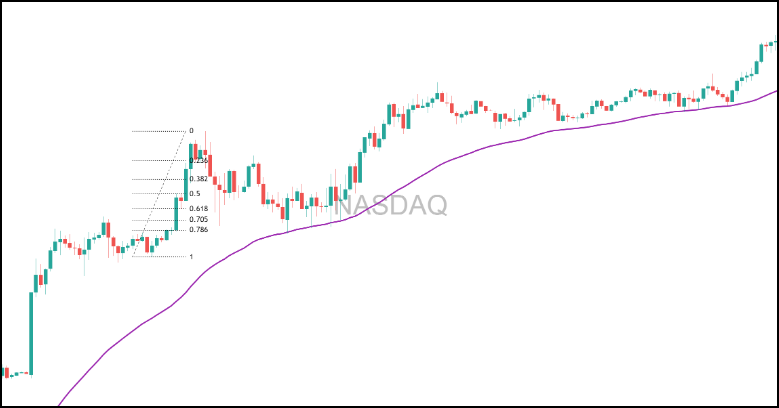
Why it matters: Many traders and institutions use moving averages. If a Fib level and MA intersect, it adds both trend and timing confidence to the trade.
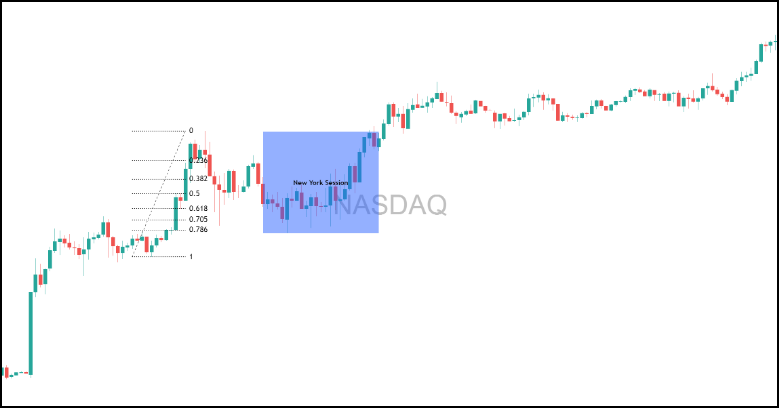
Why it matters: Institutional order flow is time-sensitive. Timing + location = trade opportunity.
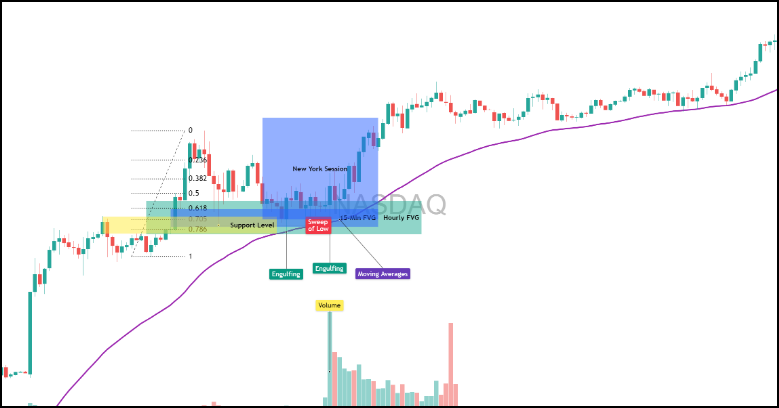
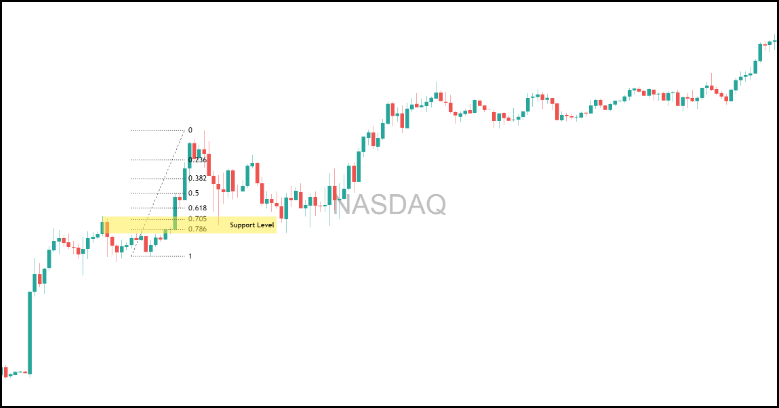
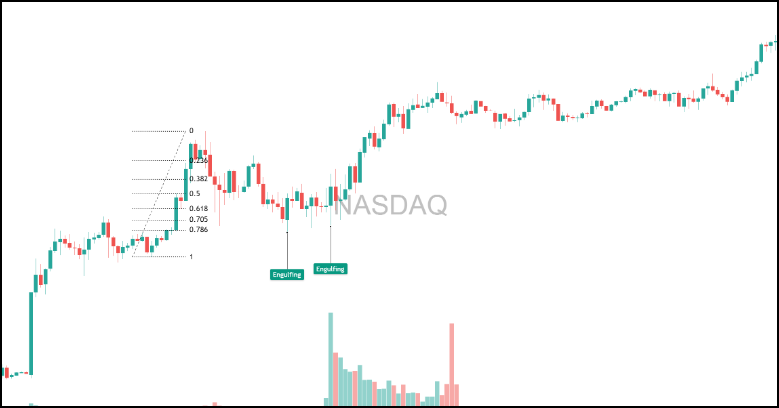
Let’s say price is pulling back to the 0.618 retracement on the NASDAQ.
On its own, that’s neutral.
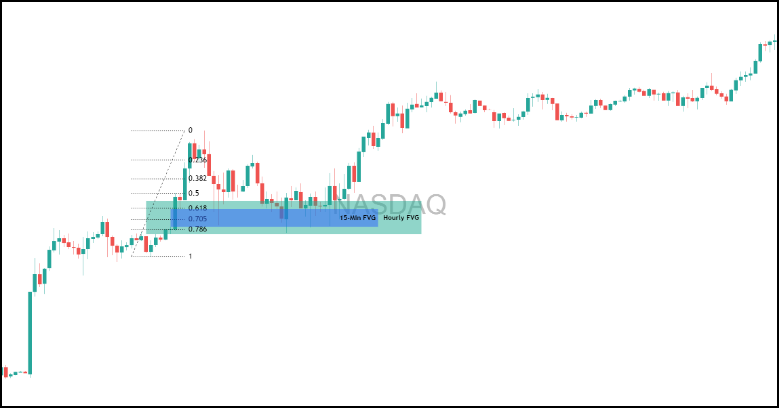
Now layer in:
That’s not just a Fib bounce - that’s a trade supported by story, structure, timing, and behavior.

How To Trade & Scalp Indices at the Open Using Smart Money Concepts (SMC)
How to Trade Breakouts Effectively in Day Trading with Smart Money Concepts
Complete Step-by-Step Guide to Day Trading Gold (XAU/USD) with Smart Money Concepts (SMC)
The Power of Multi-Timeframe Analysis in Smart Money Concepts (SMC)
Forex Trading Strategy for Beginners
Mastering Candlestick Pattern Analysis with the SMC Strategy for Day Trading
Mastering Risk Management: Stop Loss, Take Profit, and Position Sizing
RSI Divergence Trading Strategy for Gold: How to Identify and Trade Trend Reversals
Stochastics Trading Secrets: How to Time Entries in Trending Markets using Stochastics
Gold Trading Stochastics Strategy: How to Trade Gold with 2R–3R Targets
RSI Hidden Divergence Explained: How to Spot Trend Continuations Like a Pro
Why Smart Money Concepts Work in News-Driven Markets - CPI, NFP, and More
How to Trade NFP Using Smart Money Concepts (SMC)-A Proven Strategy for Forex Traders
How to Trade CPI Like Smart Money - A Step-by-Step Guide Using SMC
How to Start Trading Indices and Get into the Stock Market with Low Capital (2025 Guide)
Best Indices to Trade for Day Traders | NASDAQ, S&P 500, DAX + Best Times to Trade Them
How To Trade & Scalp Indices at the Open Using Smart Money Concepts (SMC)
NAS100 - How to Trade the Nasdaq Like a Pro (Smart Money Edition)
How to Trade CPI Like Smart Money - A Step-by-Step Guide Using SMC
Why Smart Money Concepts Work in News-Driven Markets - CPI, NFP, and More
How to Swing Trade Gold (XAU/USD) Using Smart Money Concepts: A Simple Guide for Traders
Complete Step-by-Step Guide to Day Trading Gold (XAU/USD) with Smart Money Concepts (SMC)
The Ultimate Guide to Backtesting and Trading Gold (XAU/USD) Using Smart Money Concepts (SMC)
Why Gold Remains the Ultimate Security in a Shifting World
How to Trade Candlestick Patterns with High Probability: A Complete Guide for Beginners
The Top Japanese Candlestick Guide: What is an Engulfing Pattern and How to Trade It?
Piercing Pattern Candlestick Explained: How to Trade It - Step-By-Step Guide
Morning & Evening Star Candlestick Patterns – How to Trade Market Reversals with Confidence
5 Steps to Start Day Trading: A Strategic Guide for Beginners
8 Steps How to Start Forex Day Trading in 2025: A Beginner’s Step-by-Step Guide
3 Steps to Build a Trading Routine for Consistency and Discipline - Day Trading Edition
The Ultimate Guide to Understanding Market Trends and Price Action
How to Identify Risk-On and Risk-Off Market Sentiment: A Complete Trader’s Guide
How to Trade Risk-On and Risk-Off Sentiment - With Technical Confirmation
The Ultimate Guide to Understanding Market Trends and Price Action
Why Smart Money Concepts Work: The Truth Behind Liquidity and Price Action
Mastering the Market with Smart Money Concepts: 5 Strategic Approaches
Mastering Candlestick Pattern Analysis with the SMC Strategy for Day Trading
Understanding Liquidity Sweep: How Smart Money Trades Liquidity Zones in Forex, Gold, US Indices
The SMC Playbook Series Part 4: How to Confirm Trend Reversal & Direction using SMC
The SMC Playbook Series Part 5: The Power of Multi-Timeframe Analysis in Smart Money Concepts (SMC)
Fair Value Gaps Explained: How Smart Money Leaves Footprints in the Market
The Best Time to Use Smart Money Concepts (SMC): Why Timing Is Everything in Trading SMC
How to Trade the London Session Using Smart Money Concepts (SMC)
The Mental Game of Execution - Debunking the Common Trading Psychology
5 Steps to Backtest a Trading Strategy with AI: A Step-by-Step Guide
Managing Trading Losses: Why You Can Be Wrong and Still Win Big in Trading
The Hidden Threat in Trading: How Performance Anxiety Sabotages Your Edge
Why You Fail in Trading: You Don’t Have Enough Capital to Survive
Why 90% of Retail Traders Fail Even with Profitable Trading Strategies
The Top 10 Best Trading Books That Changed My Mindset, Strategy & Performance
Discovering Your Trader Profile: What Kind of Trader Are You?
Follow me for more daily market insights!
Jasper Osita - LinkedIn - FXStreet - YouTube
This content may have been written by a third party. ACY makes no representation or warranty and assumes no liability as to the accuracy or completeness of the information provided, nor any loss arising from any investment based on a recommendation, forecast or other information supplies by any third-party. This content is information only, and does not constitute financial, investment or other advice on which you can rely.
ACY Securities is one of Australia's fastest growing multi-asset online trading providers, offering ultra-low-cost trading, rock-solid execution, technologically superior account management and premium market analysis.
Select the categories and companies you wish to follow directly to your person rss feed.
Create Custom RSS FeedSign up and join over 5,000 professional members who receive personalized news alerts, curated professional connections, and more for free!
Binance has lowered its VIP 3 Wallet Assets threshold from $3 million to $1 million and will now count OTC Spot Trading Volume at a 4x multiplier toward VIP qualification, removing the previous VIP 4 cap and allowing eligible users to progress through the full tier framework up to VIP 9.
Retail futures trading leader NinjaTrader Group has appointed Mark Omens as Senior Vice President, Commercial Strategy, bringing a 25-year veteran of derivatives marketplace CME Group into a newly created role focused on exchange partnerships and enterprise growth.
Gold Price Action Forecast: Will XAU/USD Drop to $3930? Meta Description: Read our Gold price action forecast to see if XAU/USD will drop to $3930.
BitDelta Securities Financial Services LLC (“BitDelta Securities”) today announced that it has received full regulatory approval from the Capital Market Authority (“CMA”) of the United Arab Emirates under the Category 5 — Arrangement and Advice license framework (License No. 20200000439). The approval follows the firm's receipt of In-Principal Approval earlier this year and represents the successful conclusion of the CMA's full licensing process, including the satisfaction of capital requirements, governance appointments, and operational setup.
Crypto.com has received a $400 million strategic investment from Citadel Securities, valuing the firm at $20 billion. It marks the first institutional funding round in the company's history, aimed at accelerating its expansion into tokenised securities, derivatives and other asset classes.
WTI’s pullback into $79–82 is the first major test of the bullish Elliott Wave count, with buyers targeting a renewed break above $85.

BitDelta Securities has secured a full CMA Category 5 licence in the UAE and opened a regulated office in Business Bay, Dubai. The firm operates as an introducing broker, connecting investors with licensed international brokers across multiple asset classes, with CEO Dr. Demetrios Zamboglou commenting on the milestone.
Index volatility is asleep while single stocks fight it out underneath, credit refuses to confirm the equity rally, and a bare macro calendar hands next week to oil.
Digital assets and FX brokerage GC Exchange FZE (GCEX) has appointed Mohammed A. Mulla as a Board Member of its Dubai-based entity, part of the wider GCEX Group.
Learn what Blockchain-as-a-Service is, how it works, and why businesses are using BaaS to build blockchain applications without managing infrastructure.