just now

Liquidity Finder Ltd is incorporated in England and Wales, company number 10610740, registered address 167-169 Great Portland Street, Fifth Floor, London W1W 5PF, United Kingdom.
Published: just now


If you're just starting your journey in forex trading, one of the most important skills you need to develop is understanding how to analyze market trends. Trend analysis forms the backbone of any solid forex trading strategy—helping you trade in the direction of momentum, avoid costly mistakes, and make confident decisions.
In this beginner-friendly guide, we’ll explore simple and effective ways to identify market trends using both price action techniques and technical indicators. Whether you're trading major currency pairs like EUR/USD or GBP/JPY or even metals like Gold and Stock Indices like Nasdaq, this strategy-focused breakdown will give you a clear edge in navigating the markets.
This beginner-friendly forex trading guide walks you through a structured, actionable approach to trend analysis. By the end of it, you’ll understand:
Whether you're trading Gold, EUR/USD, or Nasdaq, this guide provides a repeatable process to read trends, enter with confidence, and manage trades like a pro.
"The trend is your friend until it bends."
Analyzing trends gives traders the edge to stay in-line with the current direction and lessen risks of trading against the overall direction. Here's why trend trading remains a top strategy in 2025:
By reading current price structure and momentum, you can anticipate where the market is likely headed.
2. Follow the Trend
Aligning your trades with the prevailing trend improves accuracy and consistency. Trend-following strategies remain among the most effective approaches in both bullish and bearish markets.
3. Forewarning of Incoming Reversals
Even the strongest trends eventually end. Learning how to recognize trend reversal signals gives you the chance to exit early or even capitalize on the move in the opposite direction.
There are two main ways to analyze trends
Relies on visual interpretation and trader intuition.
Common tools include:
It’s flexible, intuitive, and ideal for traders with strong chart-reading experience.
2. Objective Trend Analysis (Indicator-Based)
Uses math-based indicators to define and measure trends.
Common tools include:
It’s consistent, quantifiable, and great for systematic or beginner traders.
For the best of both worlds, you can use a confluence-based approach like this:
Step 1: Determine the Daily Timeframe Direction
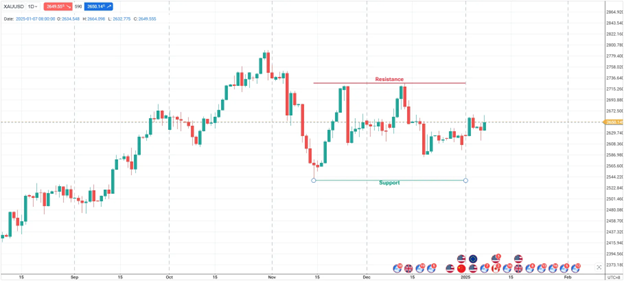
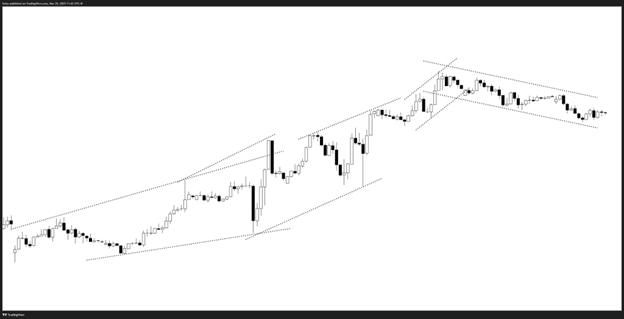
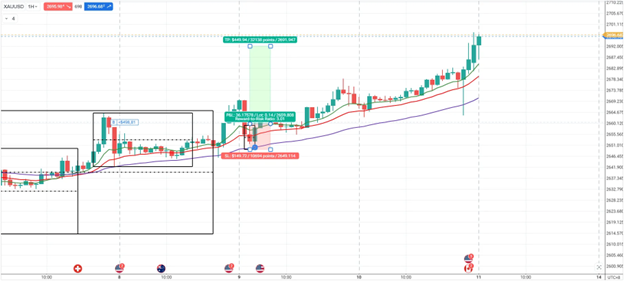
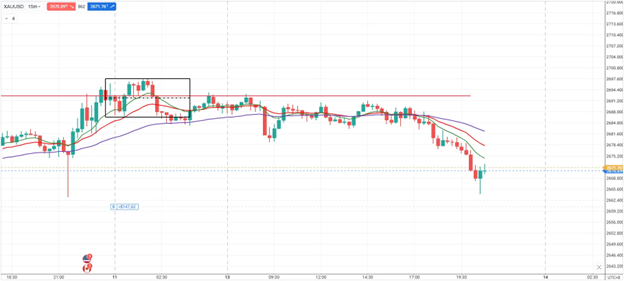
In this example, we will use Gold.
What I usually do is always start my analysis on the Daily Timeframe.
Looking at the Daily Chart, we can see that Gold is still inside a big range, price bouncing off at the resistance and support level.
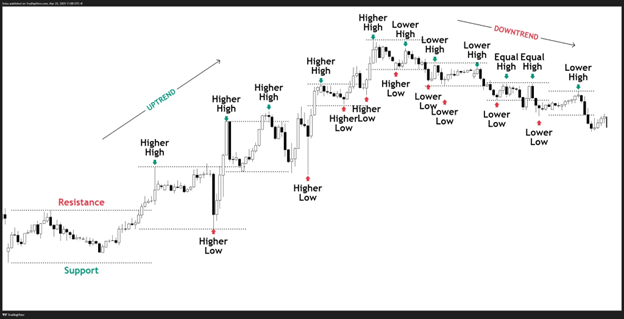
What’s the status of the swing highs and lows?
Are we in a trending or non-trending condition?
Do we have an obvious trend to mark out our highs and lows?
Checking the status of Gold, its currently above the 50% of the whole range, which could tell us that despite being on an overall range-bound market, there are signs that it is at a bullish territory inside the range.
We were able to determine the higher timeframe direction by just looking at the highs and lows and if its still intact or not.
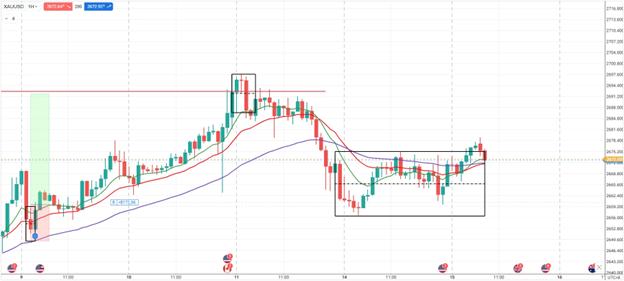
Step 2: Drop Down to a Lower Timeframe and Analyze the Swing Highs and Lows
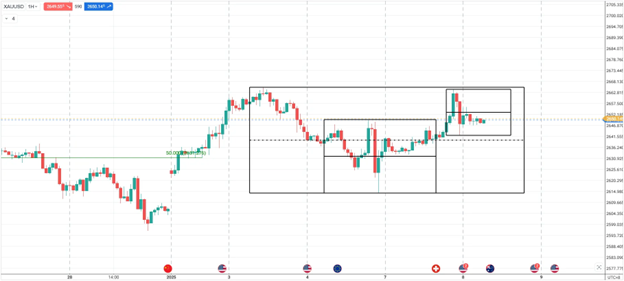
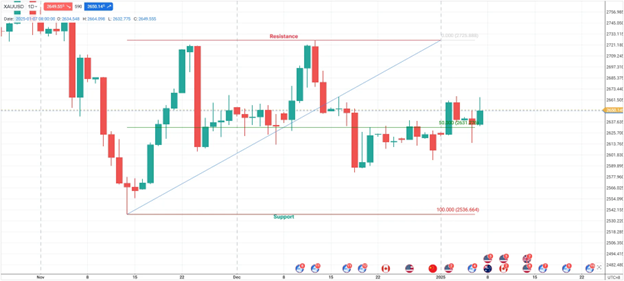
Dropping to H1 Timeframe, we can see that we are also in a range. And we have ranges inside the bigger range that tells us a story building up.
Note that I use H1 Timeframe as my higher timeframe on a day trading scale for trend direction during the day.
Previously, price was ranging at the 50% of the range, and now price is ranging near the resistance level, indicating that:
The approach that we could take here is:
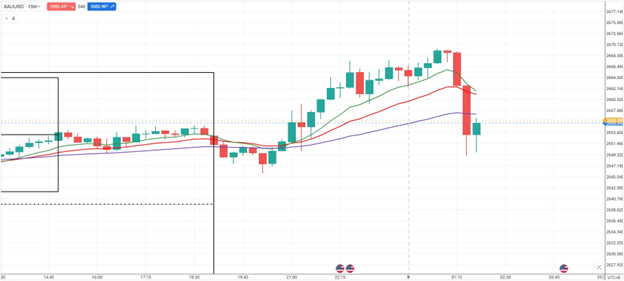
After sometime, Gold has broken out of the range.
Now, we look for opportunities.
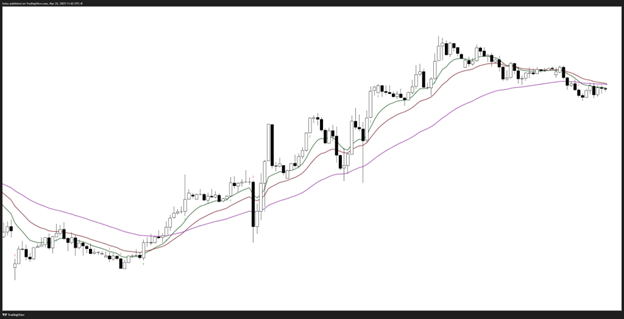
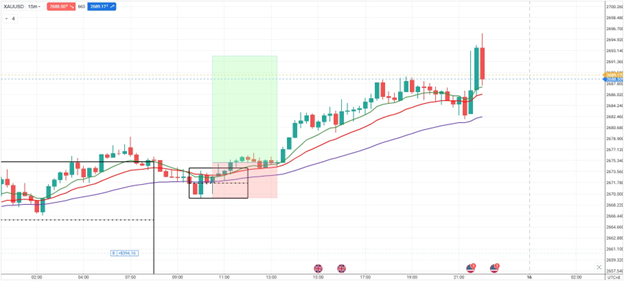
Step 3: Plot the Moving Averages & Wait for a Pullback
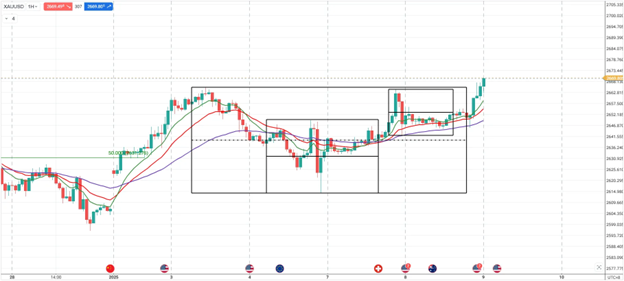
We only activated the Moving Averages after price already showed us that its now willing to go to a certain direction which in this case is to the upside.
We could use the Moving Averages for:
Hence, we are now looking for a trade once price goes back to our Moving Averages for a potential upside move.
Once price has now dropped to our Moving Averages, we could look for long opportunities on a lower time-frame.
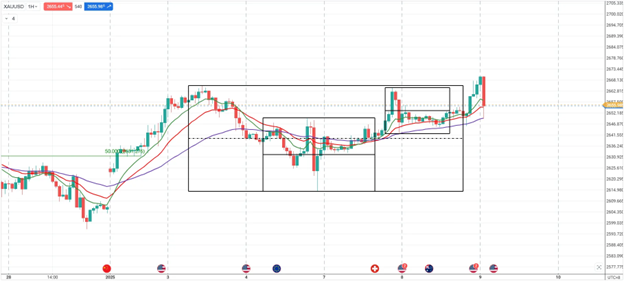
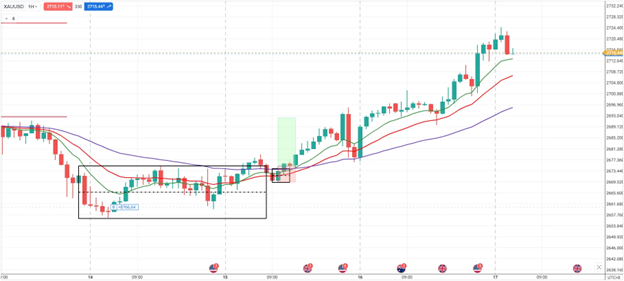
Step 4: Drop to Your Execution Timeframe to Frame Trades
As we can see, there is still no confirmation that Gold is now finished with its pullback.
To lessen risk, we want:
The narrative for this is that, we need CONFIRMATION before we execute a trade.
We also want our Execution timeframe to be in-synced with our Direction timeframe, which is the Daily.
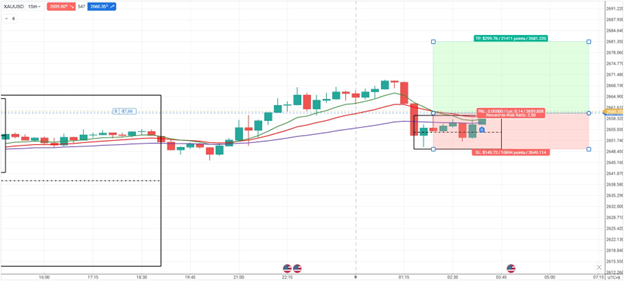
Once price breaks out, we look for longs with stops behind the structure.
This is the importance of waiting for CONFIRMATION:
1. Filters Out False Signals
Not every breakout, bounce, or reversal is genuine. Confirmation—whether it’s a candle close, indicator alignment, or structural break—helps you avoid getting trapped by market noise.
2. Increases Trade Validity
Combining a clear trend bias (e.g., HH/HL structure, bullish channel) with a confirmation trigger (e.g., RSI > 50, break of a micro range, FVG reaction) stacks the odds in your favor.
3. Supports Emotion-Controlled Entries
When you wait for confirmation, you’re letting the market prove itself before you commit capital. This reduces impulsive decision-making and improves discipline.
4. Allows for Secured Stop Placement
Confirmation often provides a logical structure point (e.g., swing low, FVG edge, or EMA) to place your stop-loss. This results in better risk management, tighter stops, and improved risk-to-reward ratios.
Rather than guessing, you're anchoring your stop-loss to price behavior and market context.
Jumping into a trade without confirmation is like entering a building without checking if the floor beneath you is stable. Confirmation is your safety net. It gives you the added edge of probability in an environment where uncertainty is the norm.
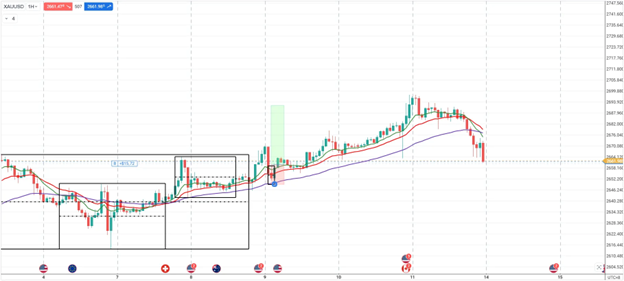
Step 5: After Execution, Scale Up to Higher Timeframe to Reduce Noise
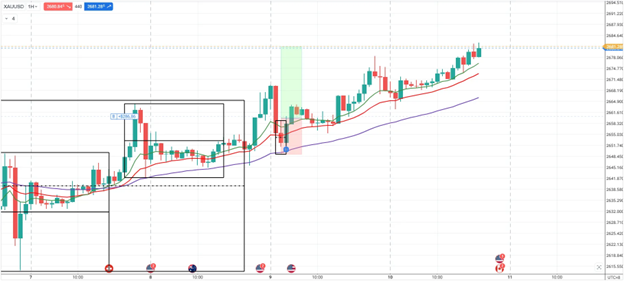
The primary reason why we entered on the Lower Timeframe is the Higher Timeframe confirmed that we are already set for an upside direction.
We only dropped down to the Lower Timeframe, which in this is M15, for us to:
We scale up to the H1 Timeframe to:
Step 6: Mark Levels for Potential Reaction Points
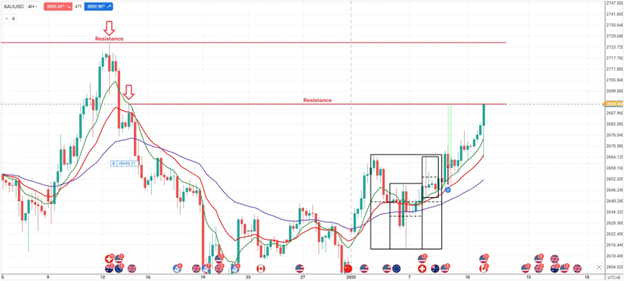
Always mark levels where price could encounter potential roadblocks.
Step 7: Set Targets
2 Approaches That We Could Take:
You could set specific reward targets as you follow your trade.
You could also set reward targets at previous resistance levels if you are going long in the market.
2. Dynamic Target
Follow the trend until the Moving Average breaks.
But there’s a way to determine if the Trend is about to End.
Step 1: Dropdown to Your Lower Timeframe
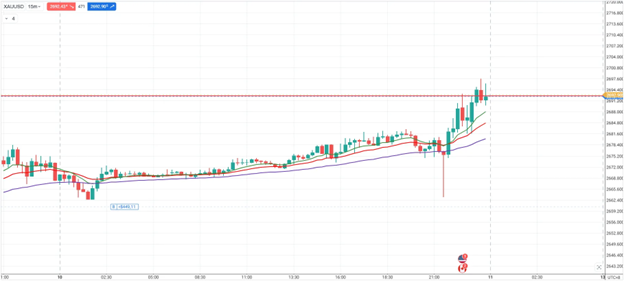
Once price reaches a key level, higher timeframe resistance levels, drop to your execution timeframe. In this case, we drop to M15.
Step 2: Wait for Signs of Weakness
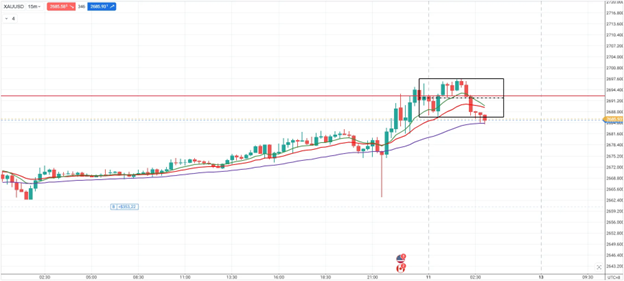
Signs of Weakness:
If this all happened at a key level, you can exit the trade.
What if price shoots up?
The answer to this is, “What if it doesn’t?”
If we did not exit after the range and the moving averages broke down, we’d be returning gains.
The solution to “What if price shoots up?”
H1 Timeframe
M15 Timeframe
H1 Timeframe
You can always reenter in the market.
Master your process, and the profits will follow.
Trend analysis is more than just identifying market direction—it's about building a complete narrative across timeframes, supported by confirmation, structure, and technical logic. What we have used as an example of analyzing and riding the trend is just one of the strategies available out there that is simple. Whether you're using trendlines and price action or incorporating moving averages and RSI, combining both subjective and objective tools gives you a high-probability edge.
As a beginner in forex trading, your priority is to develop a consistent process. Don’t rush entries. Let price show you the story. Wait for confirmation, place secure stops, and frame trades based on what the market is actually doing—not what you hope it will do.
ACY Securities is one of Australia's fastest growing multi-asset online trading providers, offering ultra-low-cost trading, rock-solid execution, technologically superior account management and premium market analysis.
Select the categories and companies you wish to follow directly to your person rss feed.
Create Custom RSS FeedSign up and join over 5,000 professional members who receive personalized news alerts, curated professional connections, and more for free!
Index volatility is asleep while single stocks fight it out underneath, credit refuses to confirm the equity rally, and a bare macro calendar hands next week to oil.
Digital assets and FX brokerage GC Exchange FZE (GCEX) has appointed Mohammed A. Mulla as a Board Member of its Dubai-based entity, part of the wider GCEX Group.
Learn what Blockchain-as-a-Service is, how it works, and why businesses are using BaaS to build blockchain applications without managing infrastructure.
CFDs vs stocks compared on leverage, ownership, costs, dividends, taxes, and risk. Learn the differences between stocks and CFDs and discover which suits your investing or trading goals.
Want to master the markets? A winning trading mindset beats a perfect strategy. Learn how emotional discipline helps you conquer fear and avoid heavy losses.
Read our latest Gold price action forecast to see how a double top pattern triggered a massive XAU/USD selloff.
Wondering how the API weekly report impacts oil prices? Learn how U.S. crude stockpiles and voluntary surveys predict the official EIA report.
cTrader Mobile 5.9 introduces a dedicated charts tab, single-tap chart access, a draggable floating action panel and a new focus mode for positions and orders, following the platform's Best Mobile Trading App win at UF Awards Global 2026. Sergey Borisov of Spotware comments on the update.
BitPay B.V., the European arm of BitPay, has been authorised as a crypto-asset service provider under MiCA by the Dutch AFM, allowing it to offer regulated crypto and stablecoin payment services, cross-border payments, and consumer spending tools across the EU.
Spotex has appointed Joe Tuccio, previously Head of Digital Partnerships at Seabury Capital, as Head of Digital Assets. Tuccio brings 20 years of financial markets experience and will lead partnerships with liquidity providers and custodians as Spotex expands its institutional FX venue into digital assets.