
How To Build A Currency Strength Meter Via Tradingview

**24 March 2019, Ivan Delgado (Global Prime) **- In this article, I will introduce the methodology I use that allows me to monitor the overall strength of a currency vs its peers in order to assess the overall aggregate demand or supply.
The Nature Of Forex vs Stocks Trading
The Forex market comprises a constant flow of buying and selling orders in a range of currencies. The main distinction when trading Forex vs the stock market resides in the characteristic of how these instruments are traded. While the name of a stock can genuinely develop a bullish trend by which the value, denominated in the country's local currency, keeps increasing, in the Forex market, that’s not the case. Due to the nature of how currencies trade against each other, whenever there is an imbalance of demand or supply against a particular currency, it must be cross-referenced against another currency, which is why we end up trading pairs. That’s a major distinction to make and why the development of a currency strength meter that can take the pulse of the overall performance of a currency in the market is key.
We don’t see a product available to trade Apple vs Facebook, right? We could theoretically and very easily do so if we were bullish that imaginary pair by buying the stock of Apple and selling the stock of Facebook and hope to make money by the larger gains of the former. As elusive as it sounds to trade the pair Apple/Facebook, that’s how we trade the Forex market, by analyzing the demand/supply of a currency vs another, which is why theoretically, we don’t really see bullish trends per se in Forex but the strength or weakness of a currency vs another.
Because of that, wouldn’t it be handy if we could assess, at any one time, what’s the aggregated performance of a particular currency vs the rest of the FX universe in equally weighted terms? Unless we find a way to mitigate this obvious shortcoming to objectively spot the overall performance of a currency, scanning through the charts all the pairs available to determine which currencies are the best to pair with one another is an incredibly difficult task and very time-consuming.
The Art Of Matching Up Strongest vs Weakest
In this article, I will introduce the methodology I use that allows me to monitor the overall strength of a currency vs its peers in order to assess the overall aggregate demand or supply. At the end of the day, profiting from trading currencies, at its core, involves the art of identifying a currency that is losing value vs one that is gaining value in order to create a matchup that moves in a particular direction. This gives us a major advantage to exploit the most obvious market trends developing.
Despite it being well known that a large share of the volume transacted in the Forex market goes through the books of the Euro vs the US Dollar, which is why the DXY index is weighted by almost 60% towards the trading pair EUR/USD, wouldn’t it be of use if we could evaluate the performance of the EUR against its main peers, so that we can come up with a more equally weighted balance of the overall performance of the currency across the entire marketplace? What if we could create an index that measures precisely this overall performance for every single currency instead of having to contend with just the performance of the DXY as guidance?
I am about to explain in detail, how anyone can do that in a few simple steps. The end result would be access to the overall performance of all currencies represented in chart lines, which will account for the total demand or supply that such particular currency has exhibited across the G8 complex. I mention G8 because to keep the exercise as relevant as possible, I’ve only selected the 8 most heavily traded forex (exc Yuan): EUR, GBP, USD, AUD, NZD, JPY, CAD, CHF.
The Currency Index Formula Via TradingView
Let's think about the rationale behind creating the index via Tradingview. There are a few factors we must take into consideration before the calculation of the formula such as how can we account for the different volatility measures to still come up with an equally weighted index? If we were to shrug off this factor, a move in a highly volatile EUR pair some days such as the EUR/GBP due to Brexit, could easily distort the result of the formula (index) and defeat the purpose.
That’s why when creating the formula in TradingView, not only we need to make the sum of all EUR pairs (EURUSD + EURJPY +...) but we must relativize the volatility of each pair by adding the current exchange rate of the pair in the denominator. So, essentially what it means is that each pair ends up with an initial value of 1, for an aggregated total value of 7 since we are monitoring 7 pairs vs the EUR. Here is where the magic resides, as from the original starting point in the chart, the index then begins to fluctuate up and down, with its value a true representation of an equally weighted EUR performance vs its main FX competitors.
The formula to calculate the EUR index, therefore, would be as follows:
EURUSD/1.13 + EURJPY/125.5 + EURGBP/0.87 + EURCHF/1.135
** + EURCAD/1.49 + EURNZD/1.655 + EURAUD/1.59**
Note 1: In the denominator, the values assigned refer to the Euro pair values in mid-Feb ‘19. It's important that one keeps the values in the denominator updated on a constant basis for the currency index to remain accurate. As a rule of thumb, an update of the values in the denominator every Monday should enough unless major vol mid-week.
Note 2: A Global Prime client was kind enough to make the process of updating the currency indices' values a seamless and straightforward process. Simply access this publicly available **excel spreadsheet document **and copy/paste the values you find in the blue boxes in TradingView every time you wish to update the index.
In order to create a particular currency index, you have 2 options.
Option 1. You can add the calculation into the chart by selecting the section COMPARE in TradingView. See the blue arrow:

Option 2. You can instead add the calculation in the asset's ticker section. See the red arrow:

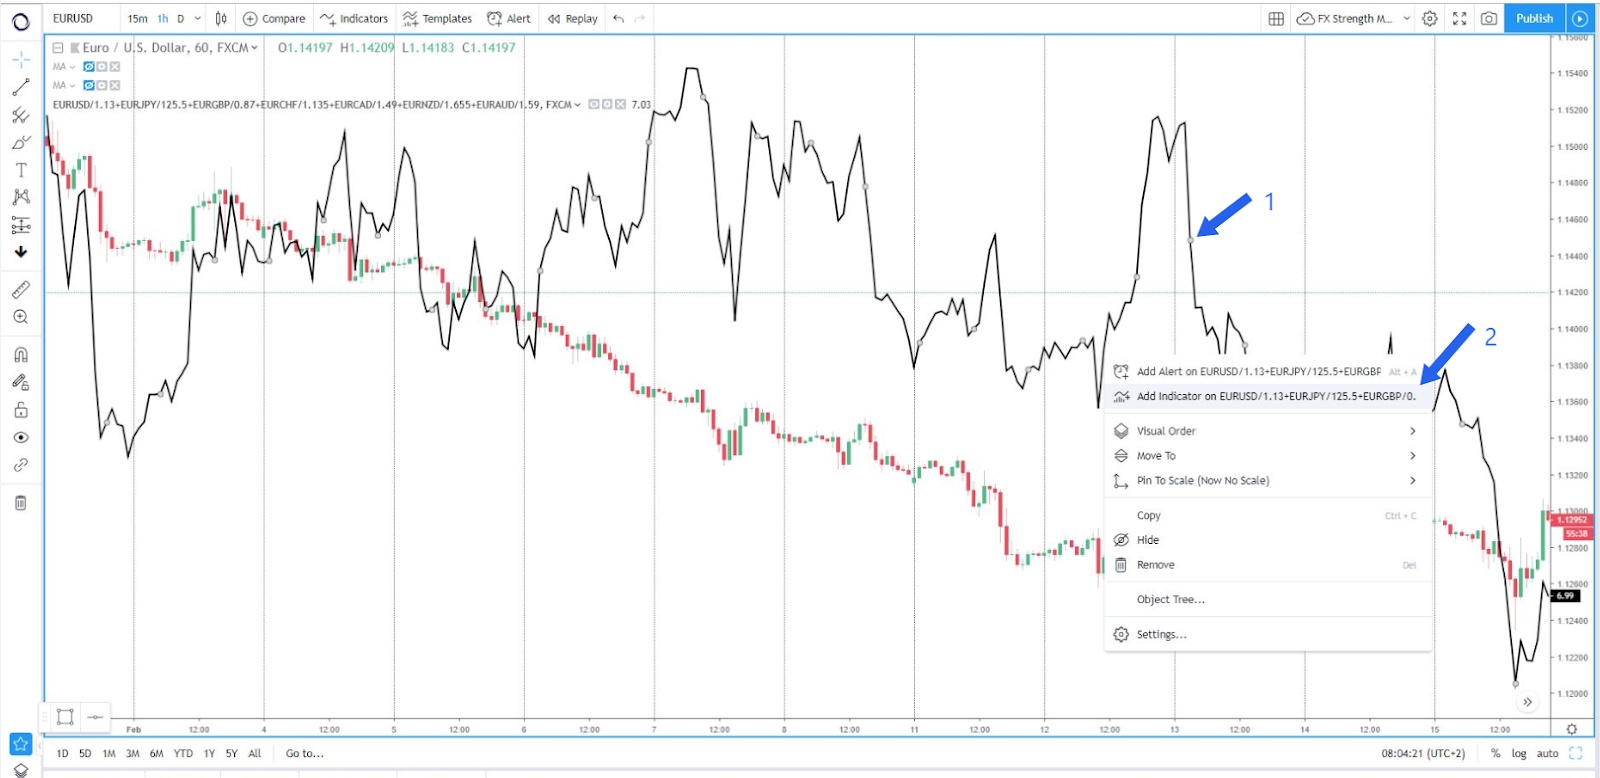
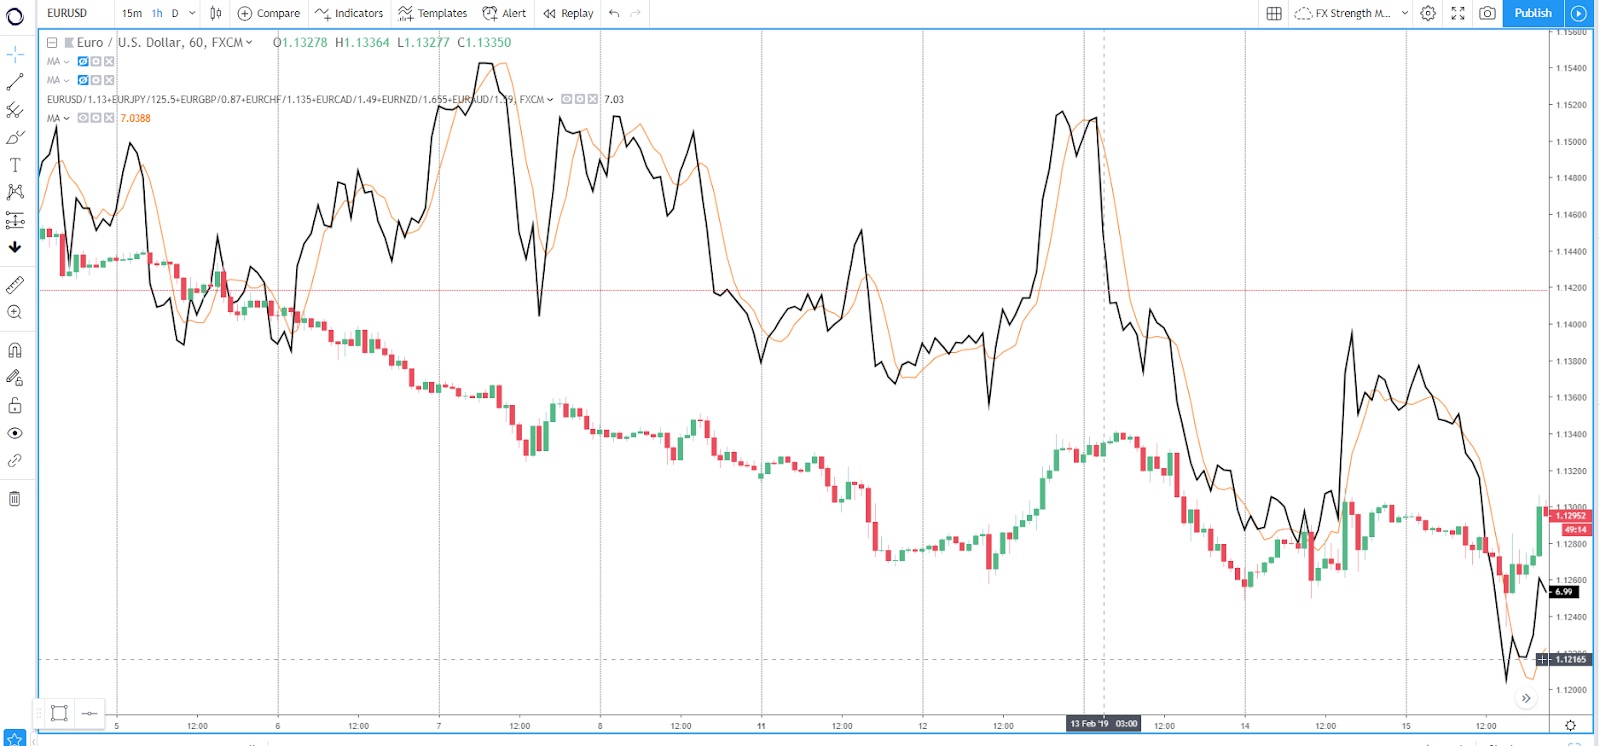
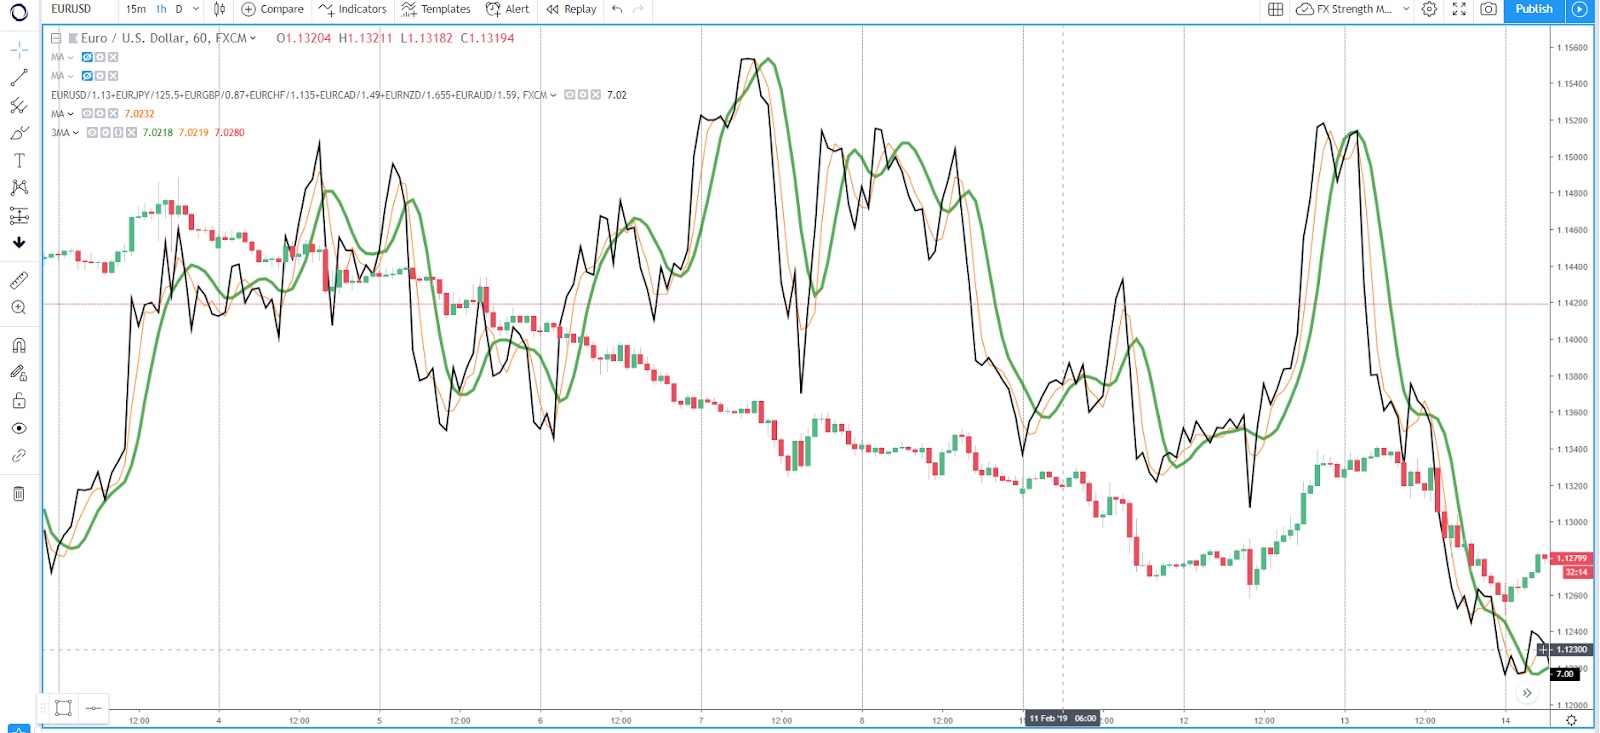
In the chart below, I illustrate as an example the exchange rate of the EUR/USD in a candle chart vs the EUR index performance overlayed in black. I’ve also boxed an instance in the chart where the EUR/USD kept selling while the overall performance of the EUR index was bullish. This information is very powerful, as it’s a communication that even if the EUR/USD was selling-off aggressively, there were other currencies, judging by the EUR index, that were under even stronger pressure.
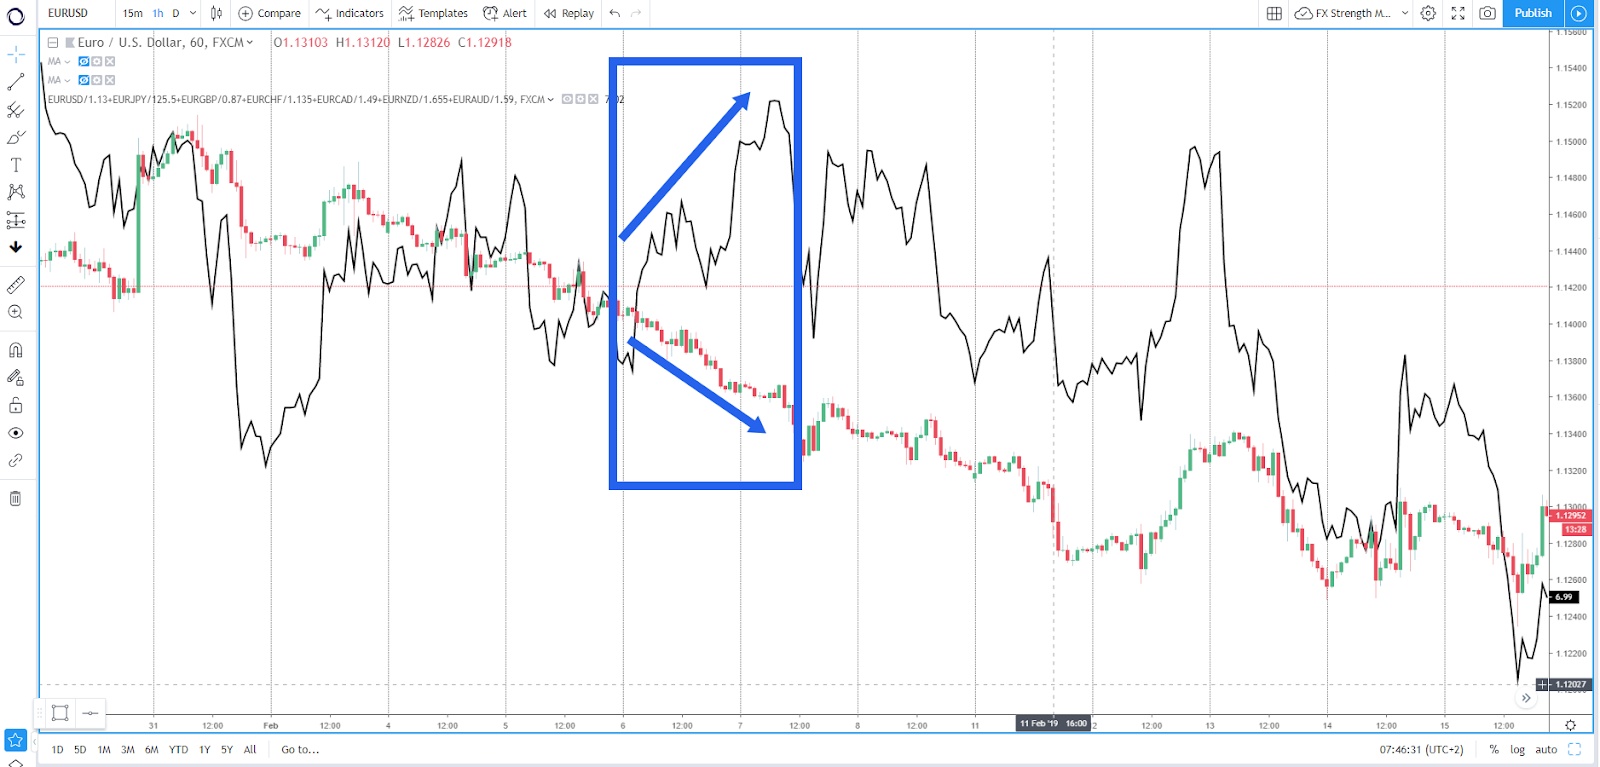
Regardless, it allows us to be in a position to trade the markets much more efficiently and stay ahead of the game by being in constant sync to exploit the best opportunities, which occur when we are able to match up the strongest vs weakest currencies.
The best traders I’ve known over the years, they are nimble, fast thinkers, and believe that the market is constantly making itself available for opportunities If we know how to find them. If you are a trader simply sticking to a certain set of pairs to trade, and due to reduced vol, the number of opportunities is largely reduced, why wouldn’t you resort to a cross-reference of the strongest vs weakest currencies in the market to open up the window of opportunities the market makes available to you?
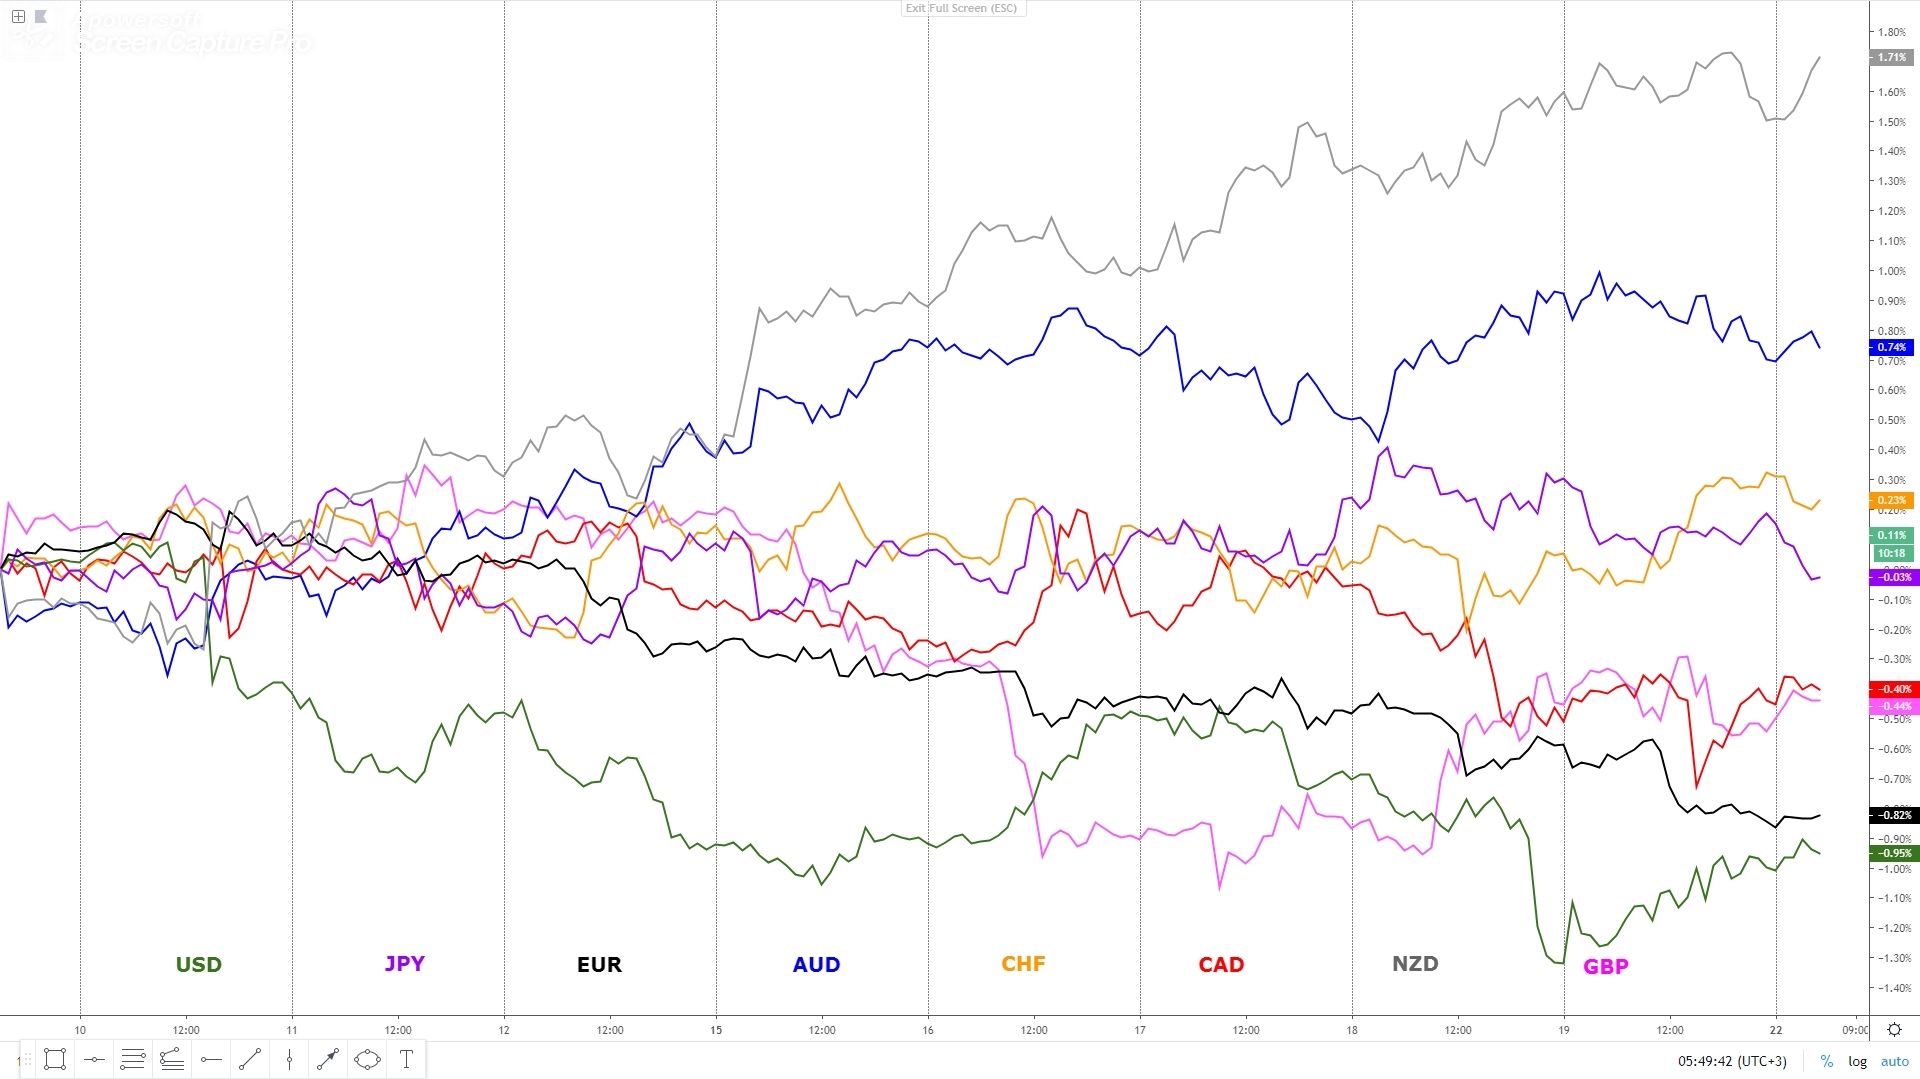
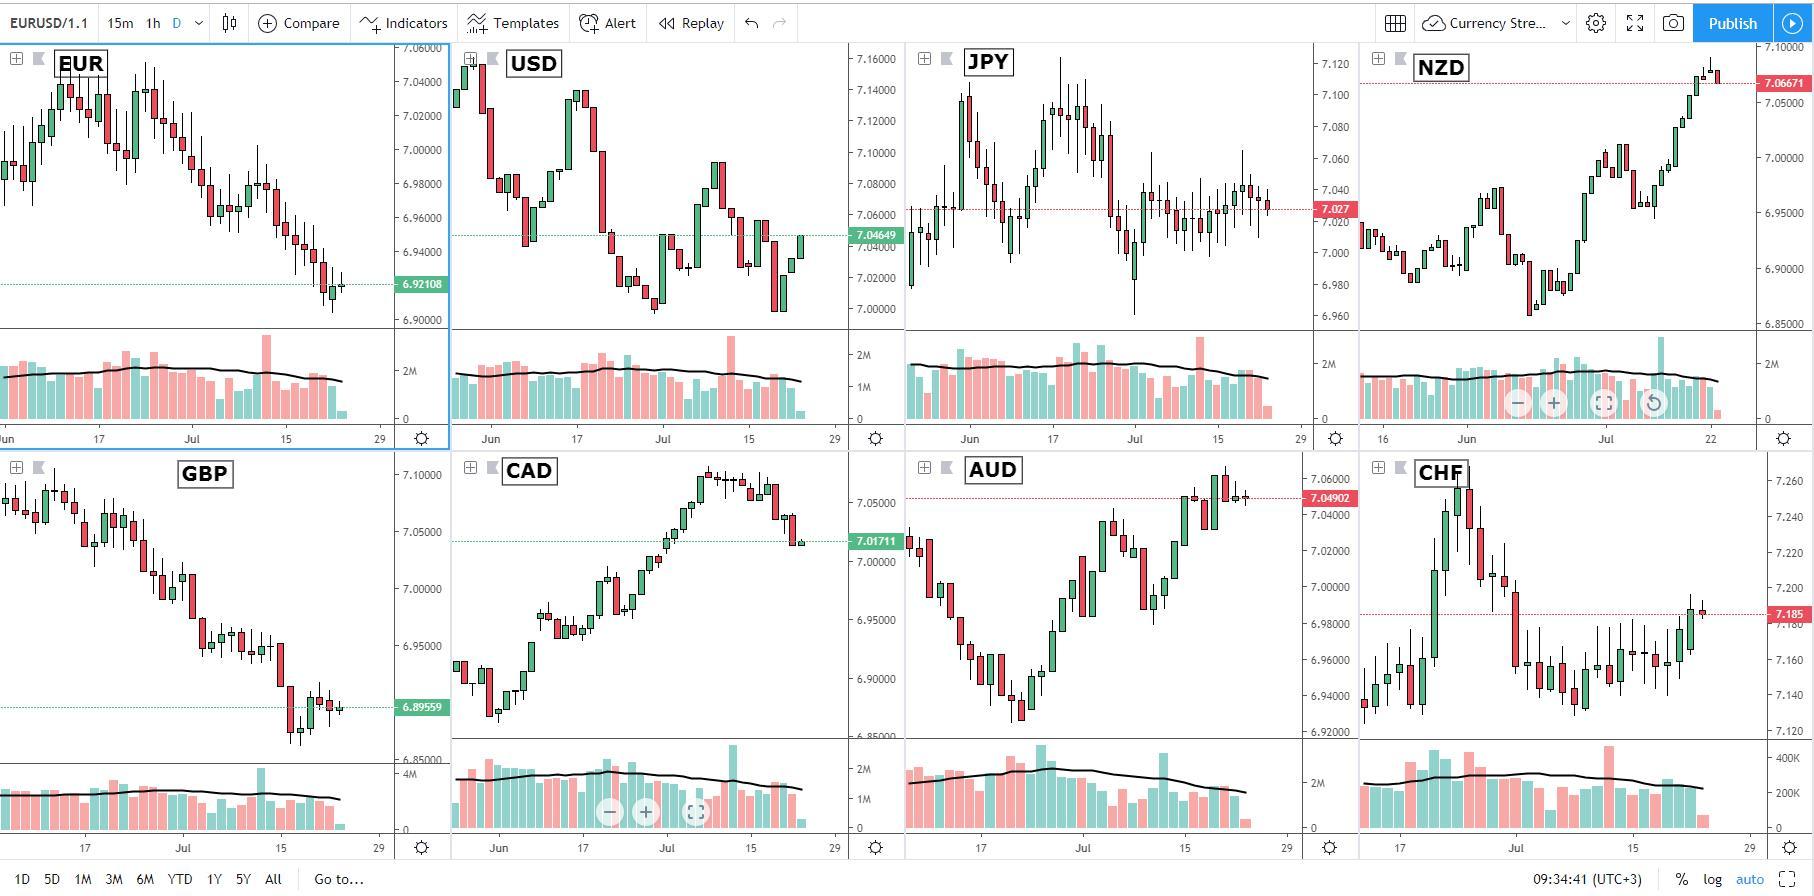
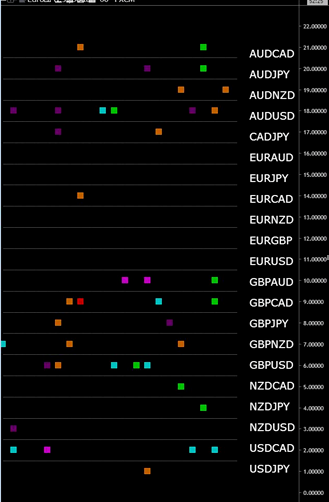
An example of a chart that includes the overall performance of all the currency indices to get an instant eagle-eye view of the forex market can be found below. To create this chart, since one must overlay multiple currency indices on top of each other in the same chart, you must resort to option 1 above to create it.
Build Your Own Currency Indices Or Gain Access To A Pre-Packaged One
Here is the good news for any user of TradingView. As long as you register a free account, anyone that follow the instructions described above can build their own currency strength meter, either by overlapping lines in the chart or instead by creating candlestick formations of the currency indices in multiple charts.
Alternatively, if you prefer to having access to a pre-packaged currency index without going through the process of building your own, all you have to do is to register your details and we will give you access. It's that easy! The only limitation is that if you wish to make changes, the link will only be in a readable format.
Click THIS LINK to register for the first format we've set up in a line chart on a daily chart with the currency indices overlapping with each other.
From Noise To Regular Turns
Before I get started on this section, an important caveat applies. Unless you are a TradingView pro plus or premium member, you will not be able to apply indicators on top of other indicators, which is the next feature I am going to explain as part of reading the forex market from a holistic approach. Since indicators on top of indicators is a more sophisticated feature, TradingView limits the functionalities to those under a free membership. Judge by yourself if it's worth purchasing a plan.
It consists of a 2 steps process, after which, you will be surprised at how smooth that line has become, hence allowing us to start defining certain biases based on the slope of the line. First of all, in TradingView, you want to place the cursor on top of the EUR index line, then right-click, and select ‘Add indicator on…’
The Currency Index: From Noise To Regular Turns
Let’s touch on an important question. Notice that the black line above is far from regular? It literally goes all over the place and it’s hard to perceive the actual trend. If you notice this to be a limitation, as I did years ago when I first started to apply these principles, then it’s pretty straightforward what we can do to address the erraticness of the moves. It consists of a 2 step process, after which, you will be surprised at how smooth that line has become, hence allowing us to start defining certain biases based on the slope of the lines. First of all, in TradingView, you want to place the cursor on top of the EUR index line, then right-click, and select ‘Add indicator on…’
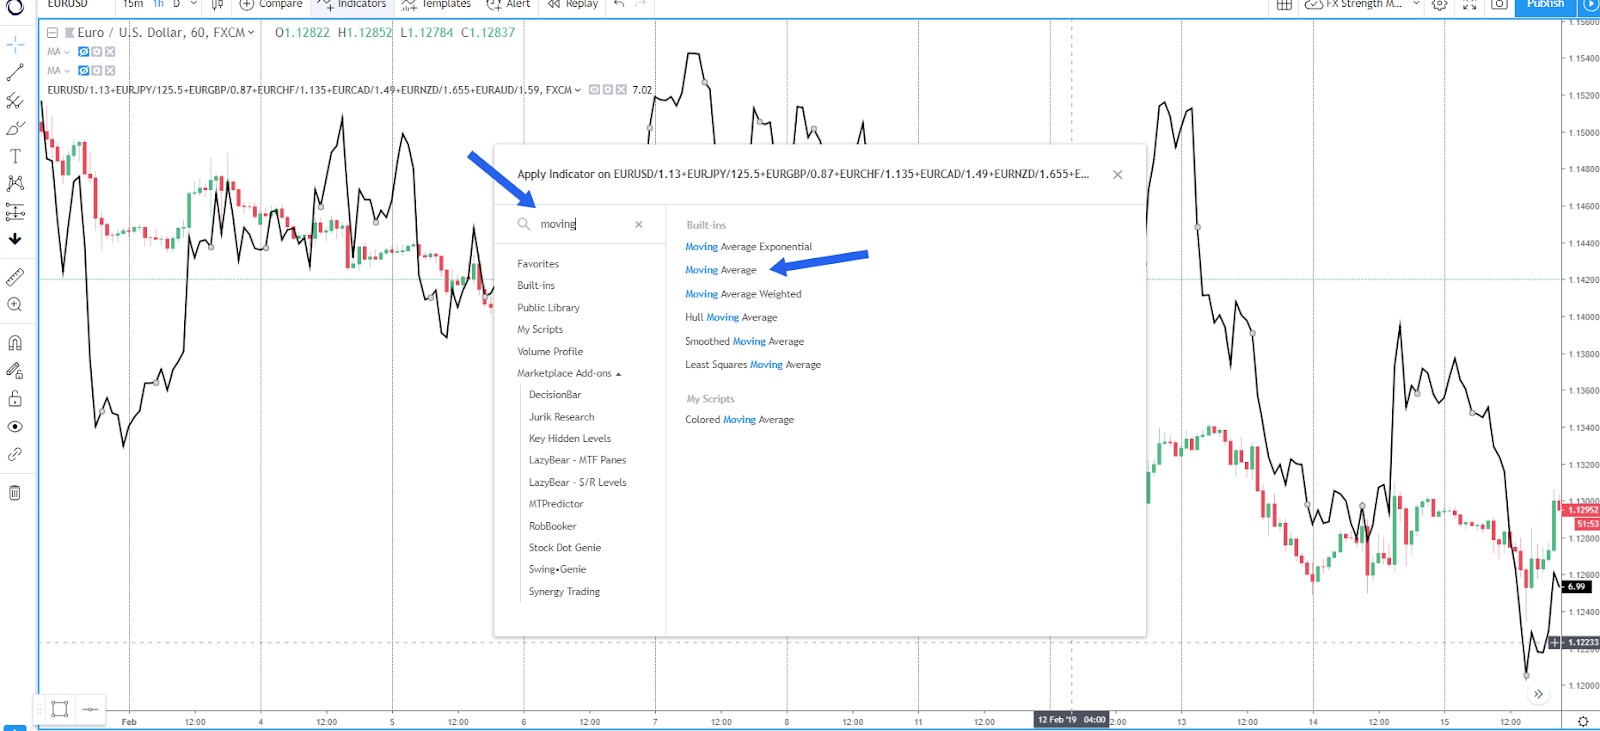
After that, type “moving” in the search box, as shown below, and select ‘Moving Average’ from the right side column of the pop up window.
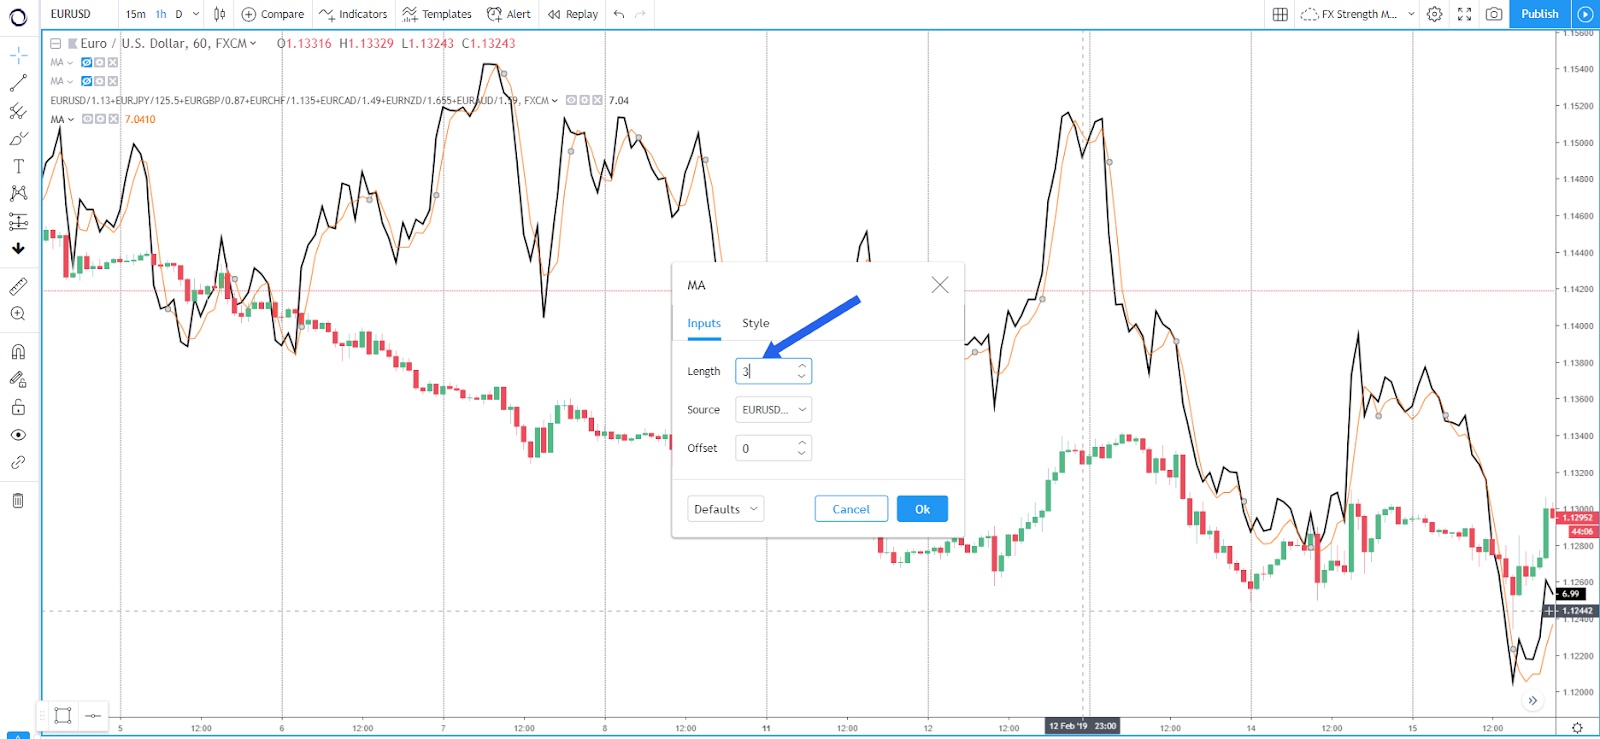
Once you’ve done that, a 9-period MA of the EUR index will be applied to the chart by default. What you want to do next is to change the settings to 5-period MA. Voila, notice how smoother the index becomes? I show you what this looks like in the orange line below.
However, there is more to it. I wasn’t still fully satisfied with the lack of regularity at the turns, as the lines sometimes go into a bit of a chopfest, leading to a potential increase in fake turnarounds in the slope, which is what communicates when the currency may be initiating a new trend. So, here is the solution I came up with to smooth it out even further, without compromising the lag. What you need to do is select the settings of the 5-period MA line and change that to 3 periods instead.
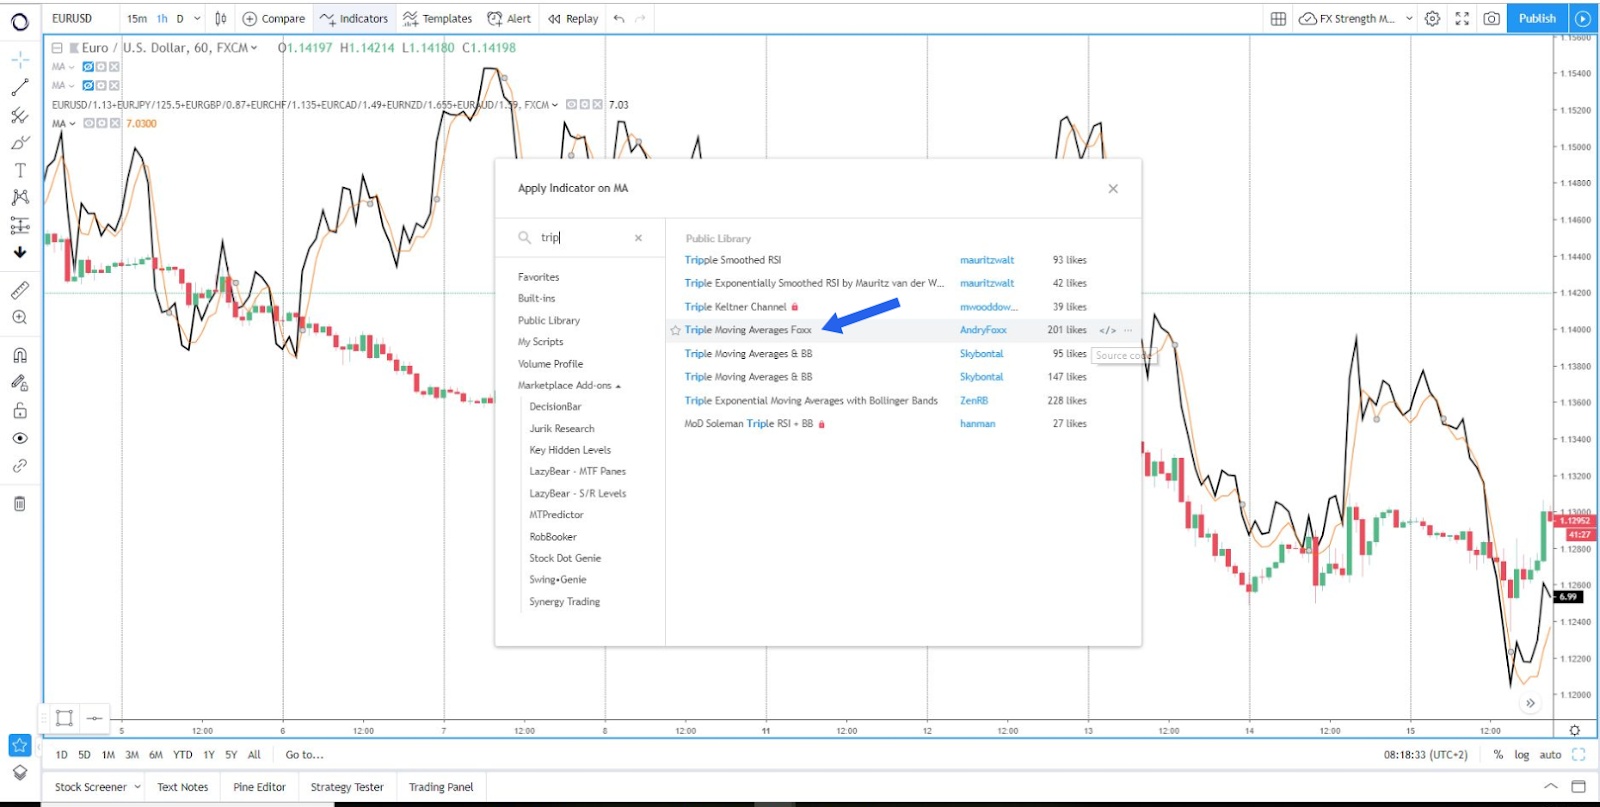
Next, and here is the trick, let’s repeat the same process again, by applying an indicator, this time to the 3-period Moving Average EUR index (in orange). The one we want to select this time is called ‘Triple Moving Average Foxx’ by AndryFoxx (free resource).
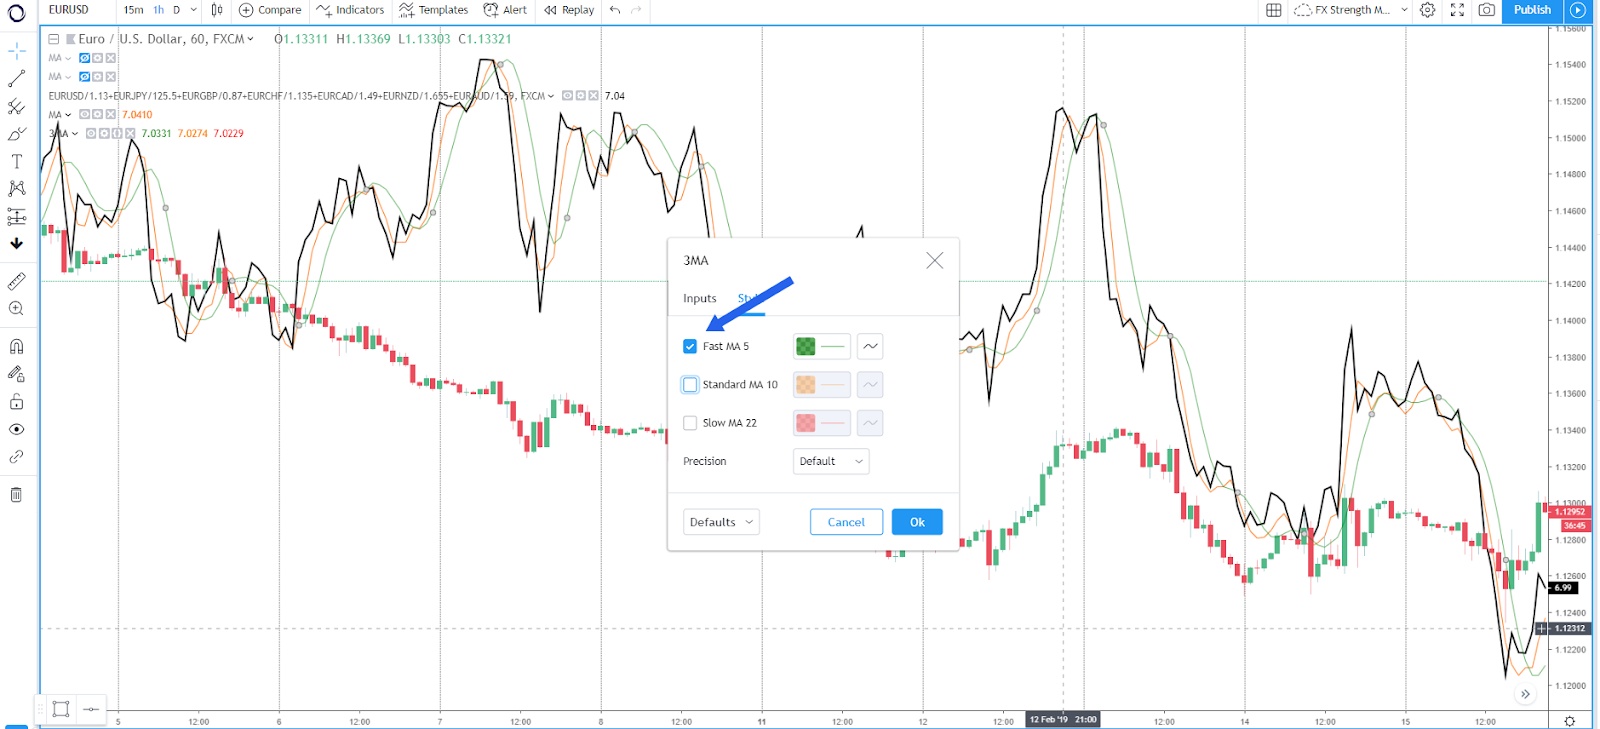
We are almost there. You will notice the chart is getting messier, with plenty of lines, which we will remove in a sec, only to stick with the single one to be used as our true EUR index. The chart has now been populated with an extra set of 3 lines as part of the ‘Triple Moving Average Foxx’ indicator. Right-click on this indicator, go to the section ‘Style’ as shown below, and unclick the standard 10 and slow 22 Moving Averages, only keeping the fast 5 Moving Average. Lastly, click 'OK'.
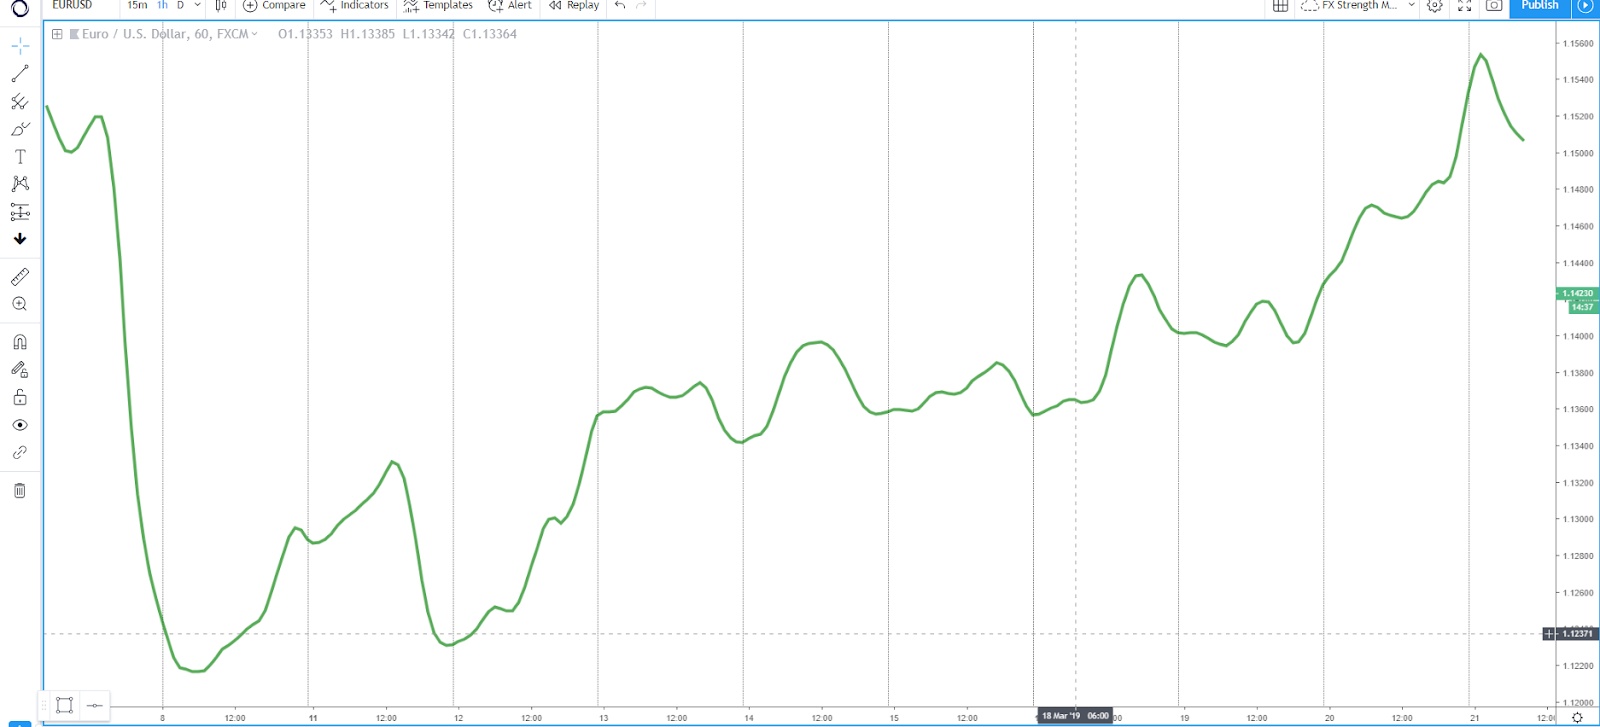
It’s time to remove the noise from the chart, but first of all, do you notice the smoothness in the index line that we’ve been able to achieve by first applying the 5-period Moving Average (orange), only to take it one step further by reducing the orange line to 3-periods and applying a second fast indicator to it? (green line) It is this second tweak that will allow us to increase the accuracy of true turns in sentiment due to the significant improvement in the regularity of the slope. However, that will come at the expense of spotting turns in the index slightly later if compared to the 3 or 5-period Moving Average. You can alter the values of the Moving Averages to something that resonates with your style.
I will continue this article by sticking to the last settings based on the triple Moving Average, as a reference to obtain the index of the currency. So, what we must do next is to hide the unnecessary instruments from the chart, and only keep the green line as our EUR barometer (currency index). It’s very important that you click at the unwanted lines, you select 'HIDE' instead of 'Remove'. If you remove the black or orange line since the green line is an indicator derived and dependable from these lines, you would be losing the EUR index line, and we don’t want that to happen. See the end result below. This is what we could understand as the most granular trend in the EUR index, taking as a reference, upon your own preferences, a 3-period Moving Average, which then gets smoothed out further by applying the triple Moving Average indicator (only the fast MA), to essentially result in the turns of the slope with a slight degree of delay if compared to the original 5-period Moving Average.
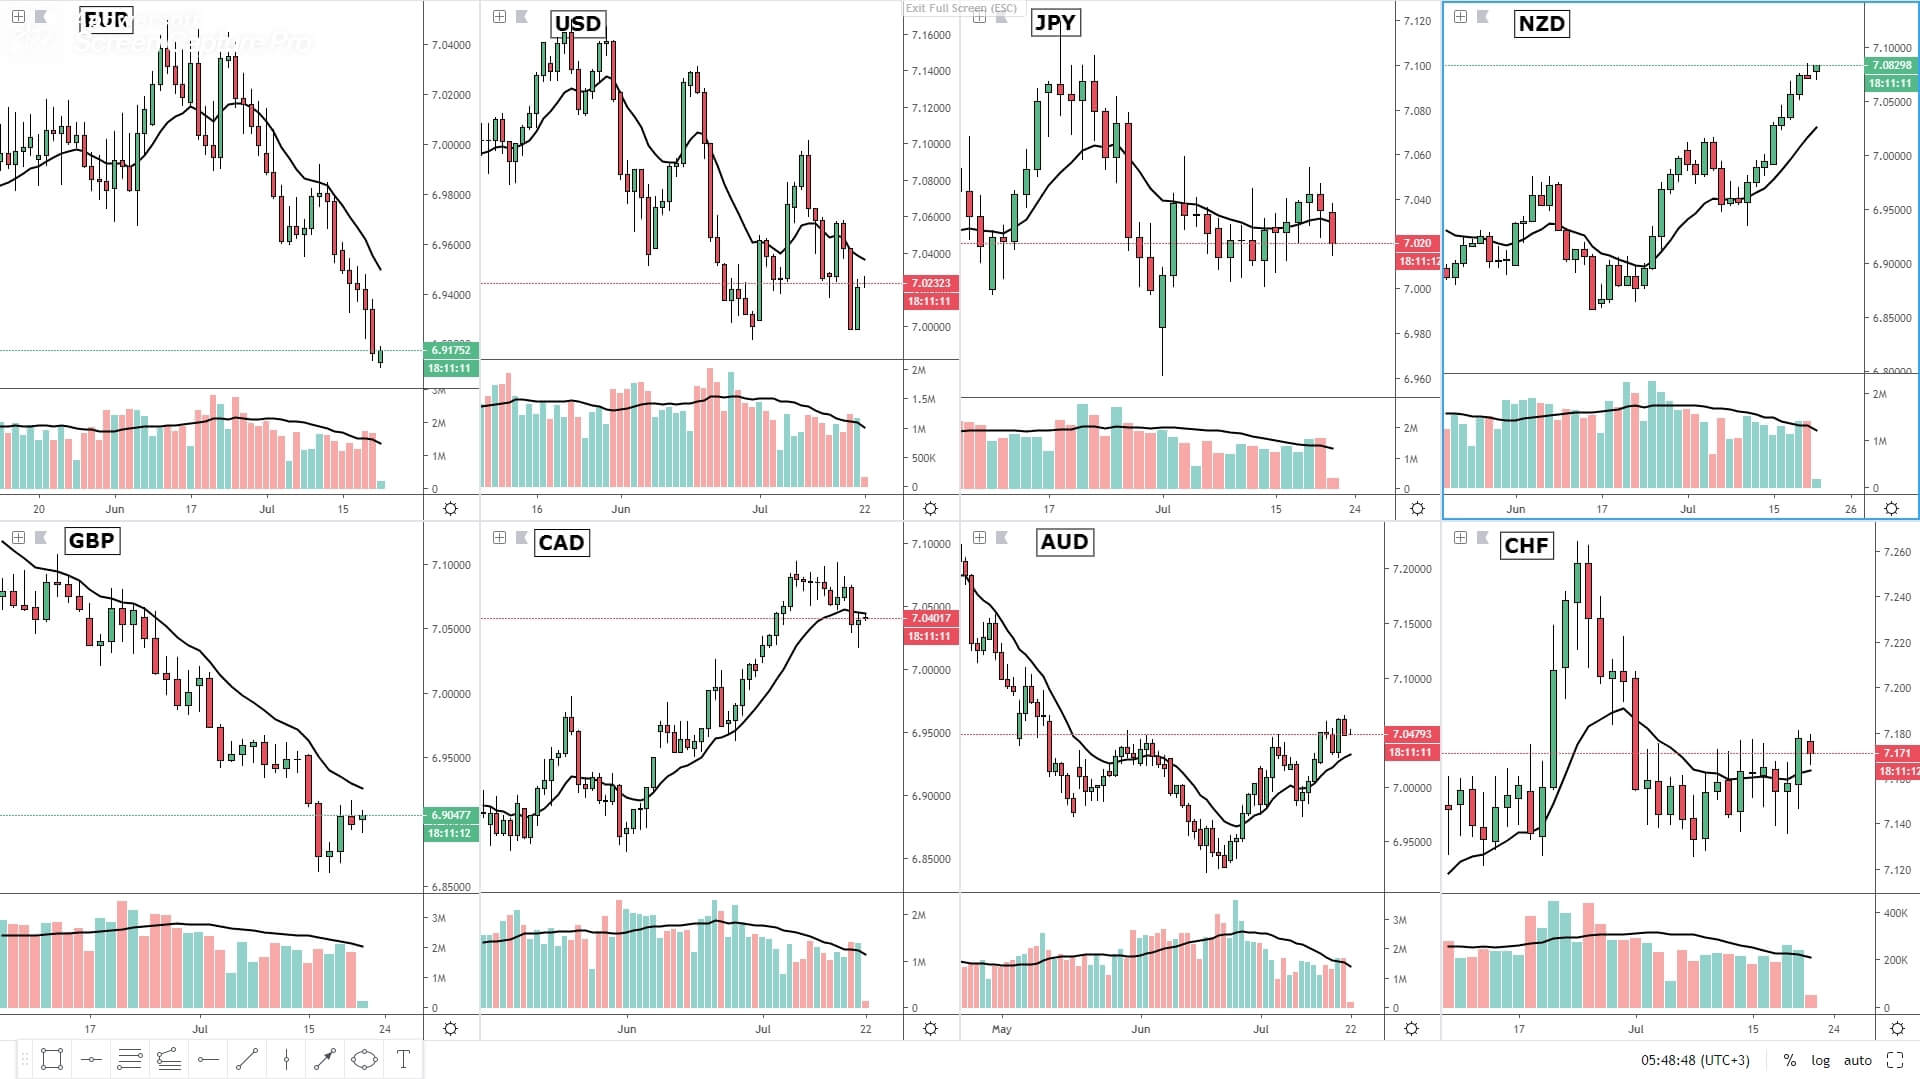
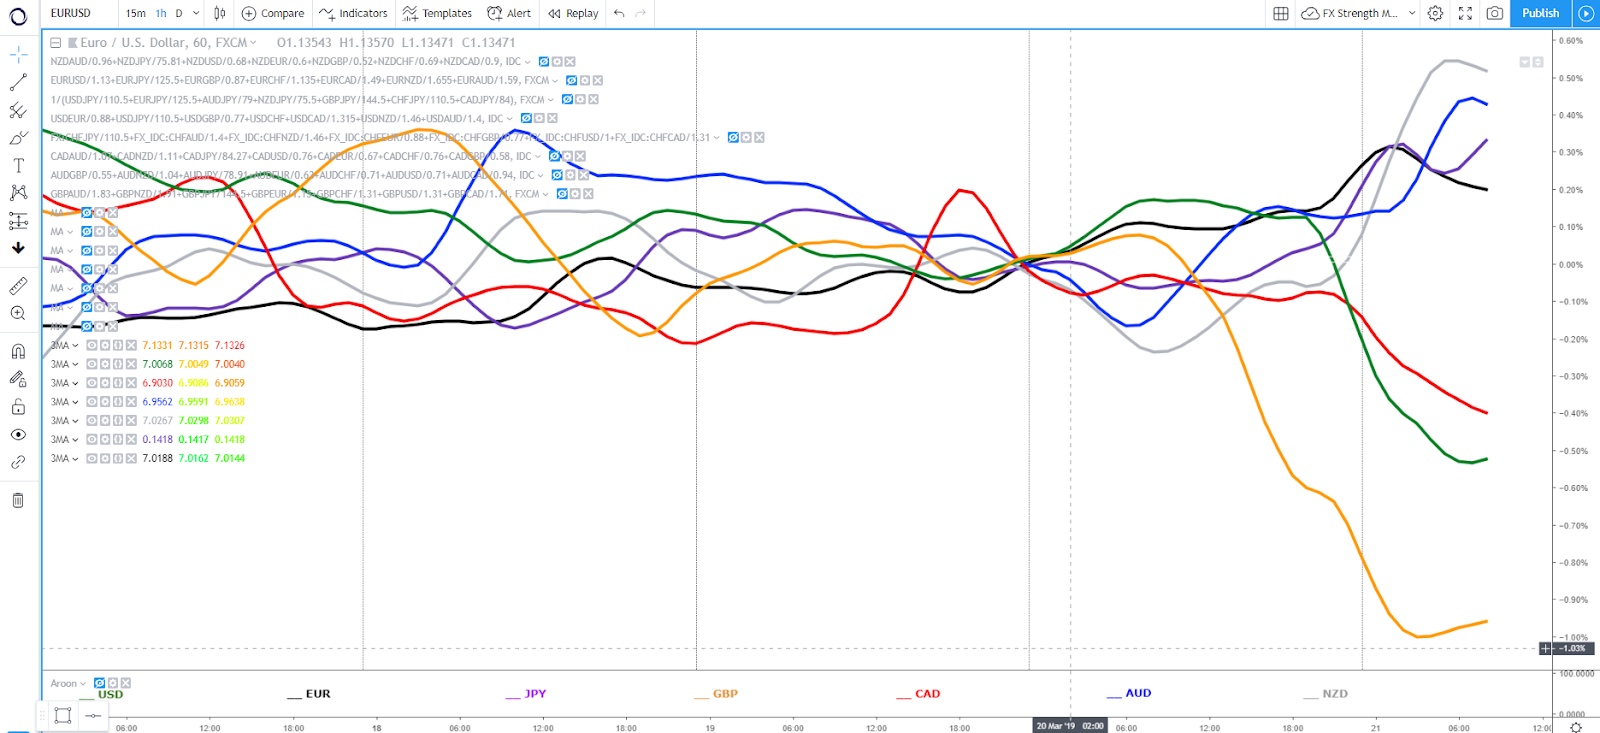
That was just the beginning though, as the same process must now be repeated for the rest of currencies. It may take a while to set up your chart, but it’s only once you must build it. After the creation of the remaining currency indices, this is what it should look like.
How To Use The Currency Strength Meter?
What I do is to keep an eye on 2 different types of trends (micro and macro), even if nowadays, with the volatility in the forex market at multi-year lows, one must be much more proactive by constantly adjusting to changes in micro-trends.
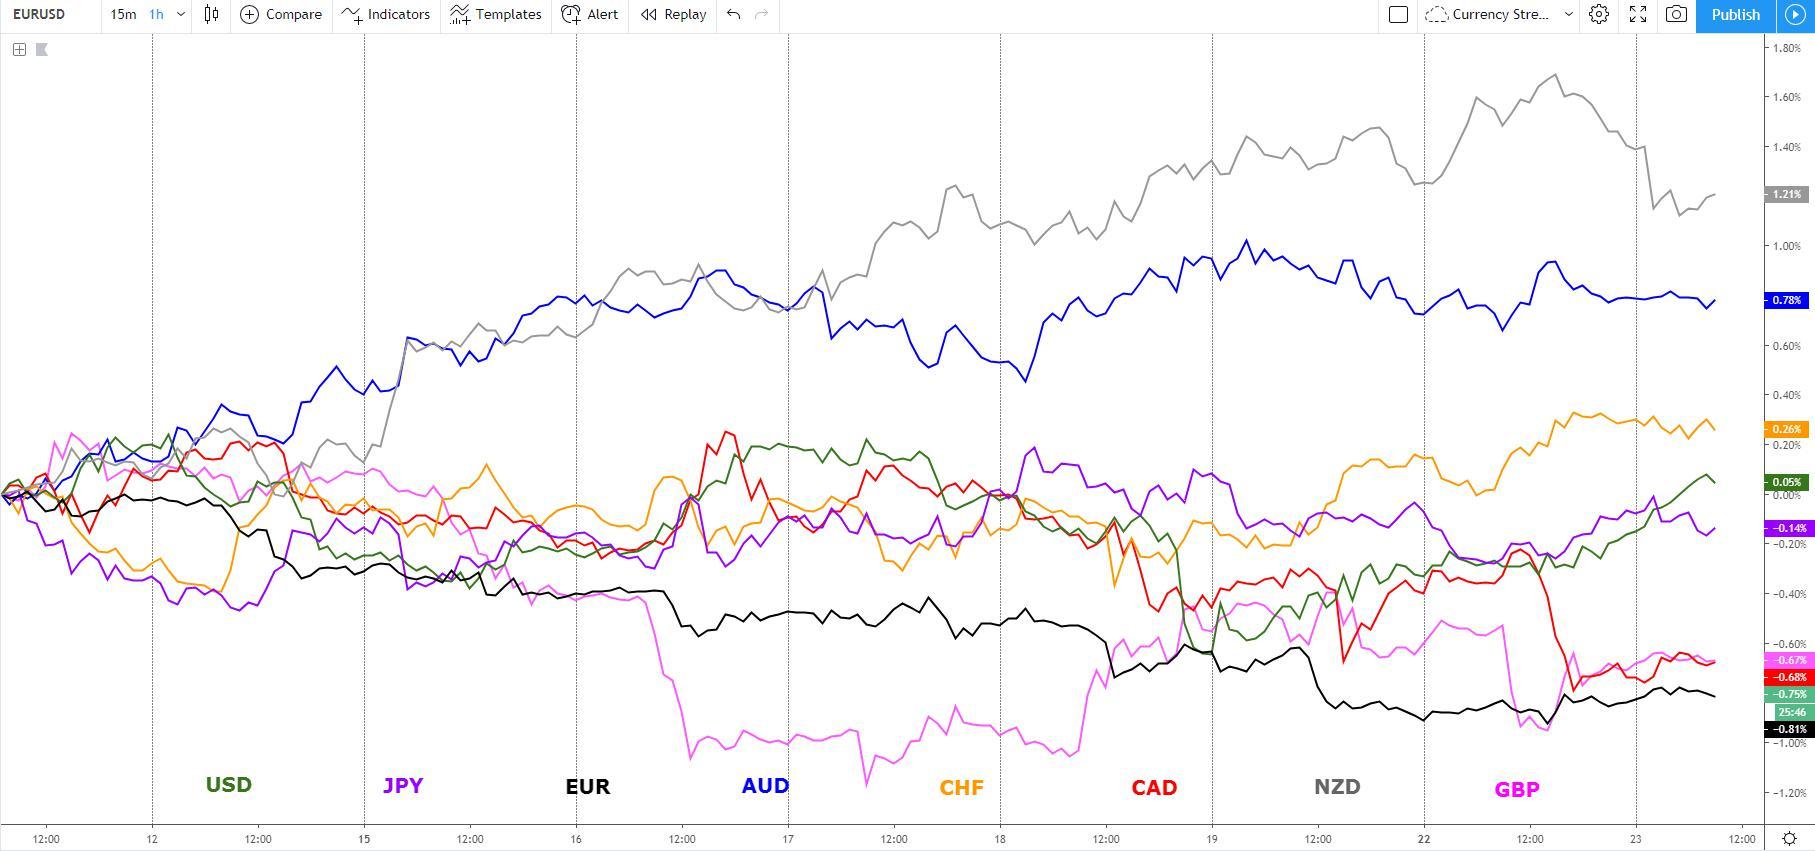
That’s why I’d suggest, until obvious macro trends emerge, to take the trends developing based on the last 24h of trading activity as the foundation to gauge the micro trends in currencies, which can be calculated with a 25-period Moving Average on the hourly to complement the granular trends (5-period MA) as shown below.
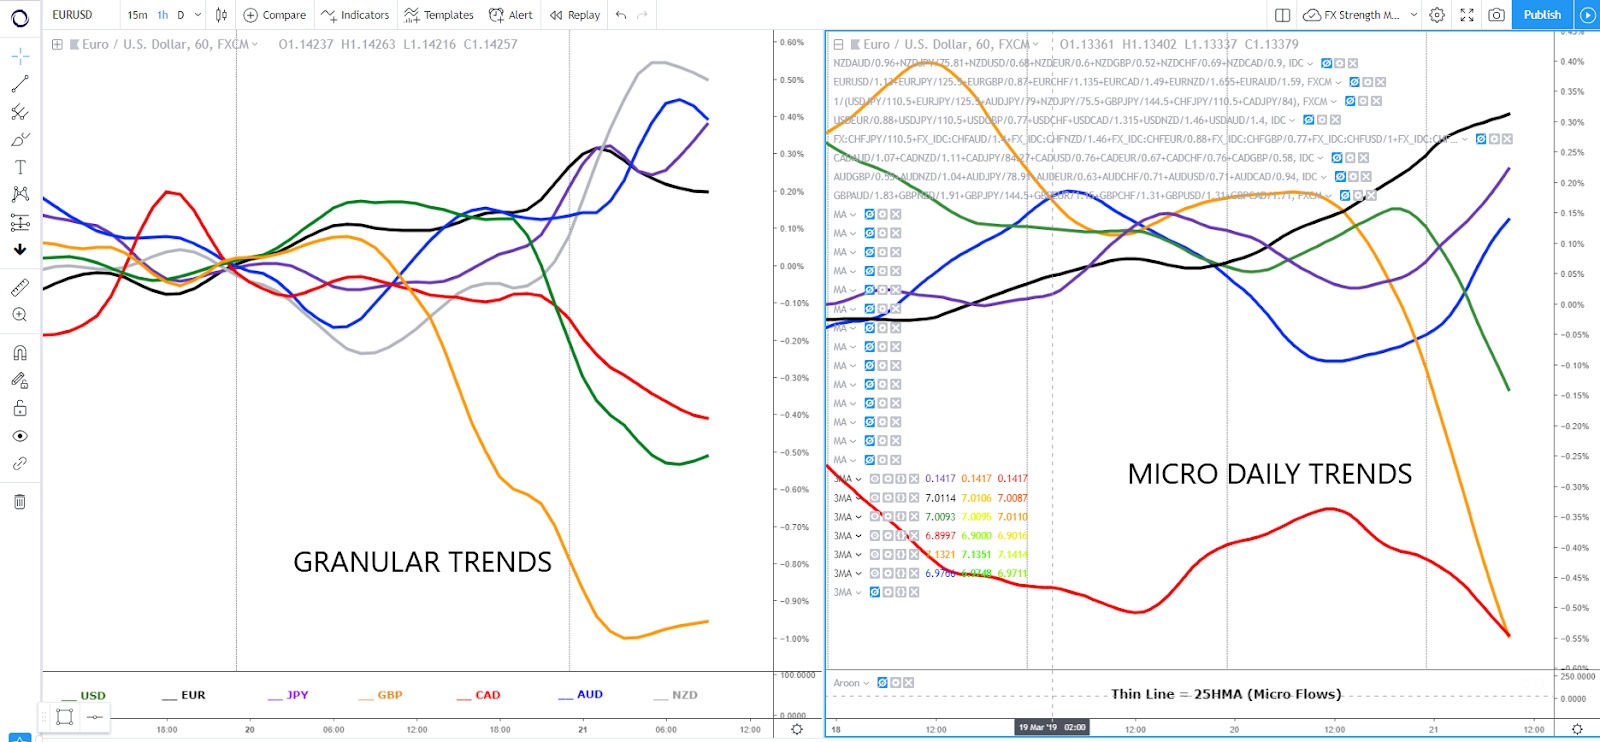
Depending on the timeframe that you trade, you should adjust the temporality of these currency indexes to best accommodate your needs. For instance, if you are trading off the hourly chart, look to enter at key decision points, aligning technicals in order to exploit the opportunities of the strongest currencies vs the weakest. If we were to take the above chart as a reference, judging by the slopes of the daily trends (right chart), one would think that looking for buy-side opportunities in the EUR, JPY, AUD against the GBP, USD and CAD would be the best combination of currencies to stay on the right side of the market flows. This is a principle that you can apply to trade currencies every single day, by constantly analyzing the strongest vs the weakest. You can then tap into the insights on the granular intraday trends to further exploit turnarounds in sentiment.
What’s highly recommendable is that you constantly monitor the turns of the slopes, that’s the best way to get a validation of the inflection points in which a currency has experienced a shift in flows. The longer the period Moving Average you use to smooth out the lines aiming for more regularity, the less proactive you can be to catch the early stages of a move, but the more certainty you will have that there is real meat in the bone in such turn of the slope. If you are an intraday trader using the 5m chart to trade, what you then want to do is to constantly monitor the granular trend in the currency index off the 5m timeframe to identify in almost real time the potential changes in currency flows. Prior to that, you should have defined what are the best currencies to pair with one another, and as I show above, I find no better way than go through a re-evaluation of trends based on the micro slope, which is derived from the movements in currencies in the last 24h of trading activity.
Wait For It, There Is More In-Store!
I had in mind to transition from just eye-balling and monitoring these charts manually to build a script via TradingView that makes calculations real-time (whenever the change in the Moving Average slope first occurs, and not when the bar/line closes), so that one can decide whether or not its a signal worth trading as part of a new trend emerging. Note, this script is not so much a signal-triggering indicator but rather a tool to constantly be on the lookout monitoring what currencies might start to develop trends.
Read on, as everything you need to know is explained in the following article "Identify Trends Via This FX Meter Script" A spoiler of what the script looks like below.
Be In Sync With Currency Flows
In this article, I took aim at demystifying the notion that just because the currency market may be going through a low volatile period, it doesn’t mean there is a shortage of opportunities. We just need to find a smarter way of monitoring the currency flows, which is what the currency strength meter does. You will now be in a position to monitor the overall strength or weakness of a currency, and most importantly, cross reference it against its most contrasting instrument in terms of performance. Follow the steps in this article, and you have no reason not to expose yourself to the best moves in the Forex market. It’s now up to you to exploit these ever-evolving flows in the currency market.
To learn more about the institutional / professional trading services provided by Global Prime, or to contact the firm, please click on the link below:
LiquidityFinder
LiquidityFinder was created to take the friction out of the process of sourcing Business to Business (B2B) liquidity; to become the central reference point for liquidity in OTC electronic markets, and the means to access them. Our mission is to provide streamlined modern solutions and share valuable insight and knowledge that benefit our users.
If you would like to contribute to our website or wish to contact us, please click here or you can email us directly at press@liquidityfinder.com.