
How To Diversify Your Crypto Portfolio

The Crypto Market Is Gaining Attention Again
28 May 2019, Ivan Delgado (Global Prime) - Even if the adoption of crypto-based technologies seems to be going at a snail's pace at a surface level, there are a lot of new developments going on in the background. We are in a unique era where the disruptive nature of the technology behind blockchain and cryptography, alongside the flurry of interest generated by institutions to start diversifying capital into such an innovative sector, is manifesting before our eyes in the perfect storm for this market to keep growing at an exponential pace.
But don’t take my word for it, if you are interested in all the constant advancements around the crypto space, subscribe to the following three newsletters and judge by yourself. The authors will keep you informed every week with insights that are easily digestible, relevant, and actionable:
- https://diar.co/
- https://tokeneconomy.co/
- https://proofofwork.news/
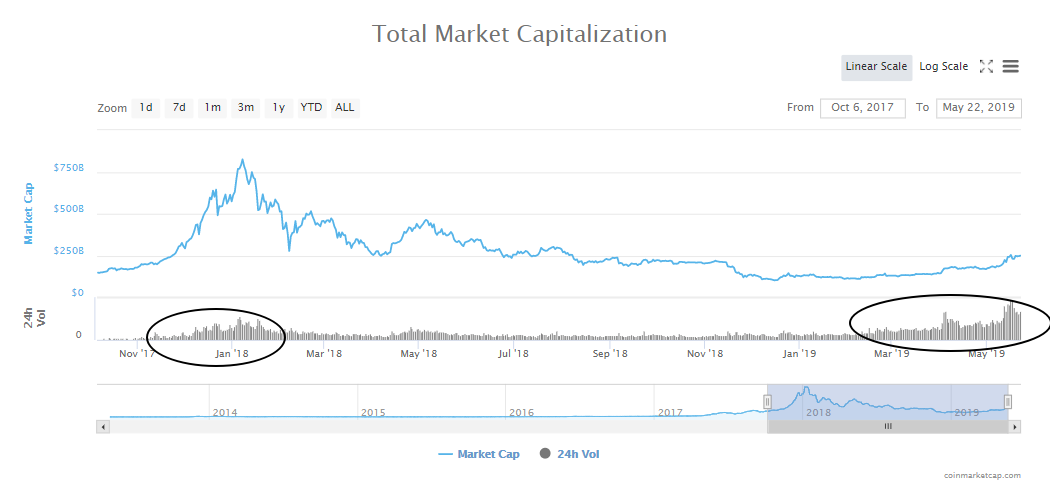
As we reach the equator of 2019, a new wave of committed crypto traders is making their way into cryptos. The volume traded in exchanges is skyrocketing, as the chart below, courtesy of www.coinmarketcap.com, vindicates. In fact, the volume transacted by all exchanges is now considerably higher than the interest seen in the last bull run of 2017.
For those concerned with www.coinmarketcap.com misrepresenting volumes due to wash trading on unregulated and under-regulated exchanges, remember that at this magnitude of volume change, it becomes much more difficult to exert market manipulation. But the overall perception is that volumes are indeed going through the roof.
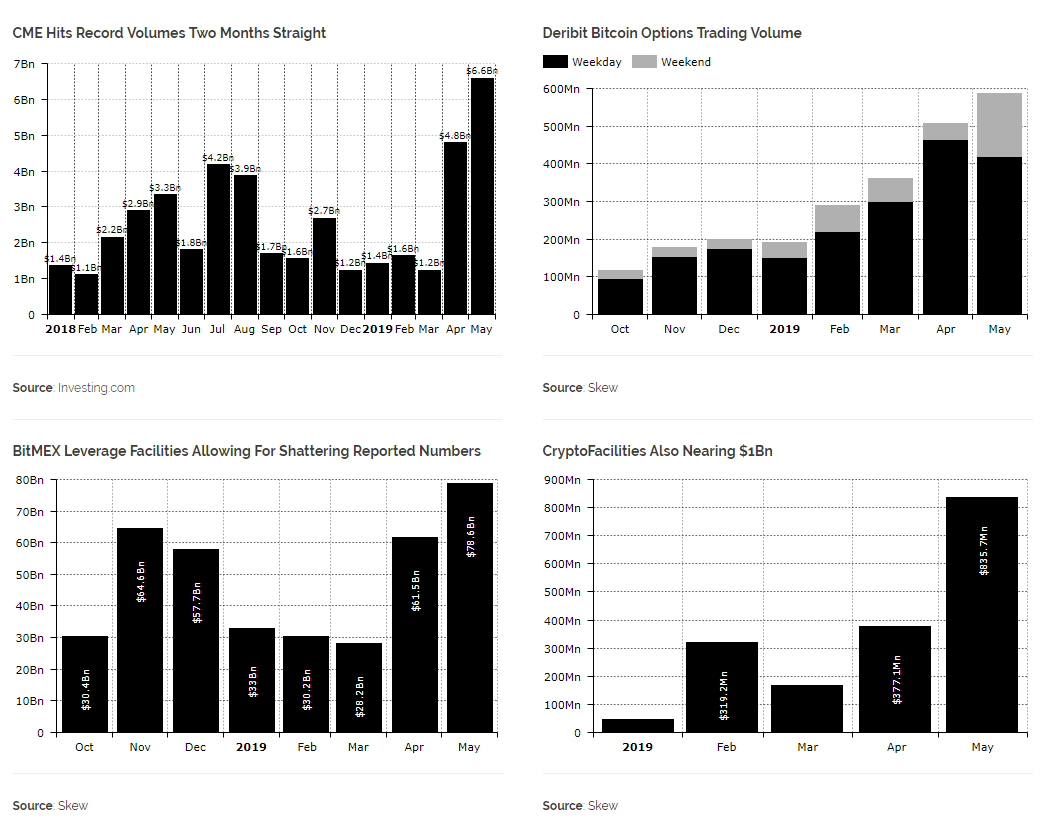
Not only that, but Bitcoin derivatives on CME, which still is the only regulated futures venue, as Diar notes, “has hit all-time-high two months running, while BitMEX is also enjoying much of the same due to recent volatility, alongside Deribit options finding a more institution-based audience.”
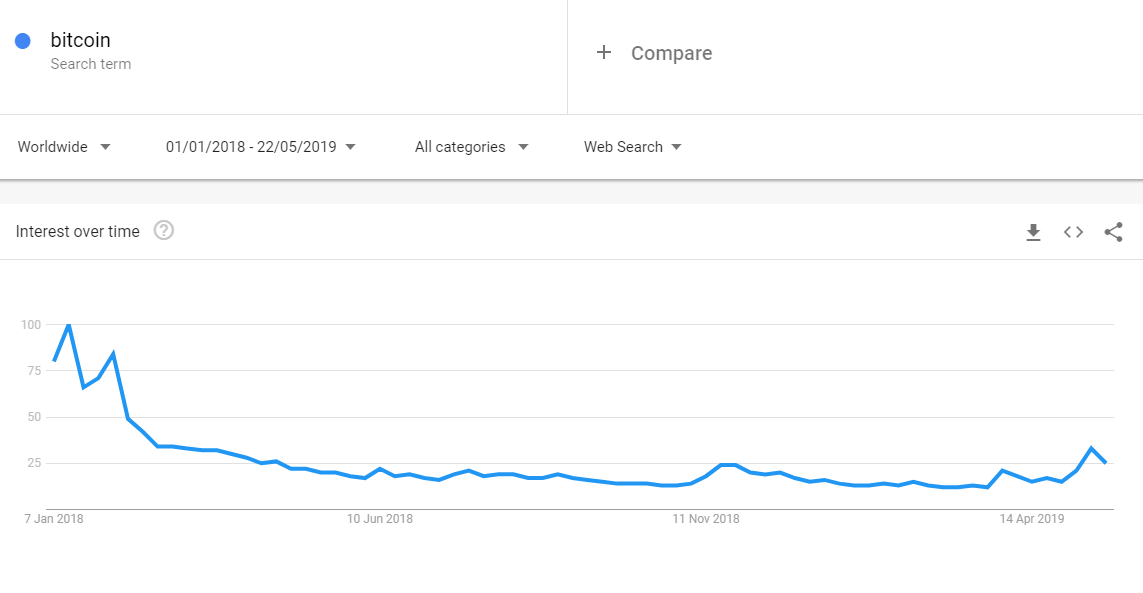
From a hype standpoint, we’ve re-taken fairly decent levels, with the interest as per Google searches matching levels not seen since the aftermath of the 2018 BTC collapse. In a way, it’s encouraging to see BTC/USD nearing 10k, yet the buzz is comparatively still massively suppressed compared to the insane levels from the last bullish run, a time when a larger share of average Joes was investing. It means that the rise in BTC so far is not being fueled by mass scale euphoria, far from it.
The Building Blocks To Trade Cryptos
The foundation to trade cryptos starts by understanding a few concepts very unique to this market. As a part of one’s total portfolio, it comes down to consistently balancing out your exposure amongst three different assets. Period.
Firstly, one can have exposure to BTC. The second option is to have an allocation in ALTS, which refers to the rest of cryptos excluding BTC. Lastly, one can liquidate positions (BTC or ALTS) and go cash via USD stablecoins, which include USDT, USDC, and a few others, even if we will use USDT as the default choice due to its liquidity.
As one breaks down a portfolio composition, it’s helpful to think about it as a pie, divided into pieces of varying sizes aimed at maximizing your risk-return allocation. As an example, below I illustrate a fictitious portfolio that is invested 80% in ALTS, 20% in BTC, with 0% exposure in USD.
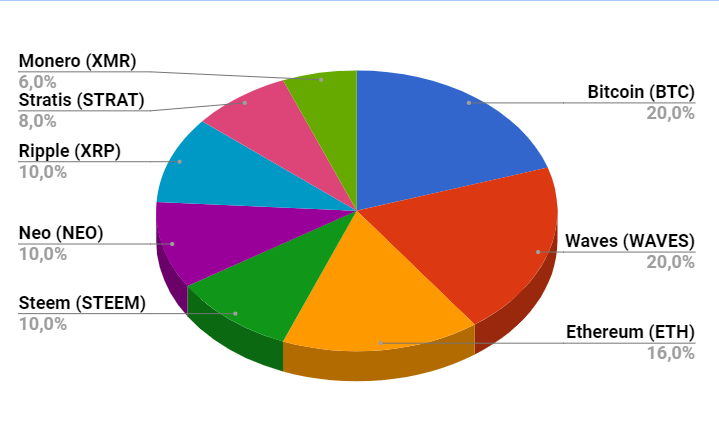
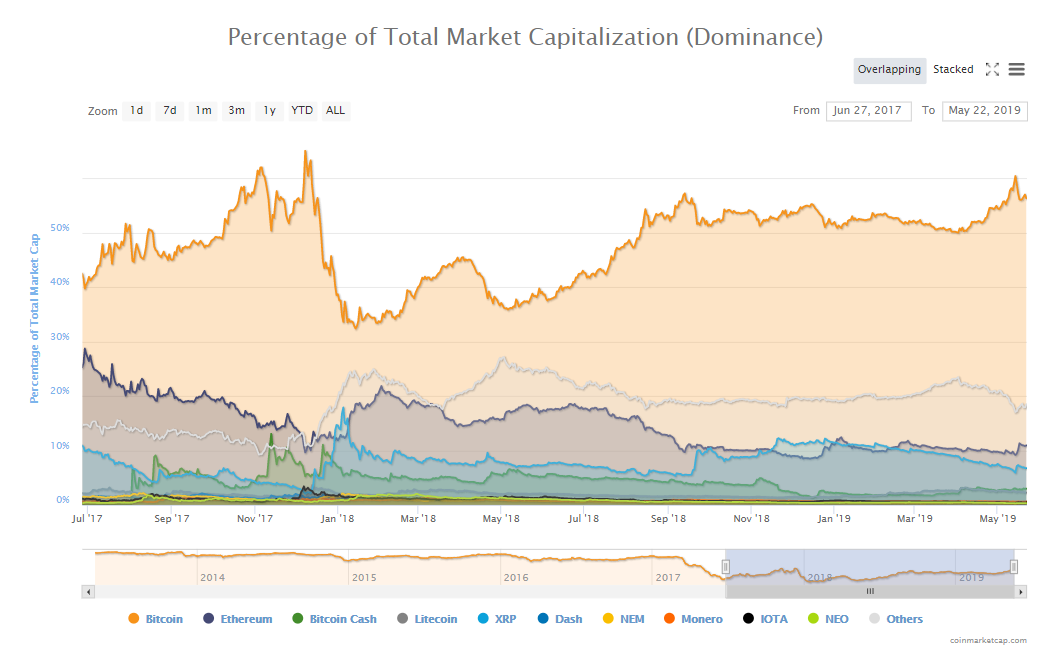
If the above scenario transpires, the result is what we call a BTC dominance on the rise. We have factions of the market, often referred in crypto as tribalism behavior, that believes bitcoin’s dominance, due to its highly liquid conditions, will keep growing from the current 55-60% into the 85-90%. What this would mean is that out of the total market capitalization, BTC would essentially amass 85-90% of all the investment made into cryptos. And let’s face it, if you adjust the dominance rate for liquidity by removing the tokens that are totally illiquid that might have artificially inflated their market cap, then we could possibly be already in a 65-70% dominance for bitcoin.
No question BTC is the preferred crypto to be diversified into as the dominance percentage vindicates. After all, it’s unambiguously perceived as the King of cryptos due to its first mover advantage and the network effect it enjoys. As an analogy, BTC is perceived as the reserve currency of cryptos, similar to the role the USD exerts in traditional forex.
So, back to bitcoin dominance, it can be found via https://coinmarketcap.com/charts/ . It shows the percentage capitalization of bitcoin relative to the entire cryptocurrency pie. If the BTC dominance increases at a time when the overall crypto market cap jumps, as seen most notably since early May ‘19, we are in a ‘BTC season’, and what you want is to be invested in BTC as much as possible.
Lastly, just as in the case of traditional forex markets we use the term ‘risk off-season’, which refers to risk aversion, when financial conditions tighten, manifested primarily by the selling of stocks and the buying of bonds, an analogous representation of ‘risk off’ in the crypto market would be when the total market cap is reduced, with both the price of BTC/USDT and ALTS/USDT losing value.
This was the case during the infamous collapse in crypto valuation from the BTC/USDT peak of 20k or after the capitulation-type event in BTC/USDT when we broke the 6k support mark last year. As an investor, you need to be sharp and nimble to adapt to the technical chart evidence by diversifying into USDT in order to preserve your hard-earned capital under these dynamics. If you don’t act, you can be exposed to a substantial loss in your total PnL in USD-denominated terms.
This last point leads me to another critical concept. Whenever you trade cryptos, from experience, and by simply applying common sense, you want to monitor the value of your account and crosscheck your performance over time in how much wealth creation you’ve managed to achieve in USD terms vs BTC terms. It doesn’t mean you want to sit on USDT if you are not in active trades, as that will depend on what type of season we are in. In a BTC season, you are better off not undermining your capital preservation by staying exposed to BTC as the default asset, with USDT in times of risk-off.
We still live in a world where fiat currency is the dominant form of value exchange so don’t be elusive thinking that BTC should be what your account performance should be based upon until the day when the penetration and adoption of BTC justify such paradigm shift. I’d personally suggest being sensible and always pay attention to how much in fiat-currency terms your account grows. In the crypto community, many will challenge this point of view, arguing that BTC has made enough merits to be used as the default asset to evaluate one’s total results, but I am afraid I can’t buy into this view.
Further, you probably are aware that there are thousands of ALTS out there. It can be a daunting task to make a proper distinction between the projects worth investing in vs those in for a quick buck without the technology, the purpose or the team backing them up. Make no mistake, those projects with strong fundamentals will be best positioned to thrive and appreciate in valuation. This is why you must apply certain discretion to do your own research in order to assess what ALT projects you favor.
As a rule of thumb, with the exception of crypto projects with inflated market capitalizations due to artificial supply circulation and/or coins that make it high in the ranks after an orchestrated pump scheme, if an ALT has made it into the top 200-300, there is a high chance that the project is a robust one supported by strong fundamentals and not just aiming to scam or with dubious purpose. Before trading a cryptocurrency, you should gather basic information: Who is leading the project? What problem are they trying to solve and what industry does the project target?
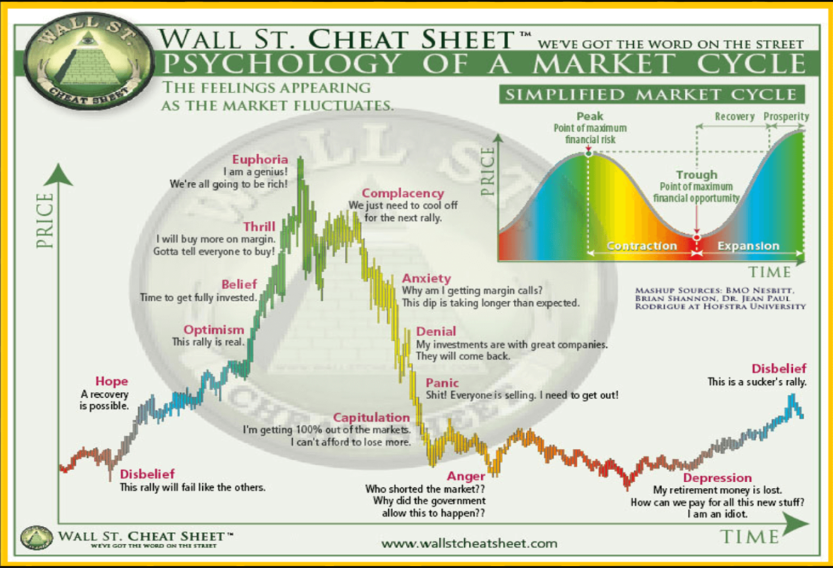
Last but not least, it’s cardinal that one understands the psychology of markets, especially in such a nascent and retail-driven market, with human emotions playing a huge role in finding opportunities.
How To Determine Your Crypto Allocation
Ok, so now that this initial background information is out of the way, let’s dive right into how, as a crypto trader, you can find a way to determine, at every stage, your allocations into BTC, ALTS, USDT.
First of all, we want to understand what type of environment we are in. To determine the current dynamics in the crypto space, we will monitor a series of markets via TradingView as seen below.* These charts will comprise the backbone of the model we can use to align the context with our trading positions.
*The indicators employed in each chart will include the 25-period WMA applied to the OBV (derived from volumes), and the 55 & 80 Hull MA applied to price action. This setup allows achieving an objective, highly adaptive, and lag-limited approach to the ever-evolving market dynamics. I encourage you to experiment and backtest by yourself these indicators, fine-tuning as you see fit.
1 - BTC/USDT = By analyzing the king of cryptos (BTC) vs the USDT, we will be able to partially determine if we are in a BTC or USDT season conditioned to the strategy (more on this later). This definition will not be conclusive, as we still need to cross check additional charts to determine what season we are in. The exchange to use in TradingView will be Binance.
2 - ETH/USDT = By analyzing the king of ALTS (ETH) vs the USDT, we will be able to determine if we are in an ALTS or USDT season depending on the strategy (more on this later). This definition will not be conclusive, as we still need to cross check additional charts to determine the season we are in. The exchange to use in TradingView will be Binance.
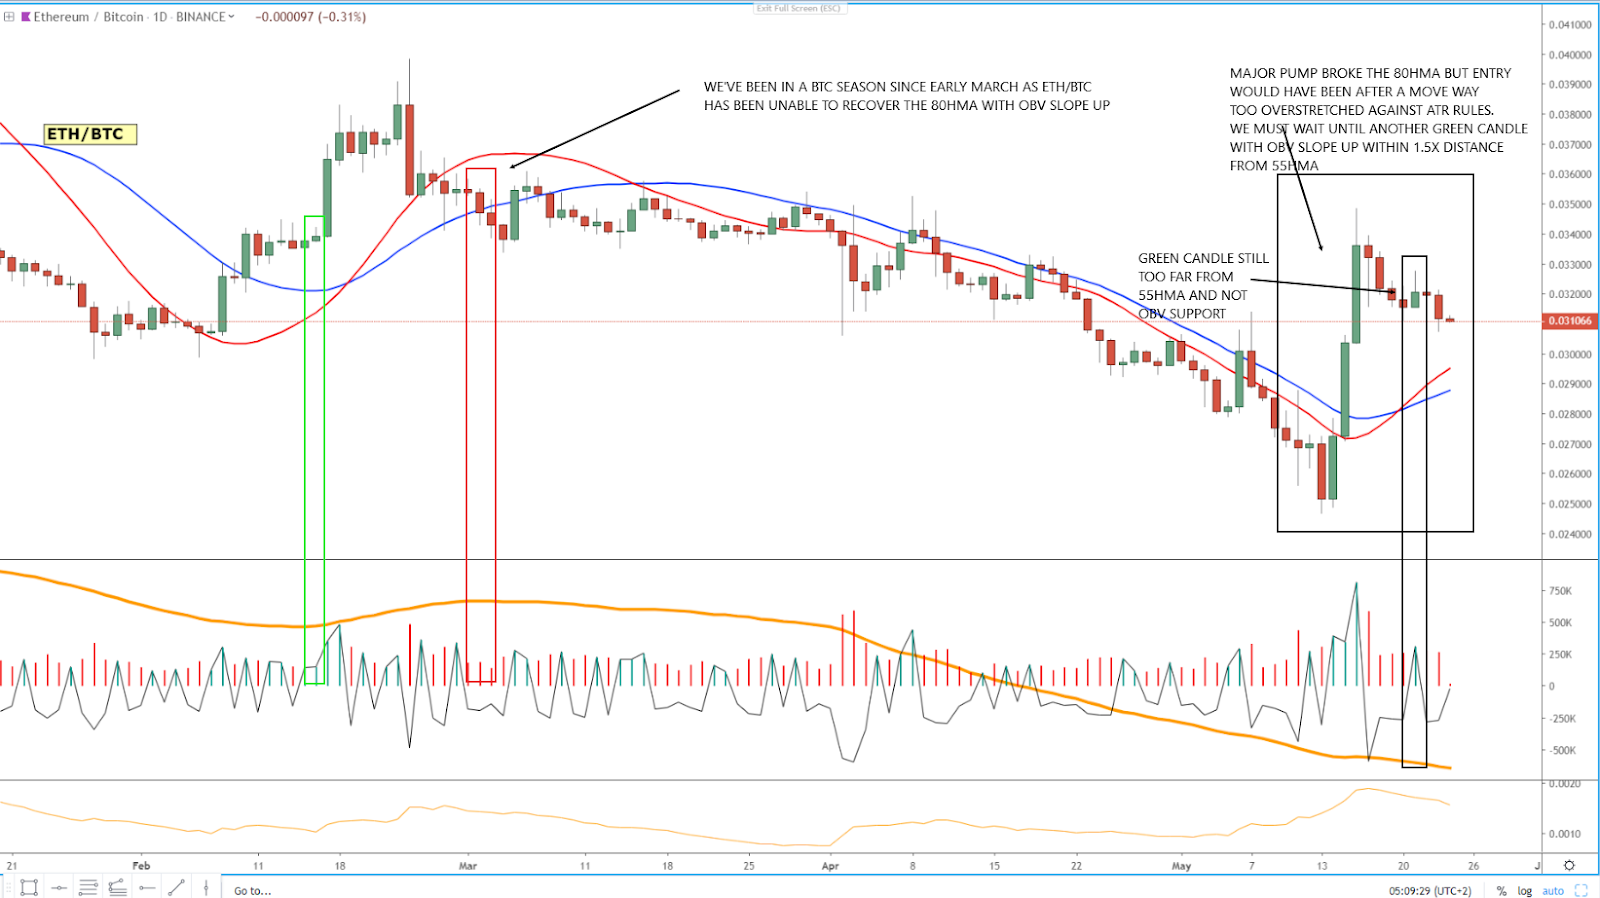
3 - ETH/BTC = Only when we analyze this third chart, we can start to tentatively define the season. So, if BTC/USDT is bullish, but it turns out that ETH/USDT is also bullish, this market will help us to determine the season. On the contrary, if both BTC/USDT and ETH/USDT display bearish tendencies, the market is in a clear USDT or ‘risk off’ season, so cross-checking this third chart will be of little use as we want to be primarily in cash. The exchange to use in TradingView will be Binance.
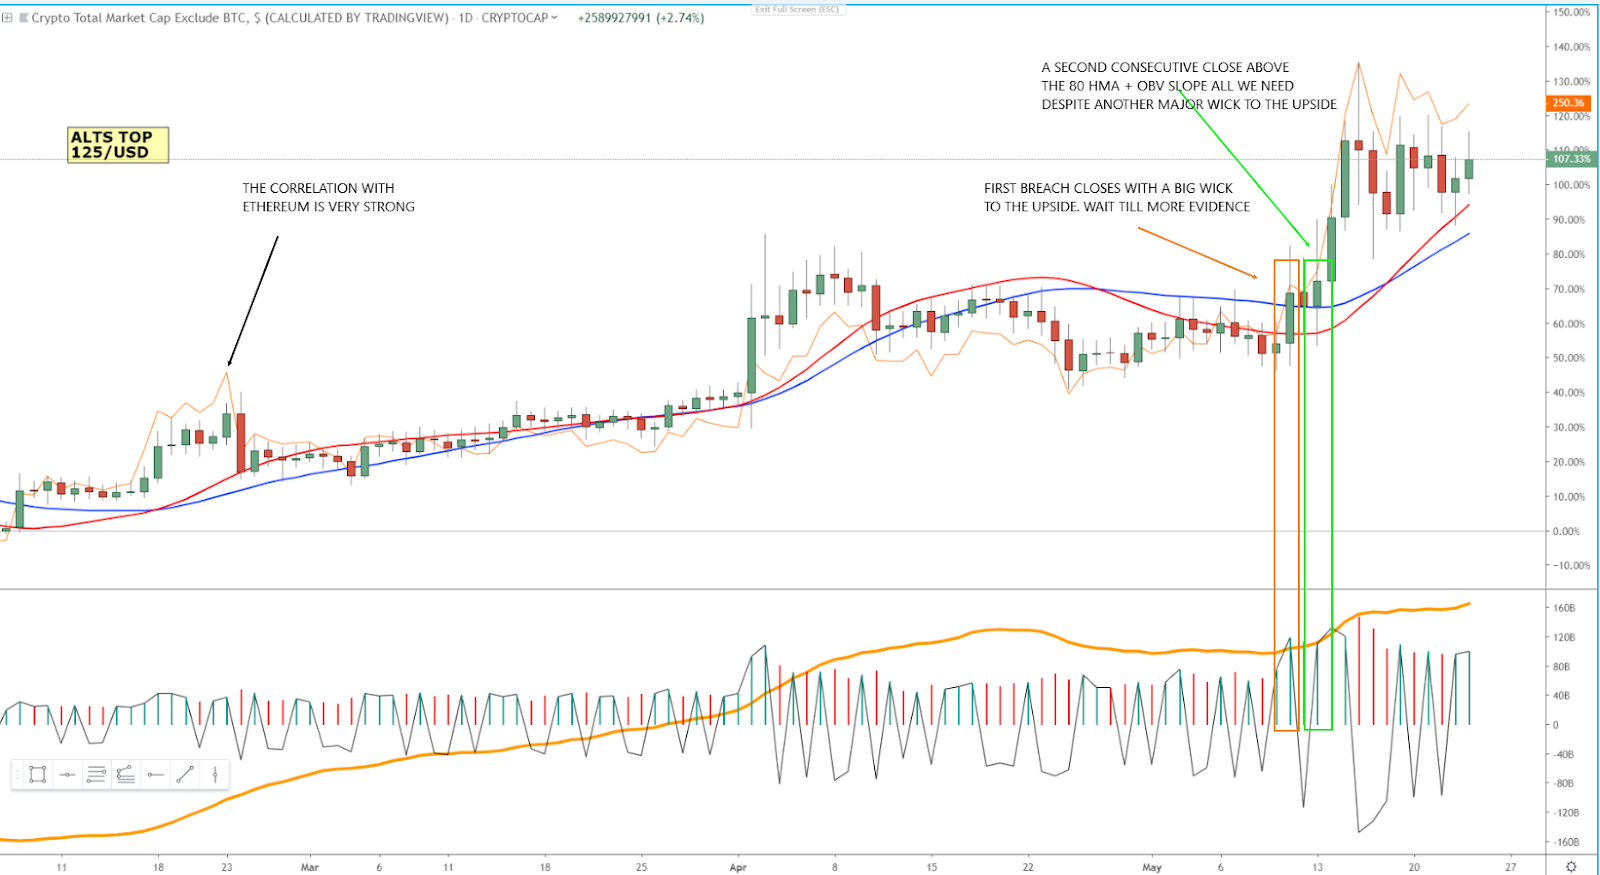
4 - ALTS TOP 125 by Market Cap vs USDT = In case we conclude that we are in an ALTS season, the formula TOTAL2 in TradingView is used as a filter to reinforce the ALTS bias based on the analysis of the top 125 ALTS by market cap against the price of USDT. If the technical studies in this particular chart don’t agree with the ETH/USDT chart, it means that rather than being in an environment dominated by the thriving of ALTS as a whole, it is simply led by an individual movement in ETH due to fundamentals or a sudden pump for instance. Note, ETH and top 125 ALTS tend to be strongly correlated, so this is a low probability event if historical patterns serve as an indication.
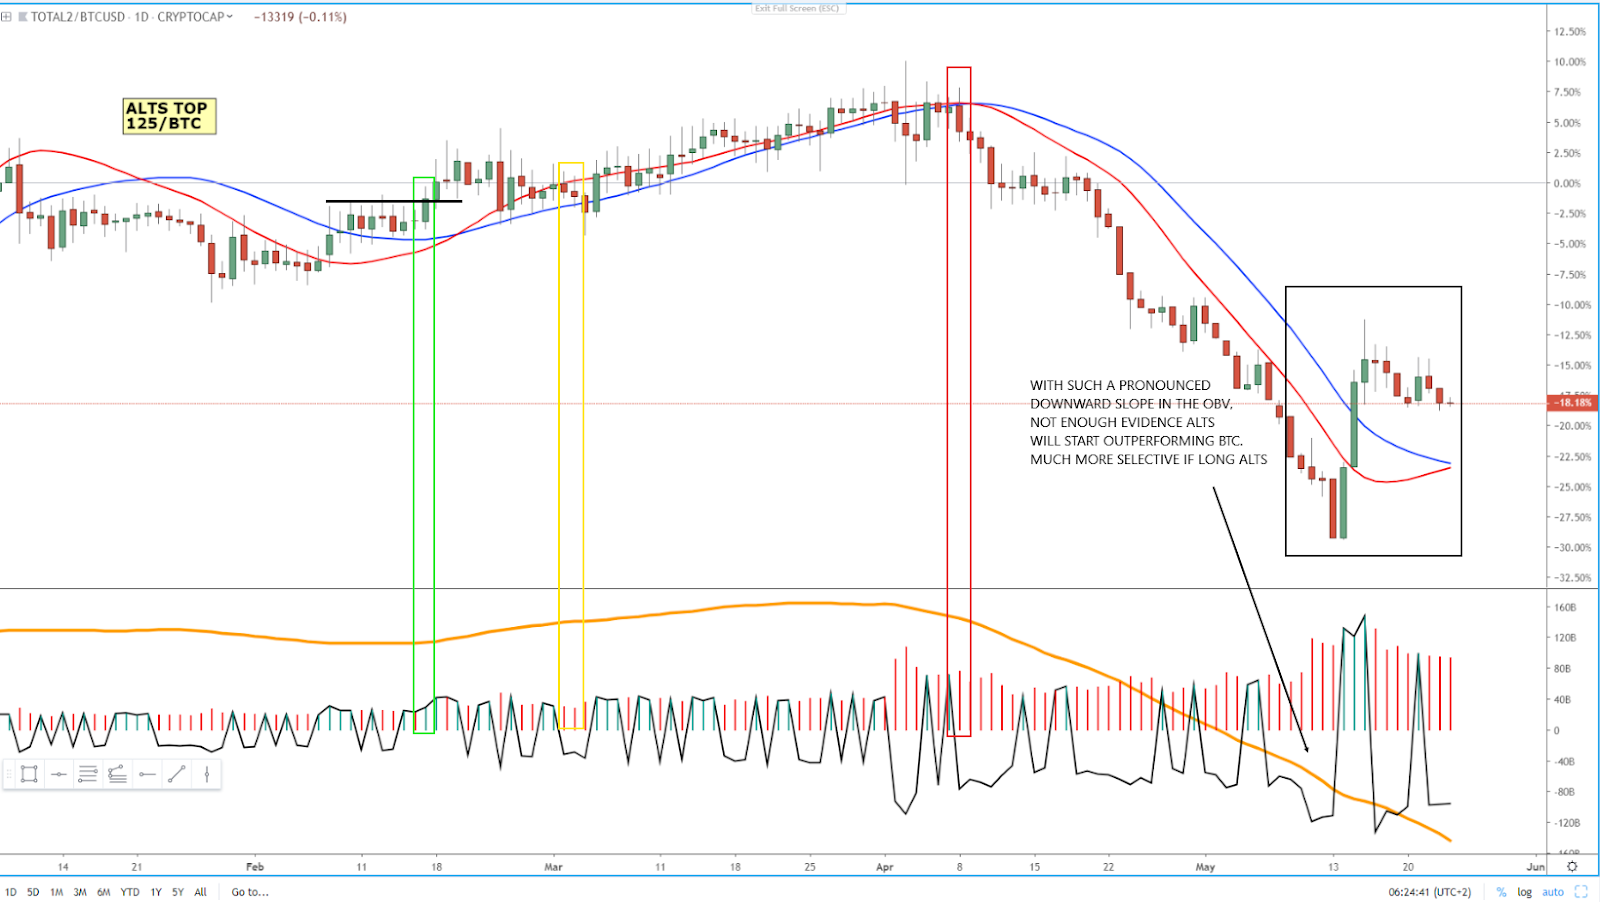
5 - ALTS TOP 125 by Market Cap vs BTC = The formula TOTAL2/BTCUSD is used as a filter to reinforce the ALTS bias. If the technical studies in this particular chart fail to agree with the bullish conclusion reached by studying the ETH/BTC chart, which led us to believe we were in an ALTS season, it means that rather than being in an environment dominated by the thriving of ALTS as a whole, it is simply led by an individual movement in ETH. Note, ETH and top 125 ALTS tend to be strongly correlated, so this is a low probability event if historical patterns serve as an indication.
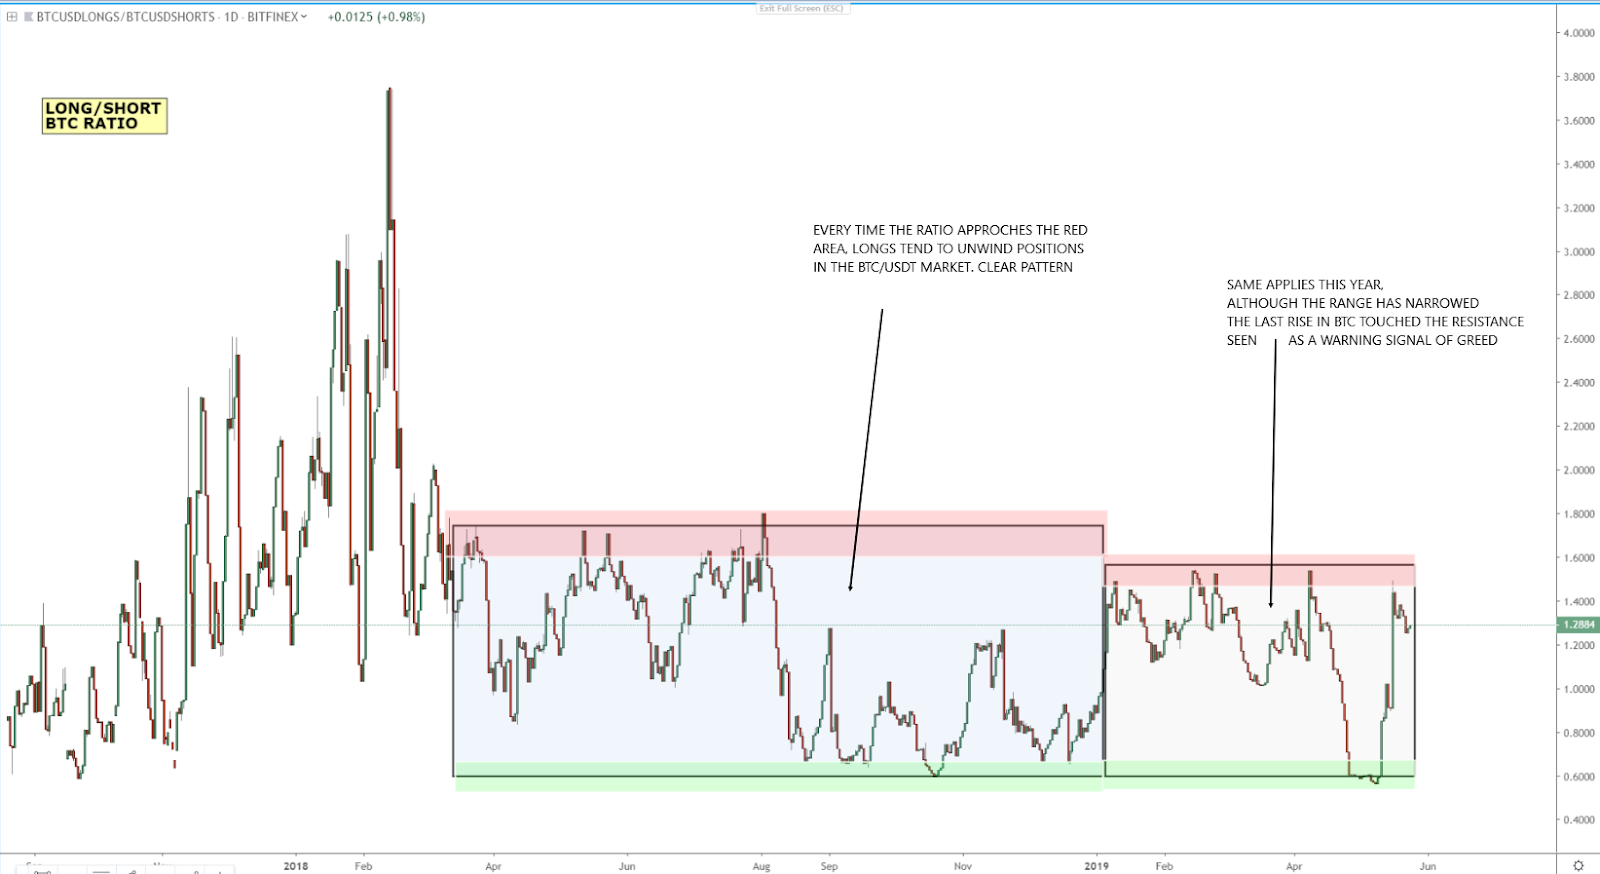
6 - Long/Short BTC Ratio = As part of the model to evaluate the state of affairs in the crypto space, we will need to keep an eye on the ratio of long-held vs short-held positions in BTC, a data that we can obtain via the formula BTCUSDLONGS/BTCUSDSHORTS in TradingView. What this reveals is potential climactic periods when the market is overly committed to one side or the other. The higher the long vs short ratio is, the more cautious one needs to be in adding BTC longs. Again, more on this later.
7 - ALTS Bull Market Percentage (Priced in BTC) = This is an indicator developed by TurtleBC called BMP, which stands for Buy Market Percentage (BMP). It calculates technical studies to show the percentage of altcoins vs BTC in ‘buy’ territory from a daily perspective. It’s a great tool to use as a gauge of the level of fear (when BMP is low) and greed (when BMP is high). Note, there is an alternative BMP (Priced in BTC) developed by @whocrypto. It follows the same principles but it’s more reactive.
8 - ALTS Bull Market Percentage (Priced in USD) = This is an indicator developed by TurtleBC called BMP, which stands for Buy Market Percentage (BMP). It calculates technical studies to show the percentage of altcoins vs USDT in ‘buy’ territory from a daily perspective. It’s a great tool to use as a gauge of the level of fear (when BMP is low) and greed (when BMP is high).
There you have it, I just laid out the 8 components of the model we need to monitor on a daily basis. The right interpretation will facilitate a daily understanding of the market context, which is essential to make the crypto allocation decisions as part of our portfolio.
How The Strategy Works
But first things first, what rules are we going to employ in the TradingView charts as part of the model? Remember, the indicators employed in each chart include the 25-period WMA applied to the OBV (derived from volumes), and the 55 & 80 Hull MA applied to price action. It’s a hybrid approach based on my own rationale (volume-based) with the backing of two moving averages.
Let me first touch on the two moving averages we will apply, which include the 55 and 80 HMA. This is an adaptation of a concept where the credit must be given to Ismail Tarim, who I’ve followed for some time, and who defines himself on Twitter as a full-time swing trader, and programming enthusiast.
In a nutshell, on the daily timeframe, if the price closes convincingly above the HMA 80, this will be our entry point, while if price closes convincingly below the HMA 55, it will determine our optimal exit point. By convincingly, I mean that the close must have clearly penetrated the HMA80/55.
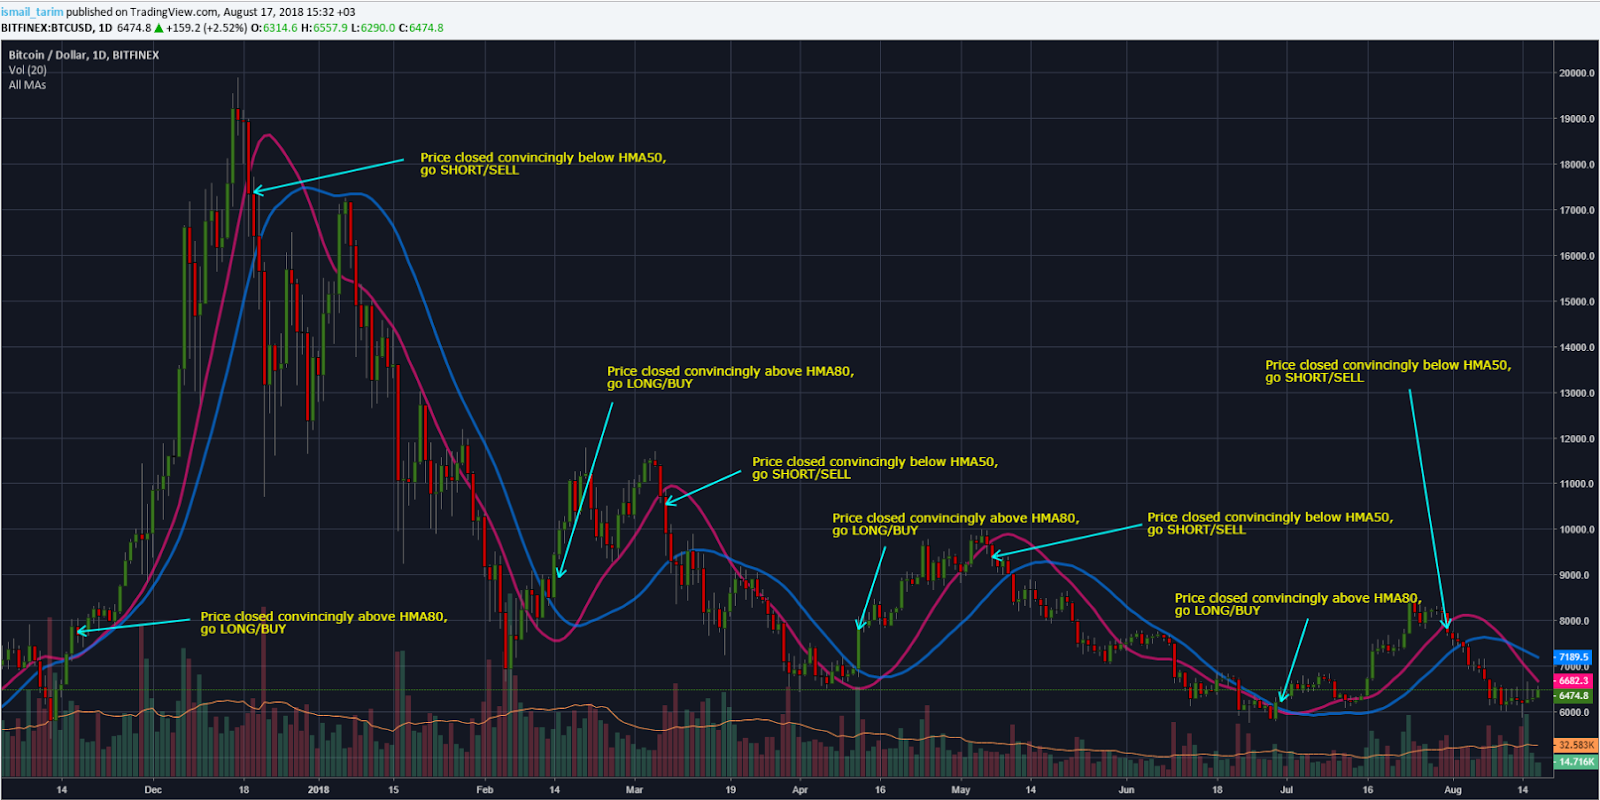
To avoid paying up after an overextended move, if the entry to go long occurs with a separation between the HMA 80 and the price beyond 1 time the daily average range, patience is warranted until we have a retracement towards the 1 ATR separation from the 80HMA for up to 3 candles or the conditions are met again. The same rule applies when looking to go short with some discretion.
To avoid fakeouts, if the entry above the HMA80 occurs before the HMA comes down towards the price, in other words, if the breach occurs from a price rally far below, it tends to result in rejections.
The second vital piece of the puzzle to complement the directional bias is the degree in which buyers/sellers are committed via trading volumes. Remember, volume precedes price. The metric we use to measure the commitment by the market to endorse a particular direction is what’s called the OBV (On Balance Volume). The On-Balance Volume provides a cumulative total of volume in a crypto asset and indicates whether volume is flowing in or out. It’s a great gauge of market intentions.
The process to add the indicator into the chart, firstly, is to call the ‘OBV’ function in TradingView, followed by applying the 25-period WMA indicator to the OBV on the daily chart. What we are able to achieve by adding the OBV on top of the Hull MA studies is a second filter to avoid fake-outs when the price gives us a buy signal which is not being supported by the accumulation of volume via the right slope in the OBV. Also, if you wonder why the 25-period, it is the optimal average I’ve come up with to gauge the commitment of the market taking into account over 1 month worth of volume transactions.
So, for the trigger to go long, we shall wait for both conditions to agree, the price closing above the 80HMA and the 25-period OBV slope pointing higher. For the short entry, both conditions must agree, the price closing below the 55HMA and the 25-period OBV slope pointing lower.
In a nutshell, that’s the core of the strategy. Let’s now dive into the model to make an objective judgment of market conditions and how we can potentially be positioned.
Practical Examples On Current Market Conditions
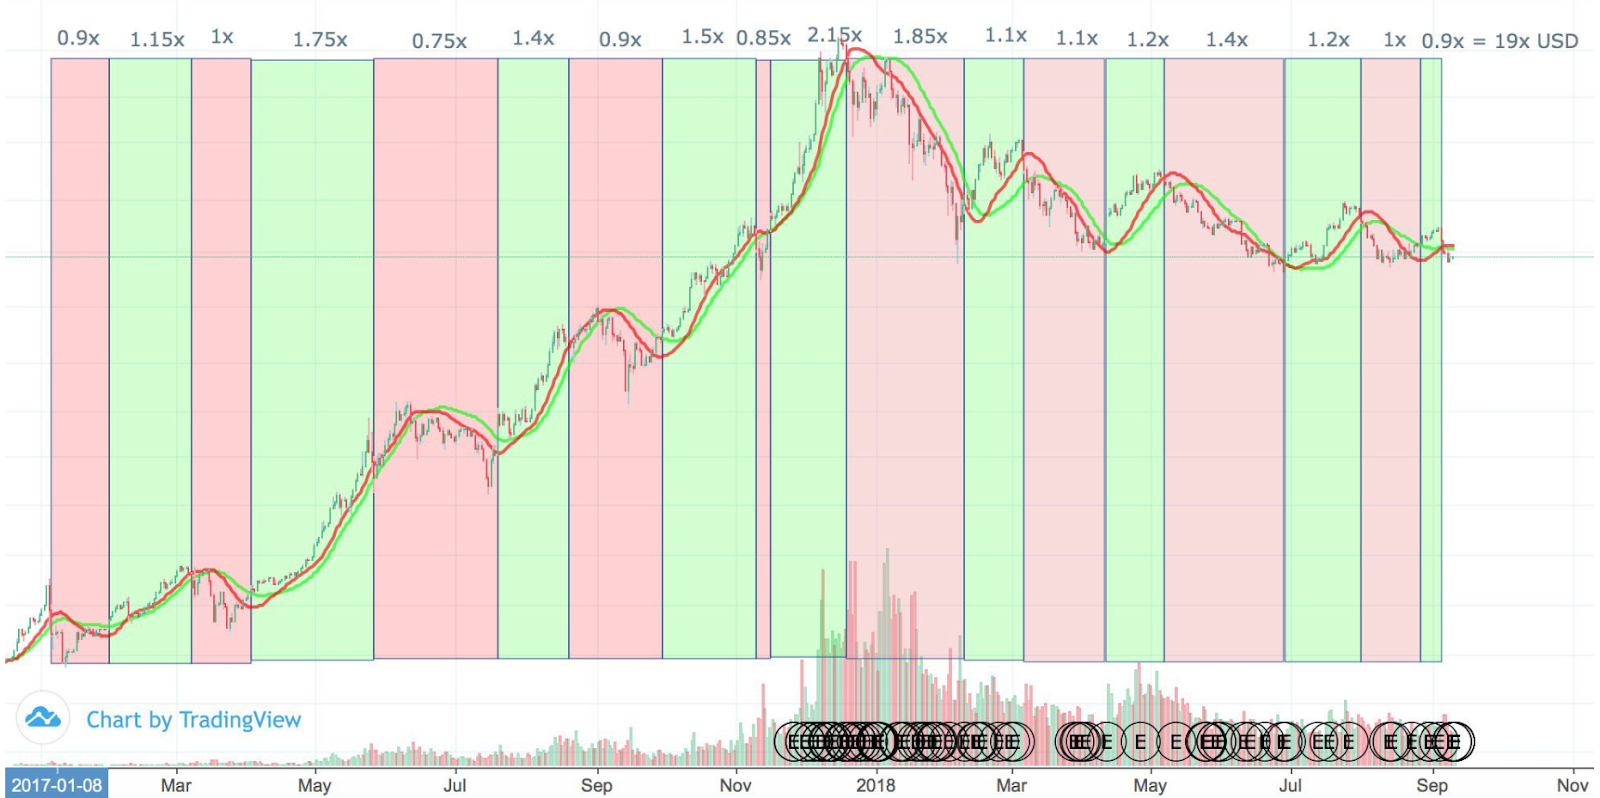
Let’s start looking at BTC/USDT. We are currently in a bullish phase in BTC/USDT via Binance as the last green rectangle depicts, which is the most recent entry when price recovered the 80-period HMA with OBV 25-WMA slope bullish. In the chart below, there is only one instance, from Jan to Feb ‘19, when the market was bearish. The yellow boxes represent periods in which based on the HMA strategy, the end of the bullish cycle in BTC/USDT was expected, but since the OBV 25-WMA was still showing a bullish slope, that would cancel the bearish view. Bottom line: BTC/USDT, until further evidence, remains in a bullish phase, which leads us to think we might be in a BTC season.
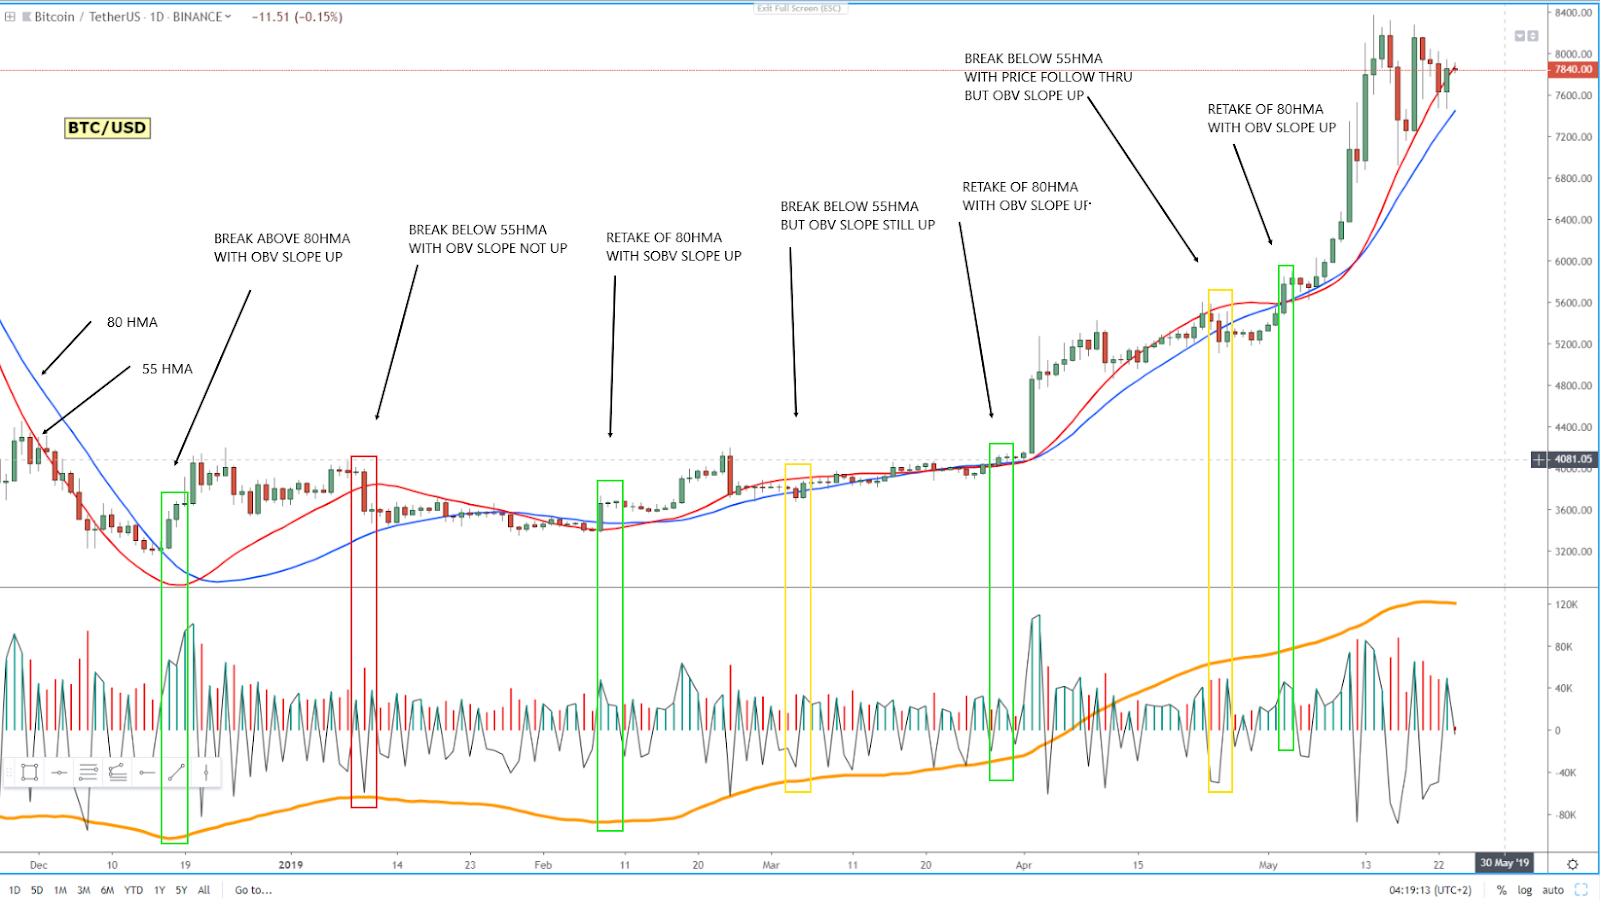
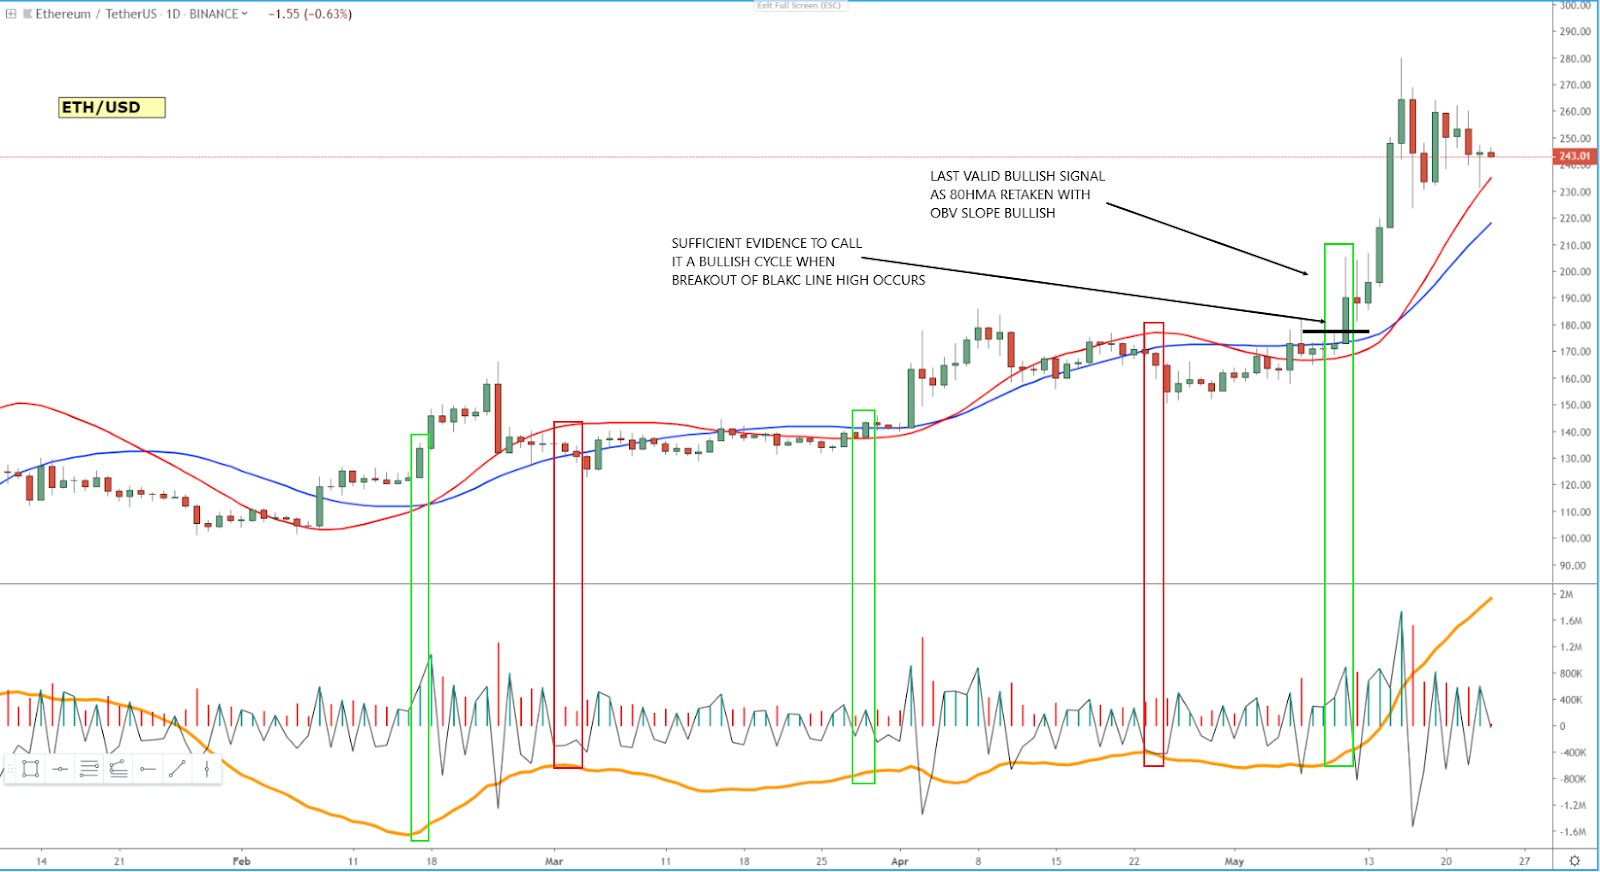
As the chart below shows, we’ve been in a BTC season ever since the beginning of March, despite strong evidence exists that the tide is turning in favor of ALTS after the recent monstrous ETH rally. The price has clearly surpassed the 80 HMA but volume accumulation is still skewed to the downside, which is why we can not yet proclaim a transition into an ALTS season.
Let’s now look into the rest of the charts that comprise the model. The first one, even if we won’t necessarily act upon it, it’s definitely another useful gauge of the fear vs greed in humans. The chart looks at the ratio of outstanding BTC longs vs outstanding BTC shorts held at Bitfinex, and can act as an early warning signal that the BTC/USDT market is heating up with excessive greed or fear.
Let’s keep exploring additional charts as part of the model. This next one in particular, in my opinion, reveals the greatest clues in terms of how much value exists if one decides to start, on a discretionary basis (more on this later), diversifying into ALTS. I am referring to the Bull Market Percentage (Priced in BTC) - BMP - , which provides an estimate of the share of altcoins vs Bitcoin with bullish technicals, calculated based on conventional indicators, from a daily perspective.
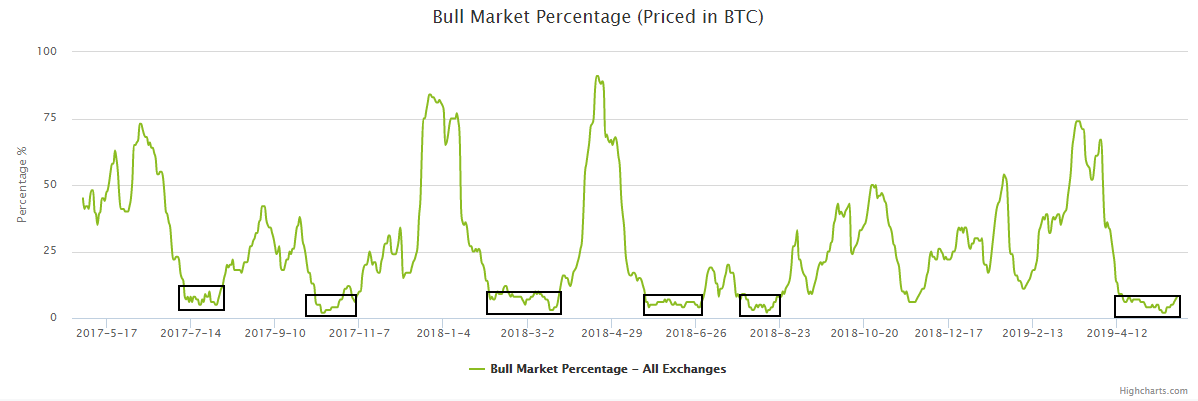
An important observation to be aware of during this phase must be stated. As the black boxes drawn in the chart reveal, it takes about a month on average for the accumulation to complete before ALTS start to outperform BTC. Guess what? The current accumulation box has been going on below 10-15% for more than a month, just as ETH/BTC and TOP 125 ALTS/BTC have broken above the 80 HMA, with volume accumulation the very last straw before we have all the evidence needed.
Again, does this mean we have to stay away from diversifying into ALTS? The answer is ‘No’ as there is evidence to start buying ALTS, but we must be very selective in picking the right markets. Remember, the TOP 125 ALTS/BTC still shows a volume accumulation highly skewed to the downside based on the 25-period OBV slope, which is a great gauge to determine the overall commitment. What this means is that the conditions are not yet ideal to buy ALTS but BMP argues otherwise.
It’s all about the preponderance of evidence, which is why with the break above the 80 HMA in ALTS/BTC & ETH/BTC and BMP (priced in BTC) below 10-15%, it argues for the accumulation of ALTS in one’s portfolio on an ad-hoc basis, with an even more aggressive stance once we can finally see both conditions met (HMA + OBV) in the ETH/BTC and ALTS/BTC.
Actually, once we can have this last piece of evidence via volumes, that’s the time when if a crypto project you really believe in is yet to be pumped, you could be more flexible by entering at cheap prices if you believe that the fundamentals are sound. I personally wouldn’t encourage this approach, which I consider to be ‘aggressive’ in nature, unless you hold a high degree of conviction. I’ve personally added a few ALTS in the past through this approach as I found them to be a bargain.
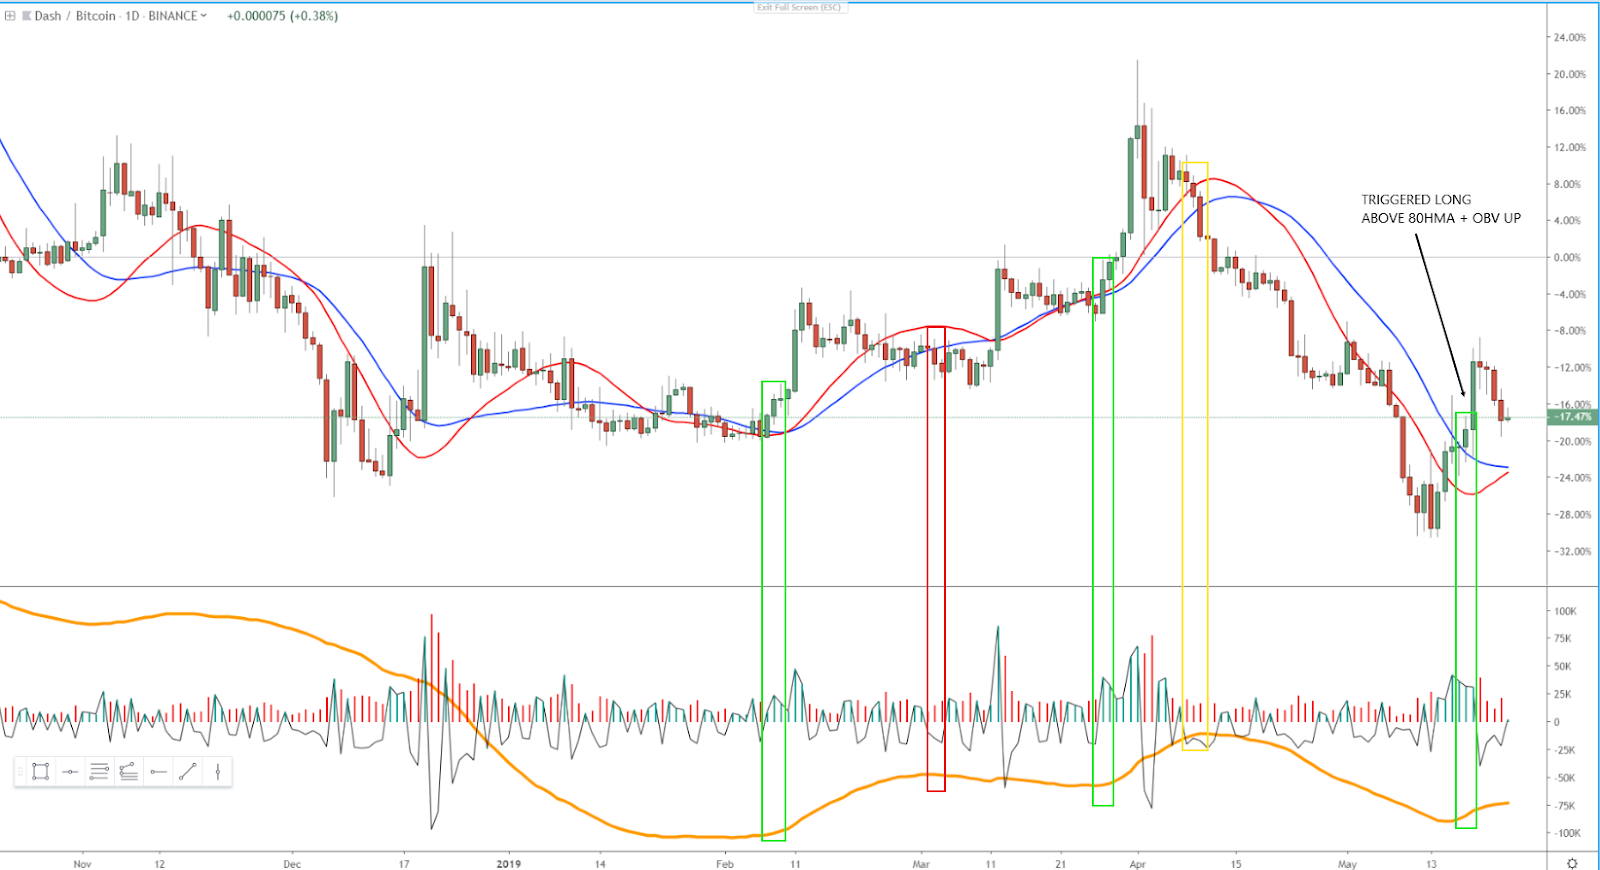
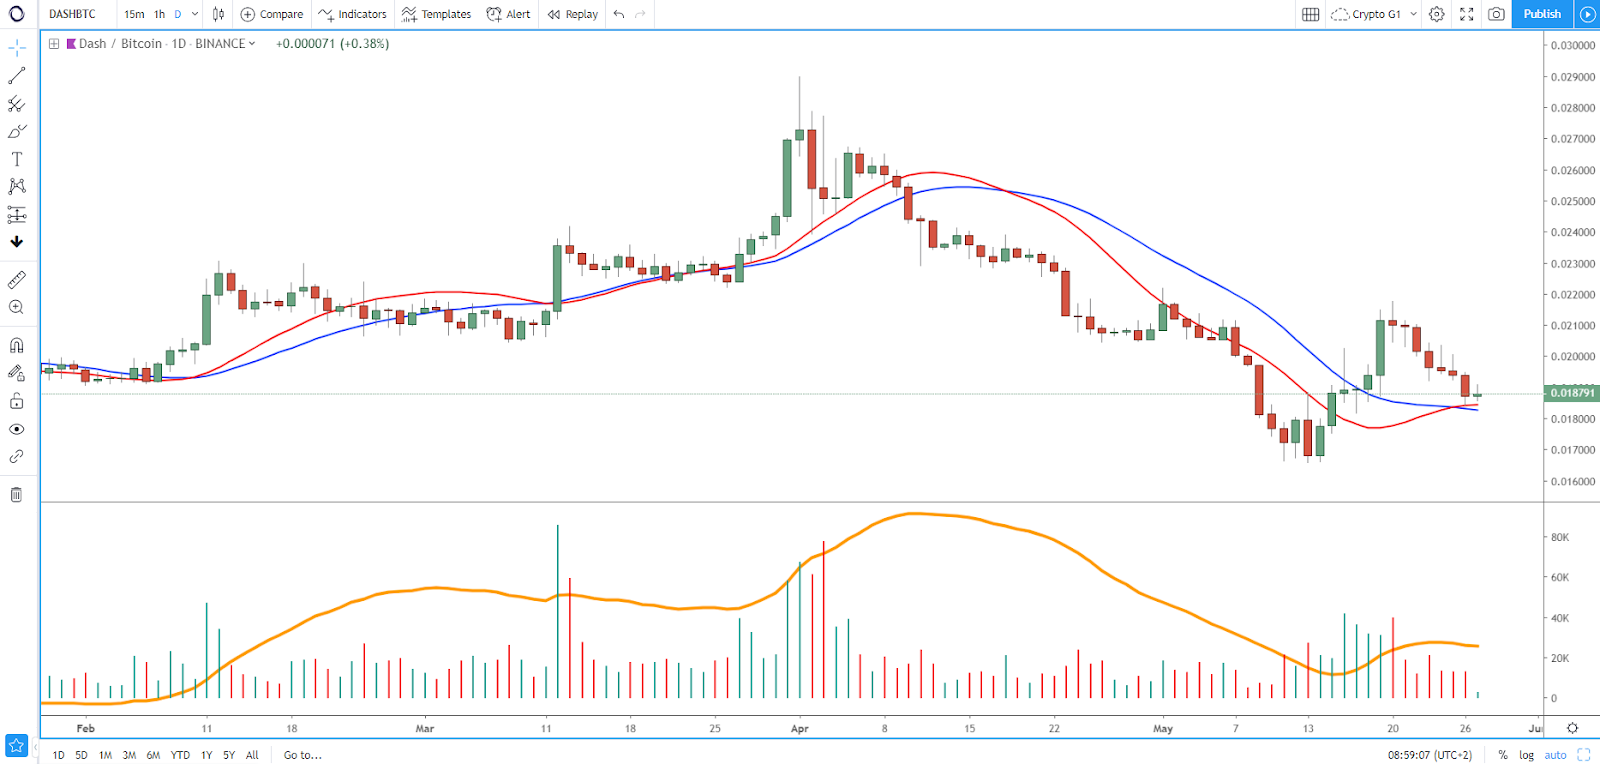
Back to the concept of selective diversification into ALTS based on the current evidence found. An example of preempting a long in ALTS was DASH/BTC, which started to front run most ALTS/BTC by meeting all the pre-qualifiers. These include, it is a project I have a fundamentally strong view about it, it broke the 80 HMA, alongside the OBV slope turning higher. Some of your hard-earned BTC can start to find a better shelter in these ALTS, but remember only on an individual merit basis, and when sufficient evidence, based on your risk profile, suggests the context is ripe for it.
○ The higher the ALT Bull Market Percentage (Priced in BTC) - BMP - goes, the less optimal the risk-reward will be. The most bang for your BTC in ALTS is achieved under 10-15% BMP. ○ If the ALT Bull Market Percentage (Priced in USD) is above 75%, one has to be extra careful as the buying may be happening at a time when ALTS vs USDT may be about to peak. ○ If the ALT Bull Market Percentage (Priced in BTC) - BMP - is under 10-15% but no further evidence is provided via the 80 HMA or OBV in ETH/BTC or ALTS/BTC, be patient.
The ideal scenario is that as the ALT Bull Market Percentage (Priced in BTC) comes out of the bottom 10-15% range, one is loaded with as many pre-qualifying ALTS as possible. Fortunately, the next phase of the market will be the awaited ALTS season, in which the term HODL, slang in the cryptocurrency community for holding the cryptocurrency, will ensue until the strategy, to be applied to each crypto on an individual basis, negates the buy side bias.
If you pay attention to the above chart, any rally in ALTS/BTC, judging by historical patterns, tends to reach a climactic state above 75% in the ALT Bull Market Percentage (Priced in BTC). It doesn’t mean one has to start deleveraging from ALTS at this hefty levels, as that will be determined along the way in a much more dynamic manner by following the entry and exit strategies laid out earlier. It will then be based on our model that we will decide if the exit strategy is to diversify into BTC or USDT, with the cycle repeating all over again, depending on the type of season present.
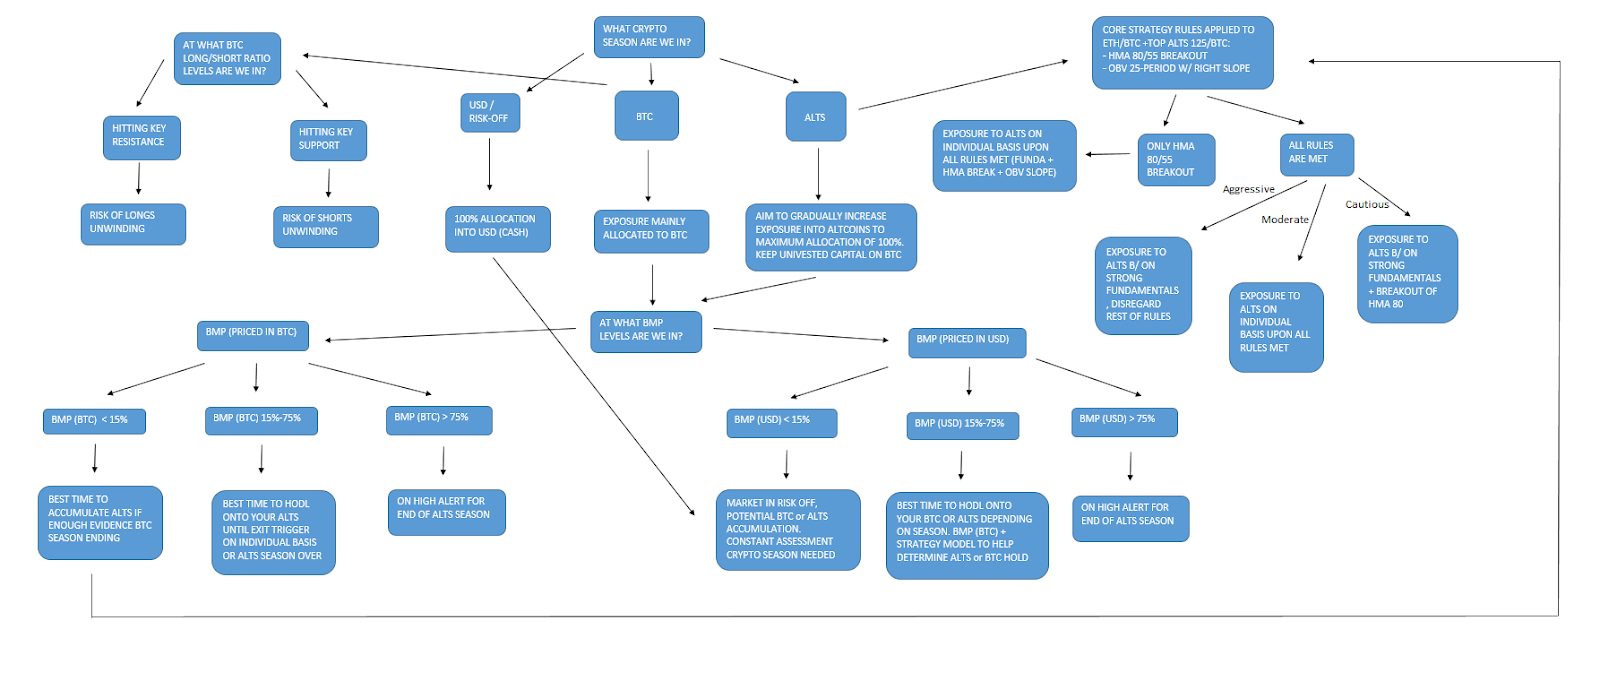
The workflow is condensed in this diagram:
After that painful experience, I realized it was time for me to start managing my crypto holdings in a much more effective manner yet with minimal time spent. If you are a crypto trader or investor with an interest to be more active in the management of your portfolio, I hope this model can assist you in ways to cut the risk and maximize the reward. Remember, take it as a guide to using as a reference, from which you can build upon your own logic to better diversify into cryptos.
IVAN DELGADO is the Head of Market Research at Global Prime.
LiquidityFinder
LiquidityFinder was created to take the friction out of the process of sourcing Business to Business (B2B) liquidity; to become the central reference point for liquidity in OTC electronic markets, and the means to access them. Our mission is to provide streamlined modern solutions and share valuable insight and knowledge that benefit our users.
If you would like to contribute to our website or wish to contact us, please click here or you can email us directly at press@liquidityfinder.com.