just now
Liquidity Finder Ltd is incorporated in England and Wales, company number 10610740, registered address 167-169 Great Portland Street, Fifth Floor, London W1W 5PF, United Kingdom.
Published: just now


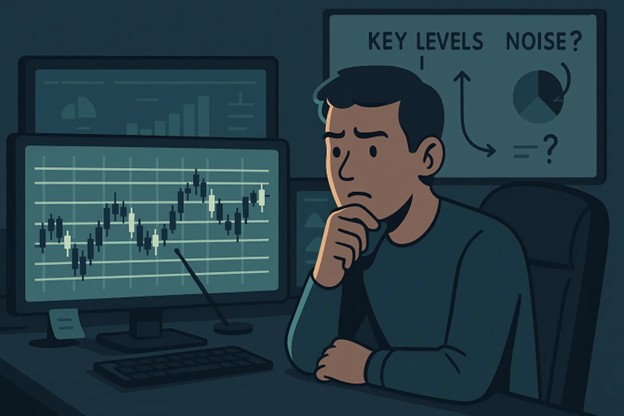
To shift your understanding of Support and Resistance (S&R) from a basic, retail mindset into a precision-based confirmation model used by smart money traders. You’ll learn how to properly draw key S&R levels, identify role reversals, and focus on true key levels that matter—ones that are backed by liquidity, structure, and confirmation.

Imagine you’re navigating a city with hundreds of roads—but only a few major intersections matter for traffic control, signals, and movement.
Don’t treat every street like a highway.
In the market, only a handful of levels truly govern direction—the rest are noise.
| Term | Description |
|---|---|
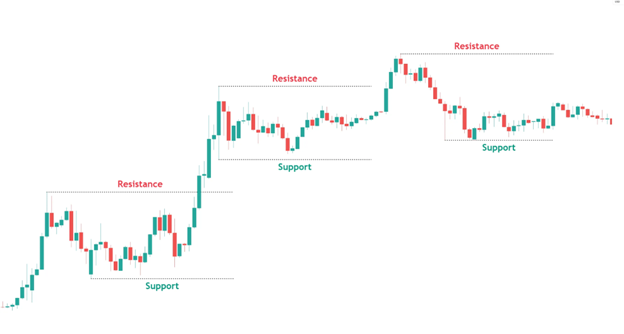
| Support | A price level where price previously stopped falling and reversed upward. |
| Resistance | A price level where price previously stopped rising and reversed downward. |
But in Smart Money terms:
Most traders are taught to draw dozens of horizontal lines. Every swing high or low becomes “support” or “resistance.” But that’s a trap.
Just because price reacted to a level once doesn’t mean it will again.
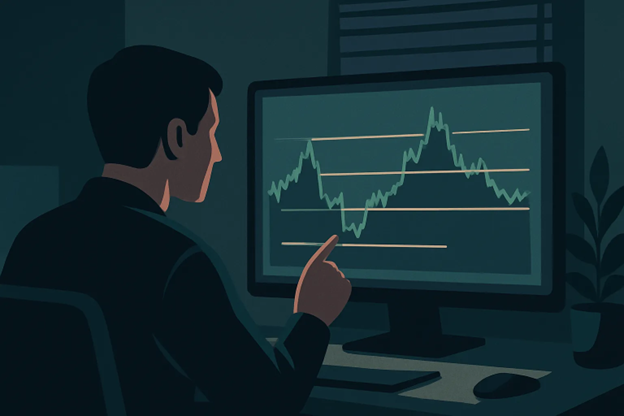
In Smart Money trading, we don’t just draw levels—we define key ones. We only trade those that hold significance, like:
These are key levels—because smart money is involved there.

Most traders:
This creates indecision, clutter, and losses.
Smart Money Traders do this instead:
Retail vs Smart Money S&R
| Approach | Retail Trader | Smart Money Trader |
|---|---|---|
| Breakout Execution | Enters immediately on break | Waits for Sweep → Surge → Shift confirmation |
| Stop Placement | Just below/above level | Anchored beyond liquidity sweep |
| Risk Exposure | High (no structure confirmation) | Low (uses confluence + structure) |
| Trades All Levels | Yes | Selectively filters based on HTF context & time |
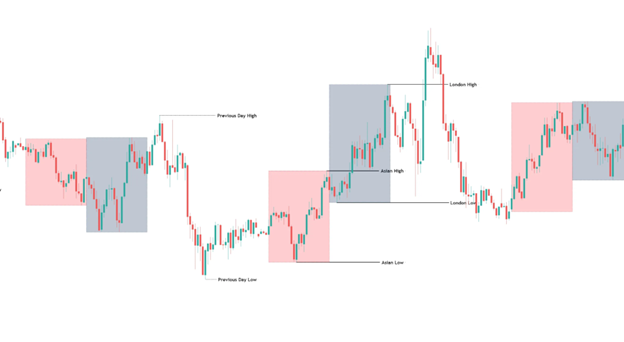
When marking S&R zones, focus on historical reactions and institutional interest areas:
Key Levels to Mark:
Tip:
Don’t mark 10+ levels. Focus on zones with clean reactions and significance on M15 or higher timeframes.
Anyone can draw horizontal lines—but only professionals know:
Combine S&R with time (Kill Zones), liquidity (sweeps), and structure (MSS) for precision entries.
Actionable Playbook:
| Step | Description |
|---|---|
| 1. | Mark PDH, PDL, previous session highs/lows |
| 2. | Wait for price to reach a level inside the Kill Zone |
| 3. | Look for a sweep (e.g., wick above PDH) |
| 4. | Confirm with displacement and market structure shift on lower timeframe |
| 5. | Enter on the pullback with SL below/above the sweep zone |
| 6. | Target next clean liquidity level (ERL or HTF FVG) |

Every level isn’t a trade.
But every trade comes from a key level.
Support and resistance only matter when smart money interacts with them. Wait for the sweep, the surge, the shift.
Confirmation gives you clarity. And clarity protects your capital
Check out my previous blog plotting simple support and resistance levels: https://acy.com/en/market-news/education/ultimate-guide-market-trends-price-action-j-o-03252025-141804/
This content may have been written by a third party. ACY makes no representation or warranty and assumes no liability as to the accuracy or completeness of the information provided, nor any loss arising from any investment based on a recommendation, forecast or other information supplies by any third-party. This content is information only, and does not constitute financial, investment or other advice on which you can rely.
ACY Securities is one of Australia's fastest growing multi-asset online trading providers, offering ultra-low-cost trading, rock-solid execution, technologically superior account management and premium market analysis.
Select the categories and companies you wish to follow directly to your person rss feed.
Create Custom RSS FeedSign up and join over 5,000 professional members who receive personalized news alerts, curated professional connections, and more for free!
Binance has lowered its VIP 3 Wallet Assets threshold from $3 million to $1 million and will now count OTC Spot Trading Volume at a 4x multiplier toward VIP qualification, removing the previous VIP 4 cap and allowing eligible users to progress through the full tier framework up to VIP 9.
Retail futures trading leader NinjaTrader Group has appointed Mark Omens as Senior Vice President, Commercial Strategy, bringing a 25-year veteran of derivatives marketplace CME Group into a newly created role focused on exchange partnerships and enterprise growth.
Gold Price Action Forecast: Will XAU/USD Drop to $3930? Meta Description: Read our Gold price action forecast to see if XAU/USD will drop to $3930.
BitDelta Securities Financial Services LLC (“BitDelta Securities”) today announced that it has received full regulatory approval from the Capital Market Authority (“CMA”) of the United Arab Emirates under the Category 5 — Arrangement and Advice license framework (License No. 20200000439). The approval follows the firm's receipt of In-Principal Approval earlier this year and represents the successful conclusion of the CMA's full licensing process, including the satisfaction of capital requirements, governance appointments, and operational setup.
Crypto.com has received a $400 million strategic investment from Citadel Securities, valuing the firm at $20 billion. It marks the first institutional funding round in the company's history, aimed at accelerating its expansion into tokenised securities, derivatives and other asset classes.
WTI’s pullback into $79–82 is the first major test of the bullish Elliott Wave count, with buyers targeting a renewed break above $85.

BitDelta Securities has secured a full CMA Category 5 licence in the UAE and opened a regulated office in Business Bay, Dubai. The firm operates as an introducing broker, connecting investors with licensed international brokers across multiple asset classes, with CEO Dr. Demetrios Zamboglou commenting on the milestone.
Index volatility is asleep while single stocks fight it out underneath, credit refuses to confirm the equity rally, and a bare macro calendar hands next week to oil.
Digital assets and FX brokerage GC Exchange FZE (GCEX) has appointed Mohammed A. Mulla as a Board Member of its Dubai-based entity, part of the wider GCEX Group.
Learn what Blockchain-as-a-Service is, how it works, and why businesses are using BaaS to build blockchain applications without managing infrastructure.


