just now

Liquidity Finder Ltd is incorporated in England and Wales, company number 10610740, registered address 167-169 Great Portland Street, Fifth Floor, London W1W 5PF, United Kingdom.
Published: just now


To teach you how to trade breakouts with precision by using key level marking, multi-timeframe confirmation, and session-based timing—instead of chasing impulsive price moves like retail traders.
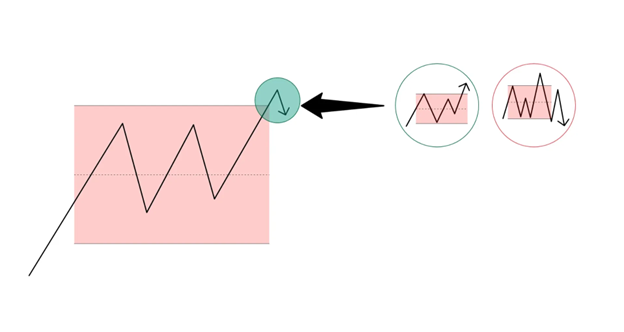
When price touches a key level, it can do one of two things:
Knowing which one is happening in real time separates smart traders from stop-loss donations.
Here’s how to tell the difference:
| Breakout | Fakeout |
|---|---|
| Happens during Kill Zones | Happens outside major sessions |
| Backed by displacement (strong move) | Weak, hesitant candles |
| Confirmed by HTF bias (H1, M15 trend alignment) | Goes against HTF trend |
| Breaks cleanly, leaves a Fair Value Gap (FVG) | Breaks briefly, immediately retraces |
| Volume and momentum increase | Thin, choppy price action |

Imagine standing in front of a locked door with 10 people pushing behind you. If the hinges are weak, and the pressure builds long enough, the door bursts open—clean and unstoppable.
But what if the people behind you were distracted, or not ready? You might push first, only to bounce back and fall. That’s what a fake breakout feels like.
Breakouts need pressure, alignment, and timing. Without those, you’re just hitting resistance—not breaking it.
A breakout is meaningless if it doesn’t occur at a key level. That means you need to mark zones where institutions are likely active.
Use these levels as potential breakout zones or liquidity traps:
| Key Level | Description |
|---|---|
| Previous Day High/Low | External liquidity anchor |
| Previous Session High/Low | Intra-day liquidity pockets |
| Support & Resistance Levels | Swing highs / lows |
Breakouts mean nothing without context. Mark these zones every session.
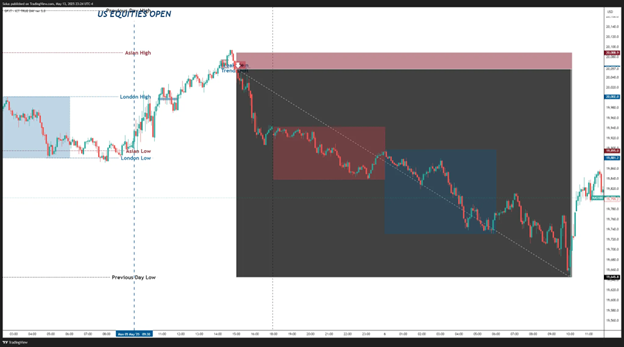
GOLD
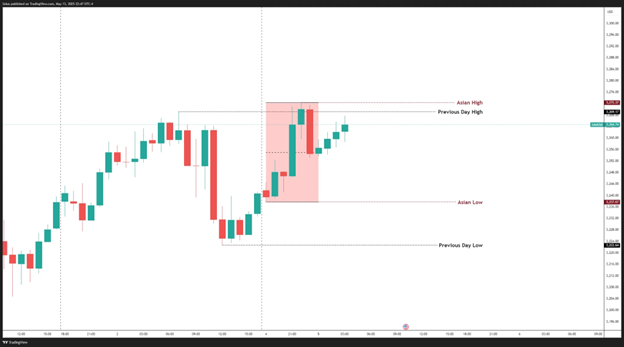
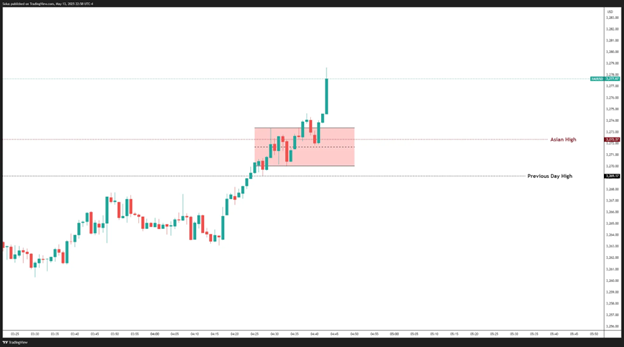
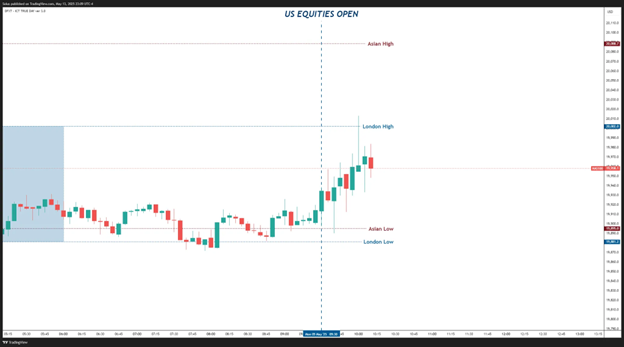
Mark Key Levels on H1 / M15 timeframe:
There’s no London High / Low yet since we are look for potential trades during that time. We can refer to those levels during New York session.
Wait for price to reach a key level during a key session.
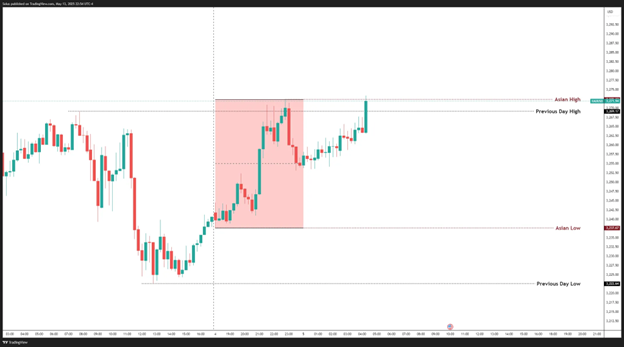
In this case, we are currently testing the Asian high and Previous Day High, either price breaks or fakes.
Smart money doesn’t break levels at random times. They do it when:
That’s why your breakout trades should only be taken during:
| Kill Zone | Time (EST) | What to Expect |
|---|---|---|
| London Session | 12AM – 6AM | Sweeps, setups begin forming |
| Pre-New York Open | 6:00AM - 9:30AM | Sweeps of Asian, London Highs / Lows (Best for Currencies) |
| New York AM | 9:30AM – 12PM | Breakouts, displacements, execution zone (Best for US Indices) |
| New York PM | 1PM – 4PM | Reversals, stop runs, trap breakouts |
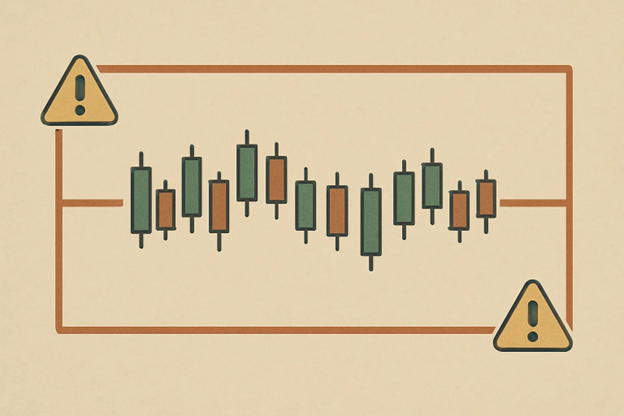
Outside these zones? Expect low volume, false moves, or no continuation.
Once price reaches this levels, go to lower timeframe to confirm if a level is willing to break or fake.
Breakouts on lower timeframes often mislead unless confirmed by higher timeframe intent. Before trading a breakout on M1 or M5, confirm bias on H1 or M15.
Here’s how:

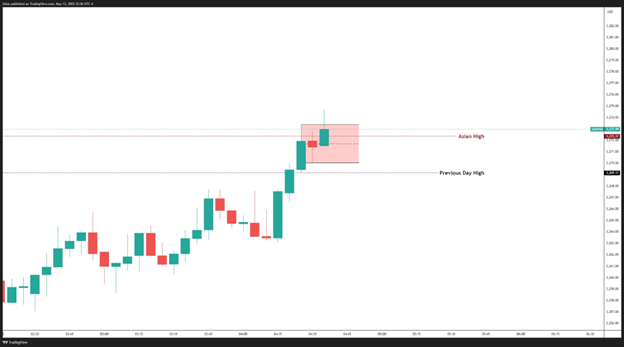
M5 and M1 confirms that we are ready to go to the upside as it break another range at a lower timeframe.
The Key: Whenever price reaches a key level, observe price action at the lower timeframe. In this scenario, we are using M5 / M1 as a confirmation if it would breakout off the range.
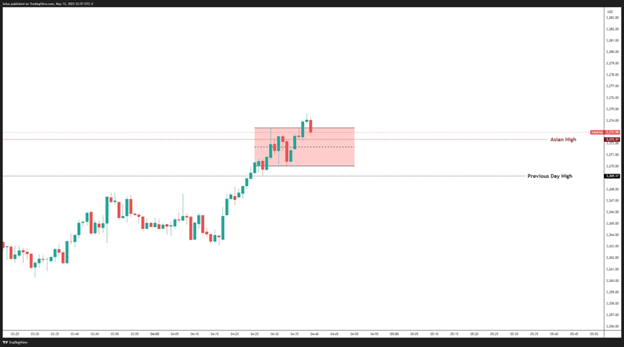
The next step is to wait for a momentum candle or a displacement (strong move to a certain direction) to confirm that the there’s traction either upside or downside.
The 3 candles are tagged as displacement candles because it engulfed the series of candles, signifying a renewed bullish momentum.
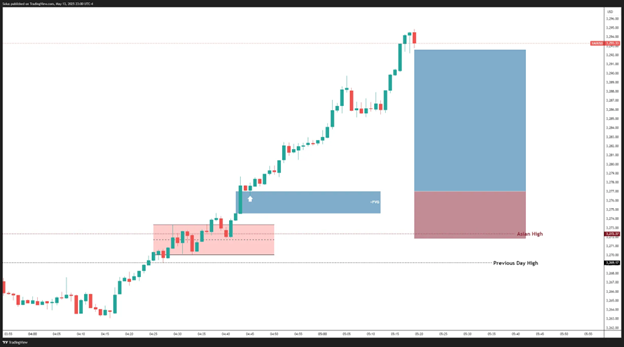
It also left a fair value gap for entry.
✅ A breakout with HTF confirmation = continuation
❌ A breakout against HTF bias = likely trap or false move
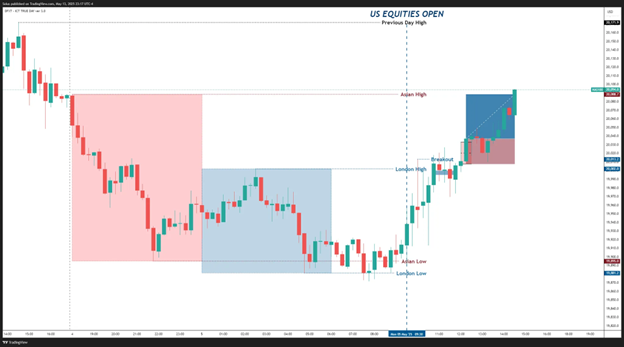
NASDAQ
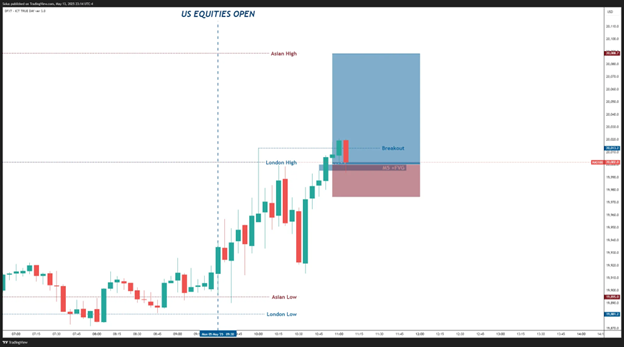
1. Mark Key Levels
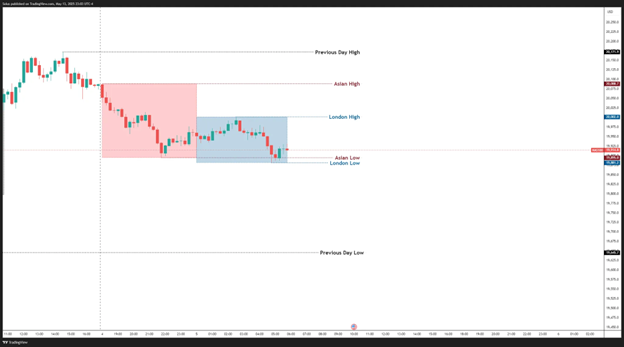
Key Levels:
2. Wait for Levels During Killzone
Since we are using Nasdaq as an example for a trade idea, we’d like to wait for the US equities open at 9:30AM EST before we look for trades. We need momentum to inject first.
3. Use Multi-Timeframe Confirmation
Looking at M5 chart, there’s no willingness for the HTF (Higher Timeframe) to go to the upside. We wait for a LTF (Lower Timeframe) breakout.
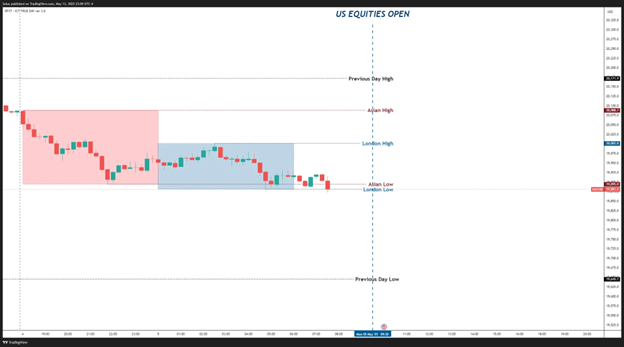
Stops can be placed below the 1st candle of the 3 candle FVG pattern.
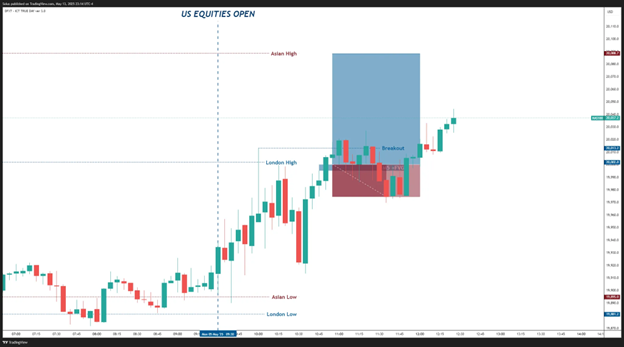
In this case, you got stopped out. That’s totally fine. We can look for another opportunity.
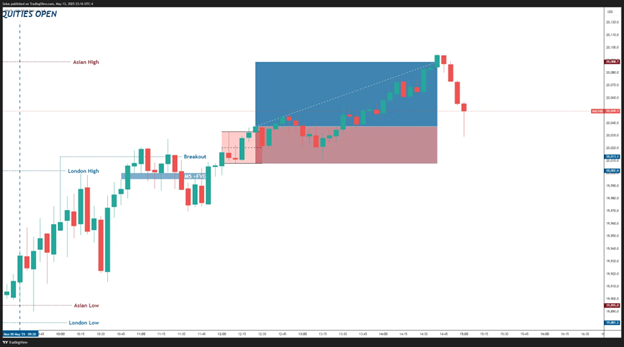
Another breakout opportunity with targets at the Asian High.
Another opportunity has presented itself: Asian High breakout. Now, we need to make sure if the LTF agrees to push price to the upside by looking for a confirmation.
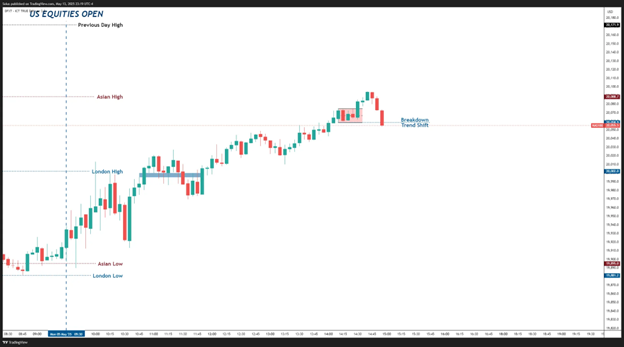
Looking at price action, there’s no willingness for price to push to the upside. We can now look for short opportunities as price presents a potential reversal play with confluences of:
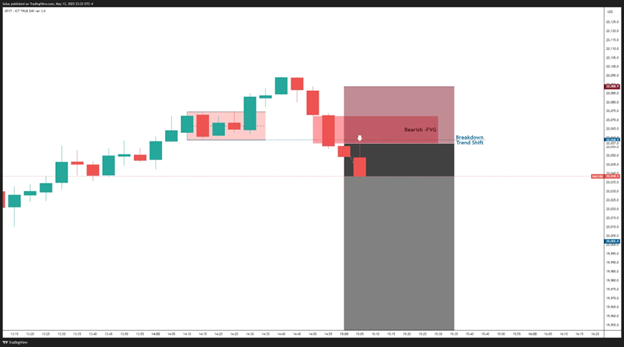
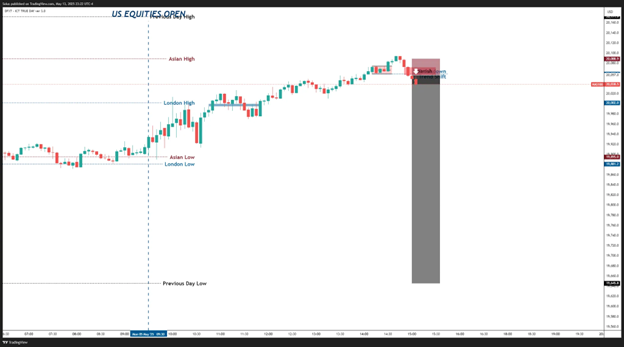
We look for execution at the FVG with target at the Previous Day Low. Why? It’s the only Key Level on the downside that has not been traded yet.
This trade actually extended until the next day. After price reached the Previous Day’s Low, it bounced right off the bat.
Key Principle in Trading Breakouts:
Here’s your breakout plan using SMC tools:
Before you jump into a breakout trade, ask yourself:
(PDH/PDL, Session High/Low, Major Swing)
2. Is it during a Kill Zone?
(London Open, New York AM, Pre-NY Open)
3. Is there displacement and follow-through?
(One strong move with multiple bullish/bearish candles)
4. Is HTF (H1/M15) supporting the move?
(Higher timeframe structure must align)
5. Is there an FVG or liquidity gap left behind?
(Institutional footprints = real move)
✅ If all answers are YES → trade the breakout.
❌ If any answer is NO → it's likely a trap. Stand aside or look for a reversal.
Beginner Mistake to Avoid:
❌ Chasing a candle that breaks a level with no context
✅ Instead: Wait for confirmation that the level is actually going to break. If it fakes, look for reversal opportunities.
Remember:
A real breakout is not just a candle breaking a line.
It’s pressure + timing + confirmation coming together.
"A breakout is a moment of decision—not just a bigger candle."
If you master this filter, you won’t just chase breakouts...
You'll trade WITH smart money, not against it.
Most traders lose money on breakouts not because they’re wrong—but because they enter without structure, time, or confirmation.
In the Smart Money model, a breakout is a part of the trap, not the beginning of the move. Your job isn’t to catch every breakout. Your job is to wait for the ones engineered by real money—and trade them with discipline.
This content may have been written by a third party. ACY makes no representation or warranty and assumes no liability as to the accuracy or completeness of the information provided, nor any loss arising from any investment based on a recommendation, forecast or other information supplies by any third-party. This content is information only, and does not constitute financial, investment or other advice on which you can rely.
ACY Securities is one of Australia's fastest growing multi-asset online trading providers, offering ultra-low-cost trading, rock-solid execution, technologically superior account management and premium market analysis.
Select the categories and companies you wish to follow directly to your person rss feed.
Create Custom RSS FeedSign up and join over 5,000 professional members who receive personalized news alerts, curated professional connections, and more for free!
Sterling steadies after political uncertainty rattled gilt markets, while EUR/USD and EUR/GBP approach key technical levels ahead of today's European session.
GBP/AUD remains trapped in a well-defined bearish trend on both the weekly and daily timeframes.
Discover the key drivers, technical levels, and central bank expectations shaping the EUR/USD trend as the ECB prepares to hold rates and markets watch for a potential breakout.
Sydney-based multi-asset broker ACY Securities has introduced PAXGUSD, a new CFD instrument that allows clients to trade tokenised gold against the US Dollar 24 hours a day, seven days a week. The instrument is available across MetaTrader 4, MetaTrader 5, and the ACY Trading Platform.
Binance has lowered its VIP 3 Wallet Assets threshold from $3 million to $1 million and will now count OTC Spot Trading Volume at a 4x multiplier toward VIP qualification, removing the previous VIP 4 cap and allowing eligible users to progress through the full tier framework up to VIP 9.
Retail futures trading leader NinjaTrader Group has appointed Mark Omens as Senior Vice President, Commercial Strategy, bringing a 25-year veteran of derivatives marketplace CME Group into a newly created role focused on exchange partnerships and enterprise growth.
Gold Price Action Forecast: Will XAU/USD Drop to $3930? Meta Description: Read our Gold price action forecast to see if XAU/USD will drop to $3930.
BitDelta Securities Financial Services LLC (“BitDelta Securities”) today announced that it has received full regulatory approval from the Capital Market Authority (“CMA”) of the United Arab Emirates under the Category 5 — Arrangement and Advice license framework (License No. 20200000439). The approval follows the firm's receipt of In-Principal Approval earlier this year and represents the successful conclusion of the CMA's full licensing process, including the satisfaction of capital requirements, governance appointments, and operational setup.
Crypto.com has received a $400 million strategic investment from Citadel Securities, valuing the firm at $20 billion. It marks the first institutional funding round in the company's history, aimed at accelerating its expansion into tokenised securities, derivatives and other asset classes.
WTI’s pullback into $79–82 is the first major test of the bullish Elliott Wave count, with buyers targeting a renewed break above $85.


