just now


Liquidity Finder Ltd is incorporated in England and Wales, company number 10610740, registered address 167-169 Great Portland Street, Fifth Floor, London W1W 5PF, United Kingdom.
Published: just now

To help you understand why the 0.618 and 1.618 Fibonacci levels are called "golden", how they differ from other Fibonacci levels, and how to trade them effectively using confluence and confirmation models. This lesson will move you from simply plotting ratios to strategically executing trades with high probability.

The term “golden” in Fibonacci trading refers to specific ratios—0.618 and 1.618—that appear repeatedly in nature, geometry, architecture, and now, financial markets.
These ratios are found in everything from sunflower spirals to pyramids, and they represent a natural sense of proportion and symmetry which makes them resonate psychologically with human behavior. In markets, this means: traders tend to react to these levels more consistently.

Think of 0.618 as the sweet spot on a guitar string. It’s not just about hitting a note, it’s about resonance. Add harmony (confluence), and you get a powerful sound that moves the listener. The golden ratio in trading works the same—alone it’s strong, but with support, it sings.
| Ratio | Type | Strength | Trading Role |
|---|---|---|---|
| 0.618 | Retracement | 🔥🔥🔥🔥🔥 | High-probability entry in pullbacks |
| 1.618 | Extension | 🔥🔥🔥🔥🔥 | Primary continuation target |
| 0.382 | Retracement | 🔥🔥🔥 | Shallow retrace / aggressive trend |
| 0.5 | Midpoint | 🔥🔥 | Psychological midpoint |
| 2.0 / 2.618 | Extensions | 🔥🔥 | Exhaustion or extreme trend target |
Check this out to learn more about the other Fibonacci Levels: What Is Fibonacci in Trading and How to Use It Effectively
Because they are deeply rooted in the natural order and trader psychology. They become “golden” not only from math but from mass usage and repeated market respect.
A golden ratio without context is just a number. What gives it power is what else happens there.
Look for confluence with:
Golden zones are golden when multiple signals point to them—not just because they’re 0.618.
Check this content to learn more about adding confluences in your ratios: Fibonacci Trading: How to Trade Fibonacci With High Probability


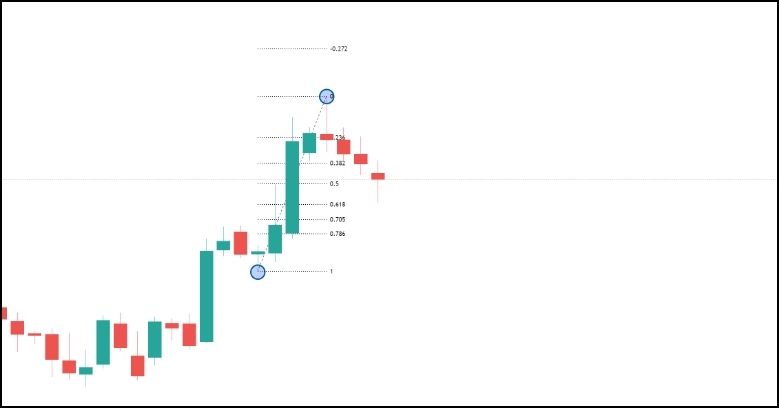
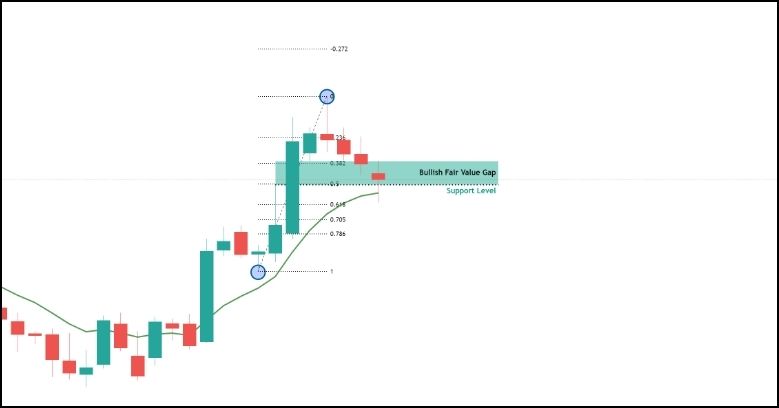
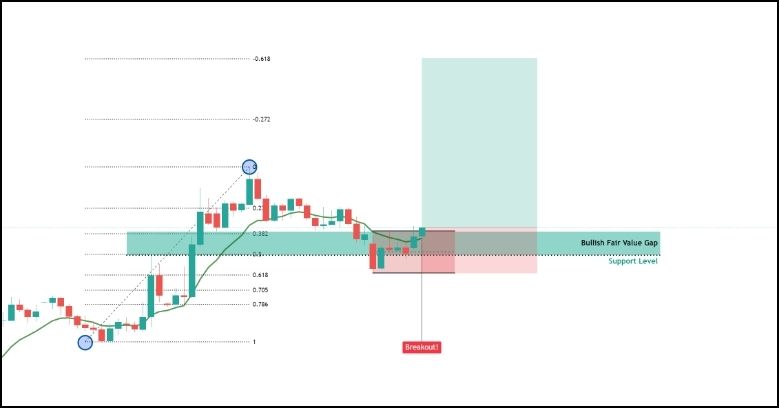
Entry: Breakout of LTF Range, Candlestick Signal
Stop Loss: Below 0.786 or below structure
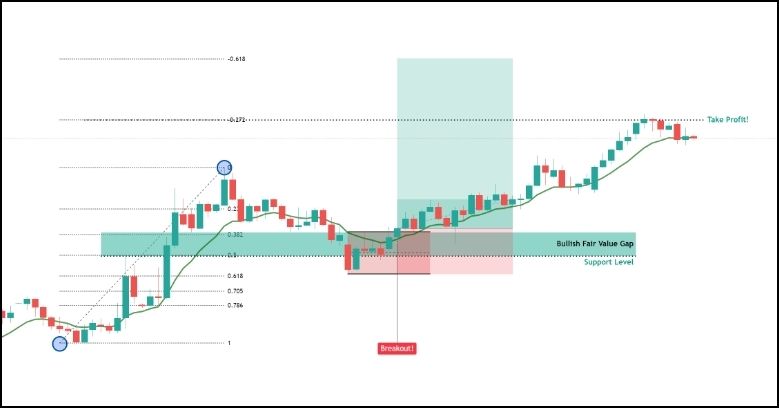
Take Profit: 1.0 target or 1.272 / 1.618 extensions (Use -0.272 / -0.618; Still the same ratio but reversed)

Don’t just draw Fibonacci levels—trade them with confidence.
How To Trade & Scalp Indices at the Open Using Smart Money Concepts (SMC)
How to Trade Breakouts Effectively in Day Trading with Smart Money Concepts
Complete Step-by-Step Guide to Day Trading Gold (XAU/USD) with Smart Money Concepts (SMC)
The Power of Multi-Timeframe Analysis in Smart Money Concepts (SMC)
Forex Trading Strategy for Beginners
Mastering Candlestick Pattern Analysis with the SMC Strategy for Day Trading
Mastering Risk Management: Stop Loss, Take Profit, and Position Sizing
RSI Divergence Trading Strategy for Gold: How to Identify and Trade Trend Reversals
Stochastics Trading Secrets: How to Time Entries in Trending Markets using Stochastics
Gold Trading Stochastics Strategy: How to Trade Gold with 2R–3R Targets
RSI Hidden Divergence Explained: How to Spot Trend Continuations Like a Pro
Why Smart Money Concepts Work in News-Driven Markets - CPI, NFP, and More
How to Trade NFP Using Smart Money Concepts (SMC)-A Proven Strategy for Forex Traders
How to Trade CPI Like Smart Money - A Step-by-Step Guide Using SMC
How to Start Trading Indices and Get into the Stock Market with Low Capital (2025 Guide)
Best Indices to Trade for Day Traders | NASDAQ, S&P 500, DAX + Best Times to Trade Them
How To Trade & Scalp Indices at the Open Using Smart Money Concepts (SMC)
NAS100 - How to Trade the Nasdaq Like a Pro (Smart Money Edition)
How to Trade CPI Like Smart Money - A Step-by-Step Guide Using SMC
Why Smart Money Concepts Work in News-Driven Markets - CPI, NFP, and More
How to Swing Trade Gold (XAU/USD) Using Smart Money Concepts: A Simple Guide for Traders
Complete Step-by-Step Guide to Day Trading Gold (XAU/USD) with Smart Money Concepts (SMC)
The Ultimate Guide to Backtesting and Trading Gold (XAU/USD) Using Smart Money Concepts (SMC)
Why Gold Remains the Ultimate Security in a Shifting World
How to Trade Candlestick Patterns with High Probability: A Complete Guide for Beginners
The Top Japanese Candlestick Guide: What is an Engulfing Pattern and How to Trade It?
Piercing Pattern Candlestick Explained: How to Trade It - Step-By-Step Guide
Morning & Evening Star Candlestick Patterns – How to Trade Market Reversals with Confidence
5 Steps to Start Day Trading: A Strategic Guide for Beginners
8 Steps How to Start Forex Day Trading in 2025: A Beginner’s Step-by-Step Guide
3 Steps to Build a Trading Routine for Consistency and Discipline - Day Trading Edition
The Ultimate Guide to Understanding Market Trends and Price Action
How to Identify Risk-On and Risk-Off Market Sentiment: A Complete Trader’s Guide
How to Trade Risk-On and Risk-Off Sentiment - With Technical Confirmation
The Ultimate Guide to Understanding Market Trends and Price Action
Why Smart Money Concepts Work: The Truth Behind Liquidity and Price Action
Mastering the Market with Smart Money Concepts: 5 Strategic Approaches
Mastering Candlestick Pattern Analysis with the SMC Strategy for Day Trading
Understanding Liquidity Sweep: How Smart Money Trades Liquidity Zones in Forex, Gold, US Indices
The SMC Playbook Series Part 4: How to Confirm Trend Reversal & Direction using SMC
The SMC Playbook Series Part 5: The Power of Multi-Timeframe Analysis in Smart Money Concepts (SMC)
Fair Value Gaps Explained: How Smart Money Leaves Footprints in the Market
The Best Time to Use Smart Money Concepts (SMC): Why Timing Is Everything in Trading SMC
How to Trade the London Session Using Smart Money Concepts (SMC)
The Mental Game of Execution - Debunking the Common Trading Psychology
5 Steps to Backtest a Trading Strategy with AI: A Step-by-Step Guide
Managing Trading Losses: Why You Can Be Wrong and Still Win Big in Trading
The Hidden Threat in Trading: How Performance Anxiety Sabotages Your Edge
Why You Fail in Trading: You Don’t Have Enough Capital to Survive
Why 90% of Retail Traders Fail Even with Profitable Trading Strategies
The Top 10 Best Trading Books That Changed My Mindset, Strategy & Performance
Discovering Your Trader Profile: What Kind of Trader Are You?
ACY Securities is one of Australia's fastest growing multi-asset online trading providers, offering ultra-low-cost trading, rock-solid execution, technologically superior account management and premium market analysis.

Select the categories and companies you wish to follow directly to your person rss feed.
Create Custom RSS FeedSign up and join over 5,000 professional members who receive personalized news alerts, curated professional connections, and more for free!
Theorem has integrated Symbiotic’s Liquid Lane RFQ network, letting holders of tokenised real-world assets trade against on-chain pool liquidity and market-maker quotes. The integration is live on Ethereum, with Midas’s yield-bearing mHYPER fund as the first supported asset. Holders can trade for the USDC stablecoin.
US equities were volatile with technology selloff erasing much of the earlier rebound.
FM Summit London 2026 returns to Old Billingsgate on 24 November for its 15th edition, with LMAX Group, Plus500 and oneZero among confirmed exhibitors. The one-day event adds Business Connect meetings and roundtables, and opens with a networking evening at The Folly on 23 November.
Finance Magnates Summit London returns to Old Billingsgate on 24 November 2026 for its 15th edition. The one-day event brings together brokers, liquidity providers, institutional firms, trading technology vendors, payments businesses and digital asset firms.
iSAM Securities Apex has integrated with Match-Prime, giving brokers access to liquidity across more than 2,000 instruments, with tailored pricing and up to 10 levels of market depth.
propfunding.com's free-entry instant funding changes the order of prop funding. Start trading first. Its free-entry instant funding model offers two qualification attempts without an upfront activation fee.
US stocks closed higher on Wednesday, with the Nasdaq gaining 1%, the S&P 500 rising 0.6%, and the Dow advancing 0.7%, as renewed enthusiasm for AI-related stocks lifted market sentiment.
SpaceX went public in June as a rocket company. On October 20 it reported as something else entirely: an AI infrastructure business, financed by a satellite broadband network, with a launch division attached. Rockets generated 12% of third quarter revenue and lost money. The AI segment generated 52% of revenue and consumed 84% of capital expenditure. Starlink generated 85% of operating profit.
Standard Chartered has signed definitive agreements to acquire 100% of Zodia Custody UK Limited, folding its regulated digital asset custody business into Securities Services. Zodia Solutions will be set up under SC Ventures with bank investors including Northern Trust, NAB Ventures, Emirates NBD and Investcorp.
Bybit Fintech FZE has secured a Virtual Asset Service Provider licence from Dubai’s Virtual Assets Regulatory Authority for Exchange Services, covering spot trading. Bybit’s Peter Loo said the firm hopes to add derivatives, subject to regulatory approvals. Its international Dubai headquarters opened in 2022.