just now

Liquidity Finder Ltd is incorporated in England and Wales, company number 10610740, registered address 167-169 Great Portland Street, Fifth Floor, London W1W 5PF, United Kingdom.
Published: just now
To help you trade strong market trends with more confidence and clarity — by using moving averages to find direction and RSI to confirm momentum strength before you enter.

Imagine you're driving on the highway.
You don’t accelerate in a traffic jam (sideways markets), and you don’t blindly press the gas if your engine (momentum) is weak.
You wait for the road to open (trend) and the power to kick in (RSI), then go full throttle (entry).
| Tool | What It Does |
|---|---|
| 20 EMA / 50 SMA | Identify trend direction and pullback zones |
| RSI (14) | Measures momentum strength in the trend |
When both tools point in the same direction, you have confluence — and higher probability setups.
Most traders misuse RSI. They buy when it’s “oversold” or sell when it’s “overbought.” But in trend trading, we do the opposite.
| Market Trend | What RSI Should Do |
|---|---|
| Uptrend | RSI stays above 50 and makes higher lows |
| Downtrend | RSI stays below 50 and makes lower highs |
Key Insight:
If RSI starts dropping below 50 in an uptrend → momentum is fading
If RSI starts rising above 50 in a downtrend → trend might reverse
Use this RSI 50 “midline” as your trend confirmation filter.
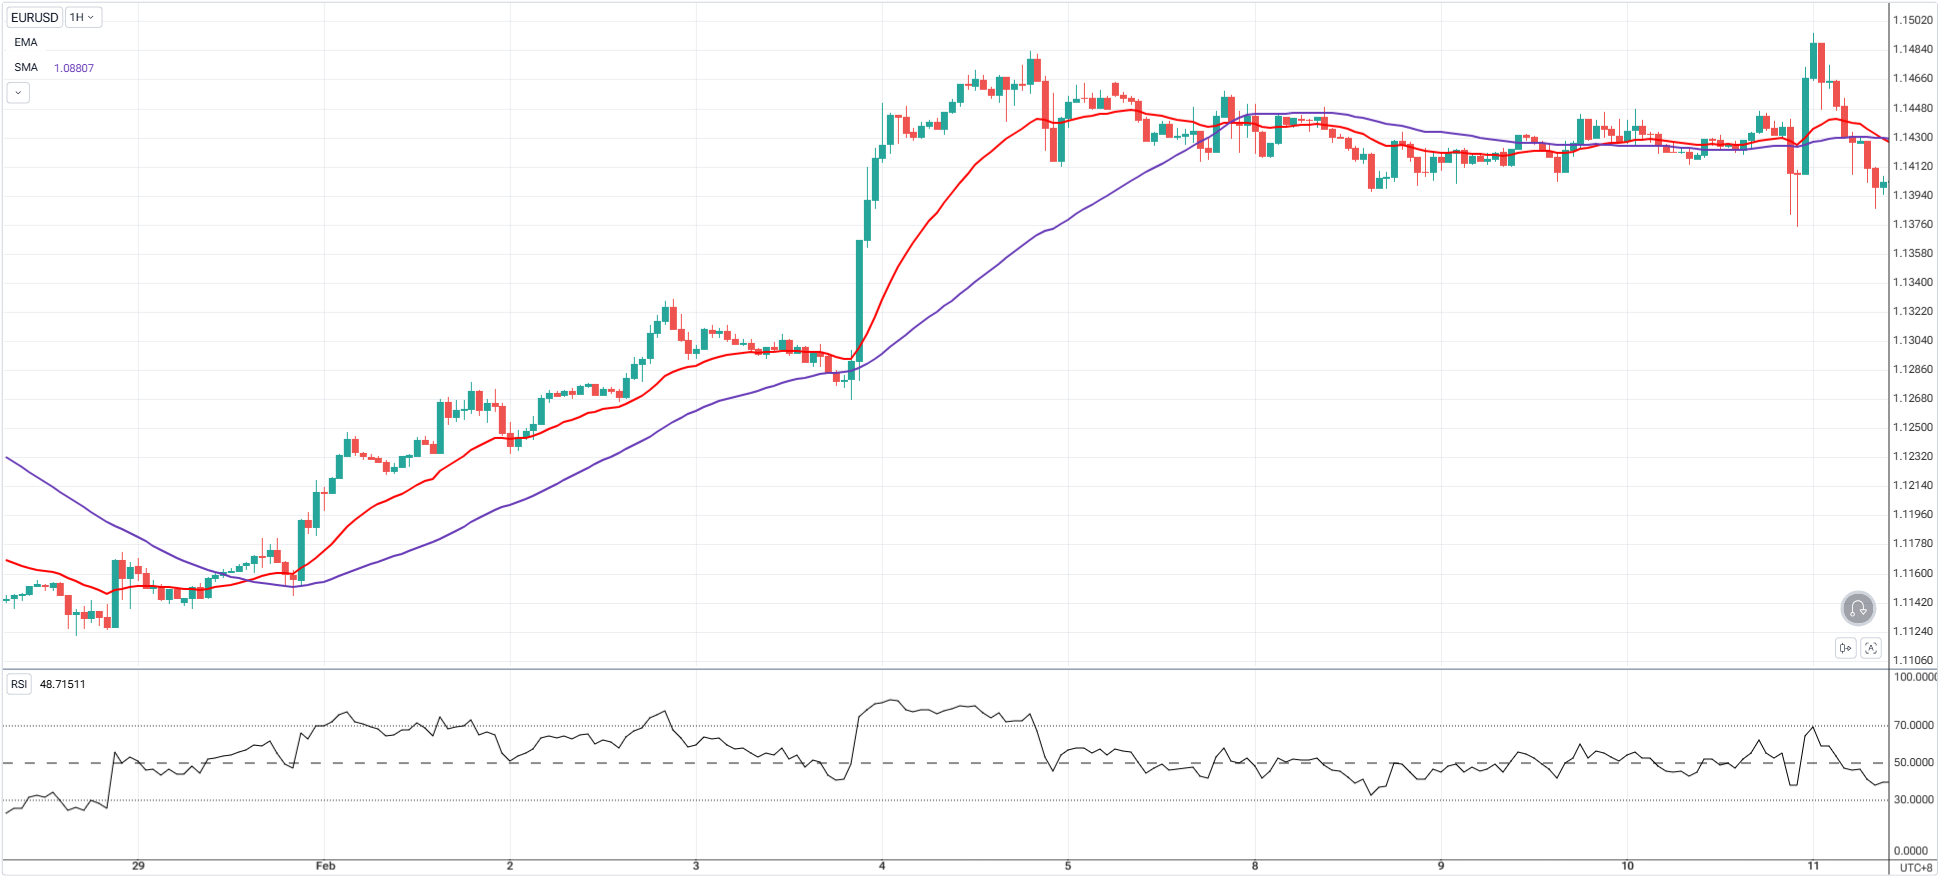
Bullish Trend: Price above both, MAs sloping upward
Bearish Trend: Price below both, MAs sloping downward
Flat or twisted MAs = Ranging. Wait.
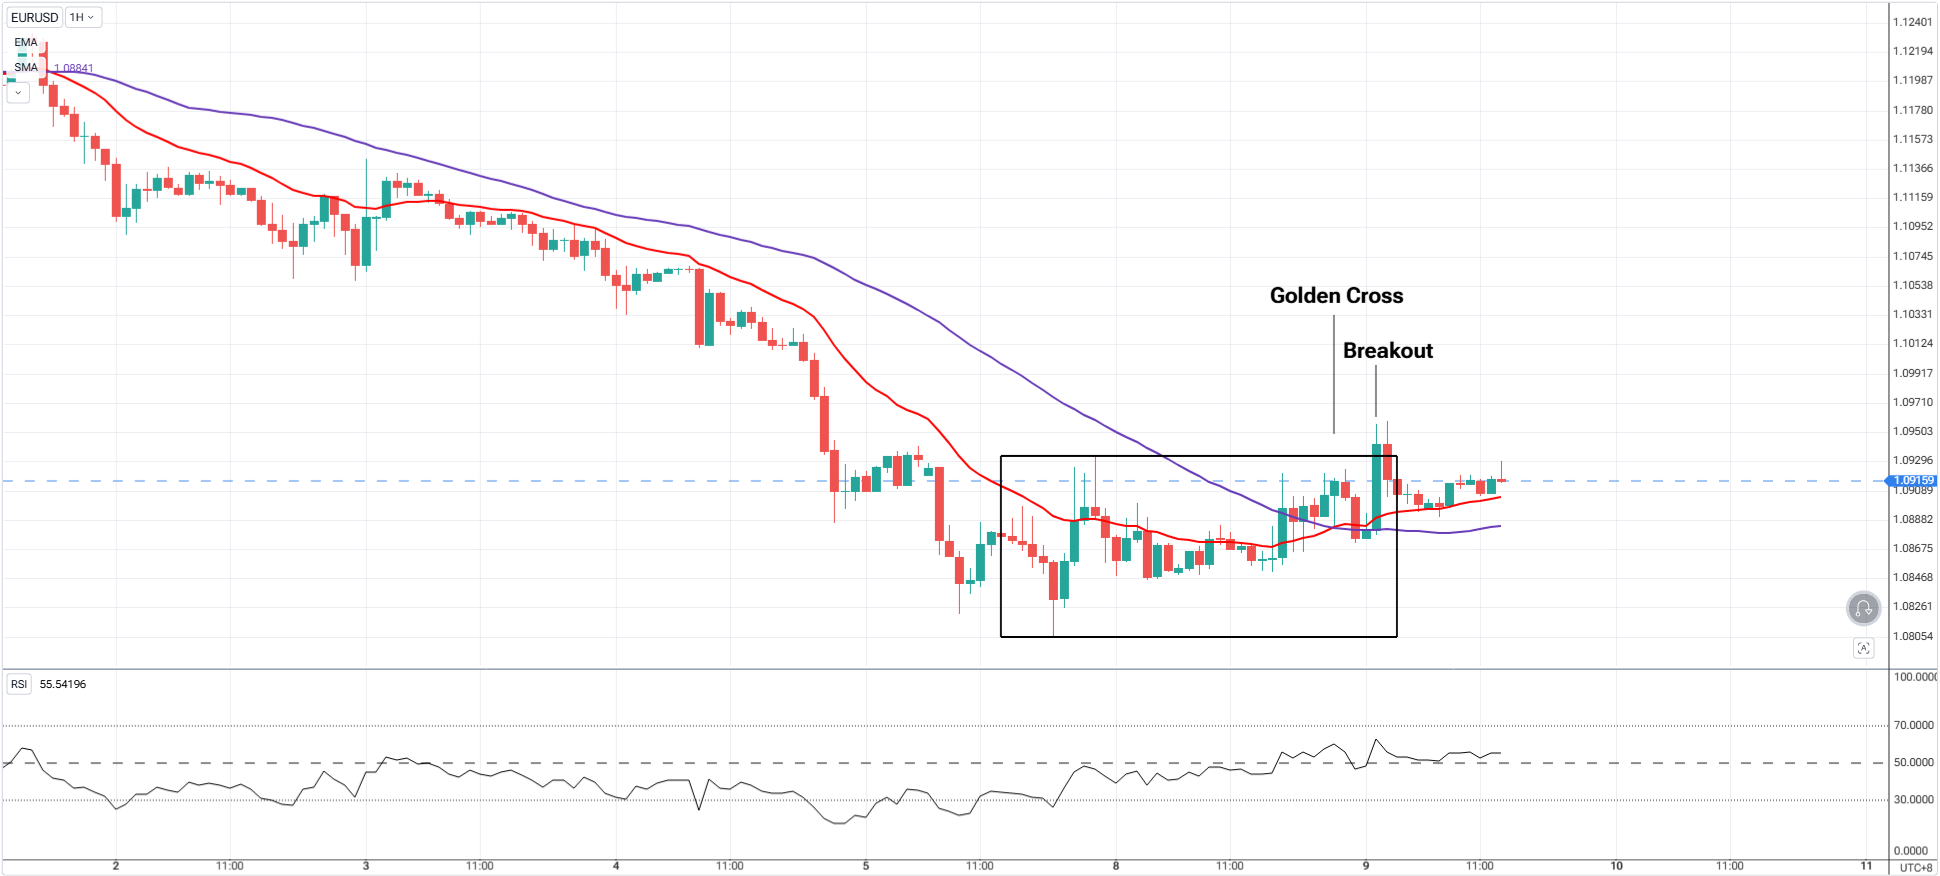
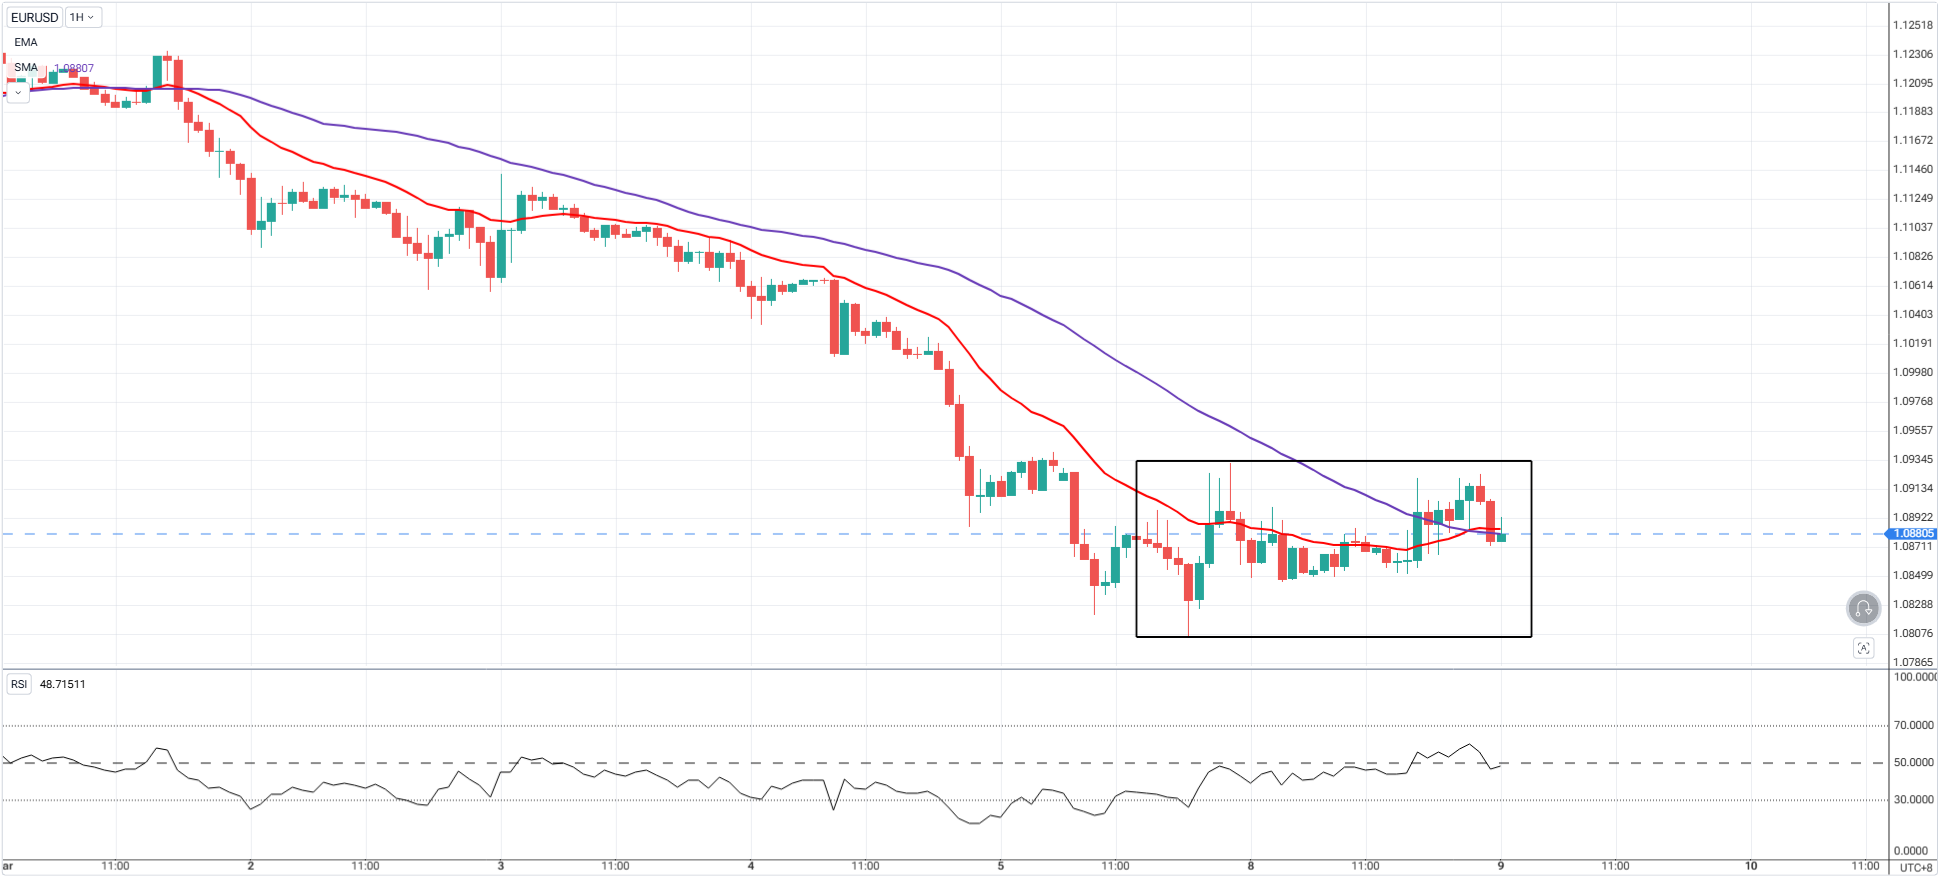
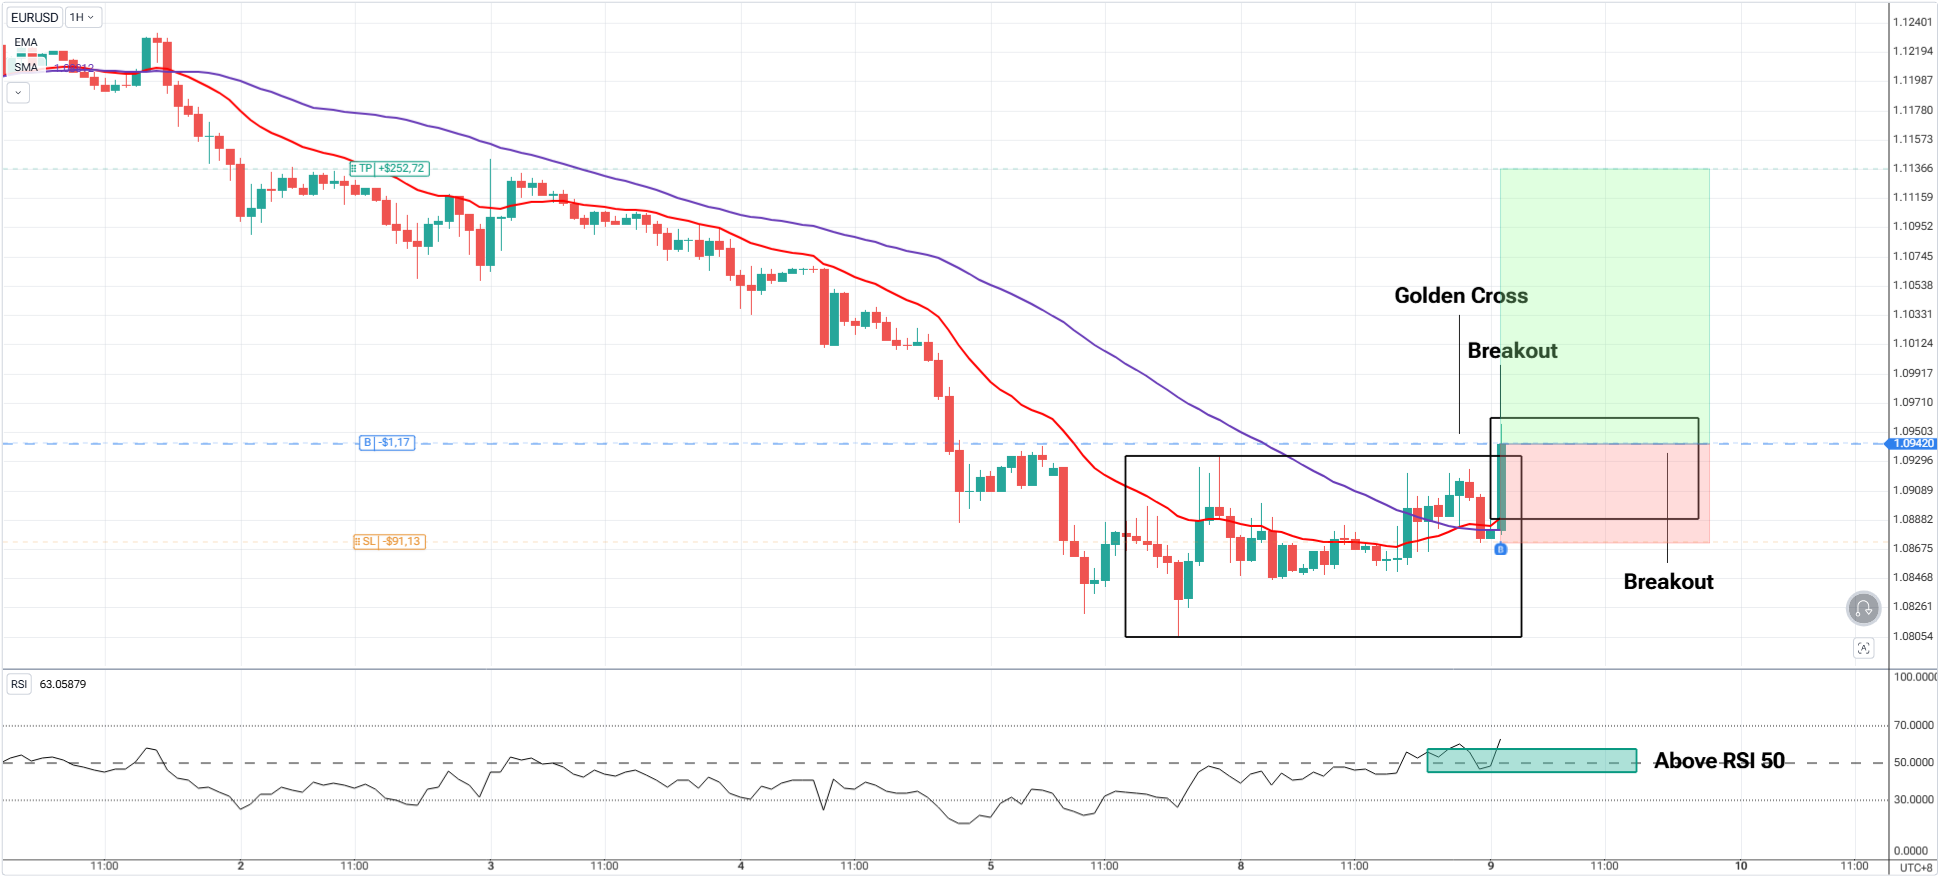
Let price breakout of the range & price above the:
You will anticipate a Golden (Bullish) or Death (Bearish) Cross.
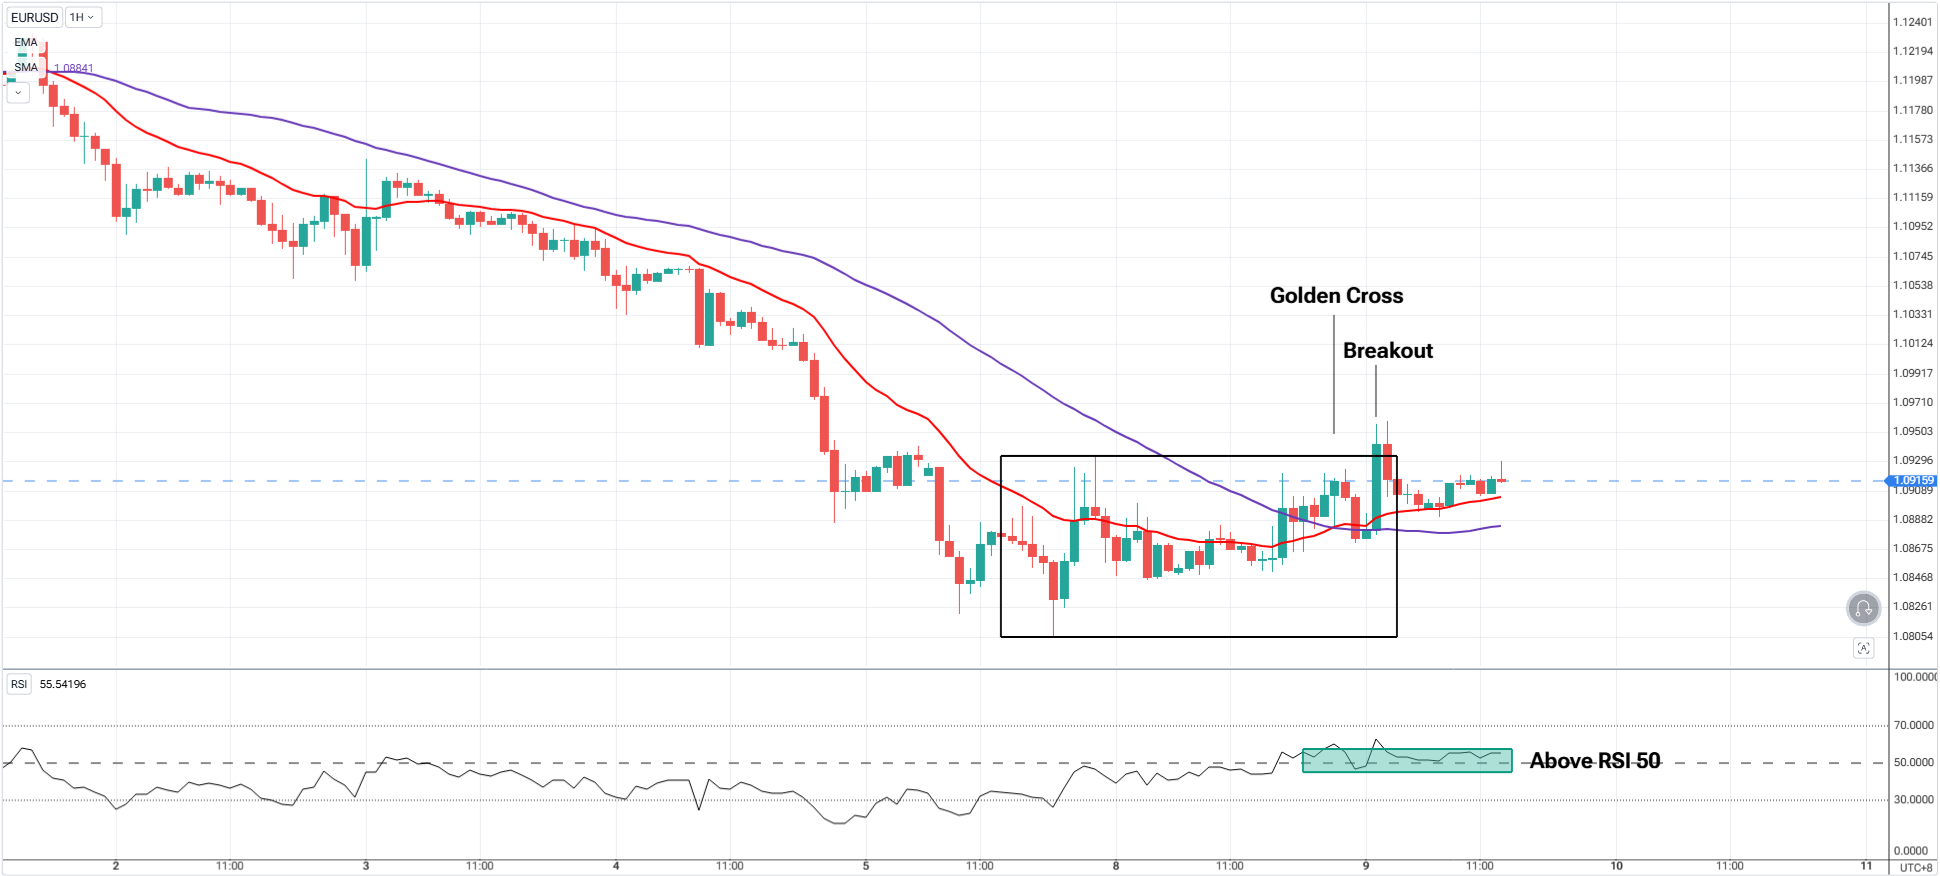
| Strong Momentum | Weak Momentum |
|---|---|
| RSI above 50 (uptrend) | RSI drops below 50 (no go) |
| RSI makes higher lows | RSI sideways or overbought |
| RSI supports breakout | RSI divergence or fading |
Don’t just trust RSI levels — watch the RSI trend itself.

Great question — and this is where context matters.
In the previous lesson, we focused on pullback entries — buying when price dips into moving averages or Fibonacci zones within a trend.
So why are we now telling you to look for breakouts?
Because sometimes, there is no clean pullback — and waiting for one means missing the move entirely.
Another: There are times that price will fall short in pulling back on the moving averages.
| Situation | What to Look For | Strategy |
|---|---|---|
| Clean trend, price returns to MA | Bounce at 20 EMA or 50 SMA | ✅ Pullback Entry |
| Strong trend, no deep pullback | Price keeps pushing and consolidates above MAs | ✅ Breakout Entry |
| Sideways chop or weak trend | MA and RSI not aligned | ❌ Wait |
Sometimes, price builds pressure just above the 20 EMA. It doesn’t dip — it compresses, then explodes upward.
In that case:
Instead of waiting for a dip that never comes, you enter the breakout when all the signs align.
This flexibility lets you capture more opportunities without violating your system — because the MA and RSI are still your foundation.
You’re not “changing” your system — you’re adapting the entry style (pullback vs. breakout) to the trend’s behavior, while still using moving average + RSI confluence to filter the trade.
At this point:
Now you need one last thing: confirmation from the candles themselves.
Here’s how to spot it:
Look for a reaction at 20 EMA or 50 SMA:
RSI should:
Enter on candle close after confirmation.
If price stays above 20 EMA and forms a tight range:
Entry trigger: Break of short-term high + bullish candle close
Confirmation: No breakdown below 20 EMA + strong RSI
| Entry Type | Stop-Loss Strategy |
|---|---|
| 20 EMA Pullback | Below swing low or wick under EMA |
| 50 SMA Pullback | Below structure or zone of interest |
| Breakout Entry | Below breakout range or structure |
| Aggressive RSI Entry | Below entry candle or minor structure |
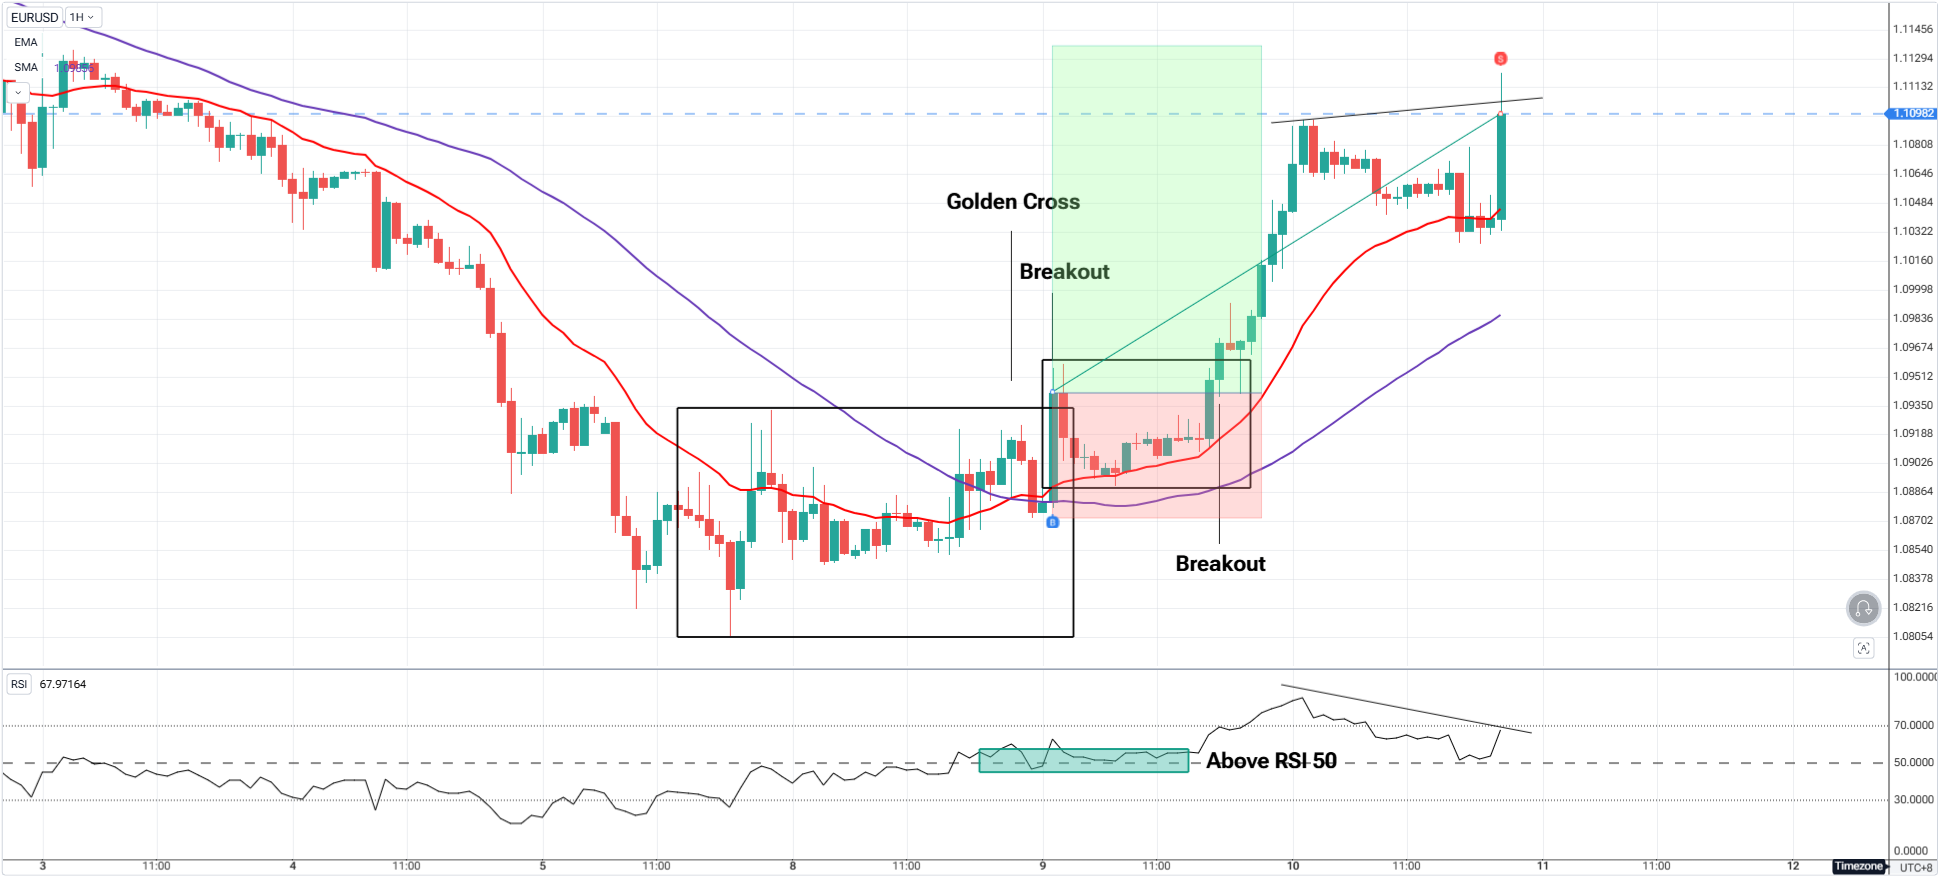

When price moves with power, your job is to ride it with logic — not guess.
This strategy gives you a trend filter (moving averages) and a momentum meter (RSI) — two of the most reliable tools when used together.
You now have the complete playbook to:
Trend + Momentum = High-Probability Trading.
Here’s your action plan:
When these tools align — don’t hesitate. Ride the momentum with structure and confidence.
Open a free demo account today and experience institutional-grade spreads, lightning-fast execution, and all the tools you need to grow as a trader.
It’s time to go from theory to execution - risk-free.
Create an Account. Start Your Free Demo!
How To Trade & Scalp Indices at the Open Using Smart Money Concepts (SMC)
How to Trade Breakouts Effectively in Day Trading with Smart Money Concepts
Complete Step-by-Step Guide to Day Trading Gold (XAU/USD) with Smart Money Concepts (SMC)
The Power of Multi-Timeframe Analysis in Smart Money Concepts (SMC)
Forex Trading Strategy for Beginners
Mastering Candlestick Pattern Analysis with the SMC Strategy for Day Trading
Mastering Risk Management: Stop Loss, Take Profit, and Position Sizing
How to Use Fibonacci to Set Targets & Stops (Complete Guide)
RSI Divergence Trading Strategy for Gold: How to Identify and Trade Trend Reversals
Stochastics Trading Secrets: How to Time Entries in Trending Markets using Stochastics
Gold Trading Stochastics Strategy: How to Trade Gold with 2R–3R Targets
RSI Hidden Divergence Explained: How to Spot Trend Continuations Like a Pro
Why Smart Money Concepts Work in News-Driven Markets - CPI, NFP, and More
How to Trade NFP Using Smart Money Concepts (SMC)-A Proven Strategy for Forex Traders
How to Trade CPI Like Smart Money - A Step-by-Step Guide Using SMC
How to Start Trading Indices and Get into the Stock Market with Low Capital (2025 Guide)
Best Indices to Trade for Day Traders | NASDAQ, S&P 500, DAX + Best Times to Trade Them
How To Trade & Scalp Indices at the Open Using Smart Money Concepts (SMC)
NAS100 - How to Trade the Nasdaq Like a Pro (Smart Money Edition)
How to Trade CPI Like Smart Money - A Step-by-Step Guide Using SMC
Why Smart Money Concepts Work in News-Driven Markets - CPI, NFP, and More
How to Swing Trade Gold (XAU/USD) Using Smart Money Concepts: A Simple Guide for Traders
Complete Step-by-Step Guide to Day Trading Gold (XAU/USD) with Smart Money Concepts (SMC)
The Ultimate Guide to Backtesting and Trading Gold (XAU/USD) Using Smart Money Concepts (SMC)
Why Gold Remains the Ultimate Security in a Shifting World
How to Trade Candlestick Patterns with High Probability: A Complete Guide for Beginners
The Top Japanese Candlestick Guide: What is an Engulfing Pattern and How to Trade It?
Piercing Pattern Candlestick Explained: How to Trade It - Step-By-Step Guide
Morning & Evening Star Candlestick Patterns – How to Trade Market Reversals with Confidence
5 Steps to Start Day Trading: A Strategic Guide for Beginners
8 Steps How to Start Forex Day Trading in 2025: A Beginner’s Step-by-Step Guide
3 Steps to Build a Trading Routine for Consistency and Discipline - Day Trading Edition
The Ultimate Guide to Understanding Market Trends and Price Action
Trading with Momentum: The Best Trading Session to Trade Forex, Gold and Indices
How to Identify Risk-On and Risk-Off Market Sentiment: A Complete Trader’s Guide
How to Trade Risk-On and Risk-Off Sentiment - With Technical Confirmation
The Ultimate Guide to Understanding Market Trends and Price Action
Why Smart Money Concepts Work: The Truth Behind Liquidity and Price Action
Mastering the Market with Smart Money Concepts: 5 Strategic Approaches
Mastering Candlestick Pattern Analysis with the SMC Strategy for Day Trading
Understanding Liquidity Sweep: How Smart Money Trades Liquidity Zones in Forex, Gold, US Indices
The SMC Playbook Series Part 4: How to Confirm Trend Reversal & Direction using SMC
The SMC Playbook Series Part 5: The Power of Multi-Timeframe Analysis in Smart Money Concepts (SMC)
Fair Value Gaps Explained: How Smart Money Leaves Footprints in the Market
The Best Time to Use Smart Money Concepts (SMC): Why Timing Is Everything in Trading SMC
How to Trade the London Session Using Smart Money Concepts (SMC)
The Mental Game of Execution - Debunking the Common Trading Psychology
5 Steps to Backtest a Trading Strategy with AI: A Step-by-Step Guide
Managing Trading Losses: Why You Can Be Wrong and Still Win Big in Trading
The Hidden Threat in Trading: How Performance Anxiety Sabotages Your Edge
Why You Fail in Trading: You Don’t Have Enough Capital to Survive
Why 90% of Retail Traders Fail Even with Profitable Trading Strategies
The Top 10 Best Trading Books That Changed My Mindset, Strategy & Performance
Discovering Your Trader Profile: What Kind of Trader Are You?
Follow me for more daily market insights!
Jasper Osita - LinkedIn - FXStreet - YouTube
This content may have been written by a third party. ACY makes no representation or warranty and assumes no liability as to the accuracy or completeness of the information provided, nor any loss arising from any investment based on a recommendation, forecast or other information supplies by any third-party. This content is information only, and does not constitute financial, investment or other advice on which you can rely.
ACY Securities is one of Australia's fastest growing multi-asset online trading providers, offering ultra-low-cost trading, rock-solid execution, technologically superior account management and premium market analysis.
Select the categories and companies you wish to follow directly to your person rss feed.
Create Custom RSS FeedSign up and join over 5,000 professional members who receive personalized news alerts, curated professional connections, and more for free!
Sterling steadies after political uncertainty rattled gilt markets, while EUR/USD and EUR/GBP approach key technical levels ahead of today's European session.
GBP/AUD remains trapped in a well-defined bearish trend on both the weekly and daily timeframes.
Discover the key drivers, technical levels, and central bank expectations shaping the EUR/USD trend as the ECB prepares to hold rates and markets watch for a potential breakout.
Sydney-based multi-asset broker ACY Securities has introduced PAXGUSD, a new CFD instrument that allows clients to trade tokenised gold against the US Dollar 24 hours a day, seven days a week. The instrument is available across MetaTrader 4, MetaTrader 5, and the ACY Trading Platform.
Binance has lowered its VIP 3 Wallet Assets threshold from $3 million to $1 million and will now count OTC Spot Trading Volume at a 4x multiplier toward VIP qualification, removing the previous VIP 4 cap and allowing eligible users to progress through the full tier framework up to VIP 9.
Retail futures trading leader NinjaTrader Group has appointed Mark Omens as Senior Vice President, Commercial Strategy, bringing a 25-year veteran of derivatives marketplace CME Group into a newly created role focused on exchange partnerships and enterprise growth.
Gold Price Action Forecast: Will XAU/USD Drop to $3930? Meta Description: Read our Gold price action forecast to see if XAU/USD will drop to $3930.
BitDelta Securities Financial Services LLC (“BitDelta Securities”) today announced that it has received full regulatory approval from the Capital Market Authority (“CMA”) of the United Arab Emirates under the Category 5 — Arrangement and Advice license framework (License No. 20200000439). The approval follows the firm's receipt of In-Principal Approval earlier this year and represents the successful conclusion of the CMA's full licensing process, including the satisfaction of capital requirements, governance appointments, and operational setup.
Crypto.com has received a $400 million strategic investment from Citadel Securities, valuing the firm at $20 billion. It marks the first institutional funding round in the company's history, aimed at accelerating its expansion into tokenised securities, derivatives and other asset classes.
WTI’s pullback into $79–82 is the first major test of the bullish Elliott Wave count, with buyers targeting a renewed break above $85.


