just now

Liquidity Finder Ltd is incorporated in England and Wales, company number 10610740, registered address 167-169 Great Portland Street, Fifth Floor, London W1W 5PF, United Kingdom.
Published: just now


Goal of This Lesson:
To teach you how to recognize true displacement and imbalance—the footprints left behind when smart money aggressively enters the market. This helps you filter false moves and only trust setups backed by real institutional power.
By the End of This Lesson, You Should Be Able To:
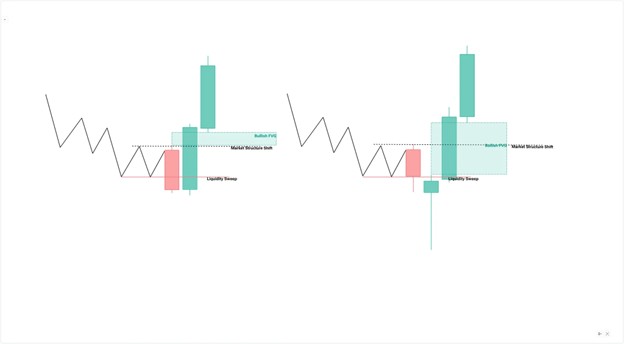
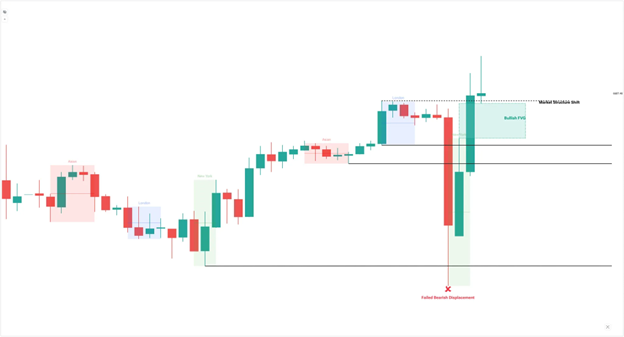
Displacement is a sudden, impulsive move in price away from a certain level caused by heavy, one-sided order flow—typically by institutional traders.
This usually occurs after a liquidity level has been filled or swept and creates an imbalance or fair value gap. If institutions are now in the market, a market structure shift must occur.
Displacement Parameters based on SSS Framework:
Displacement isn’t just a big candle. Its a combination of candles that shows a willingness to move to a certain direction.
It’s a move that sweeps liquidity, breaks structure, creates imbalance, and shows clear directional intent.
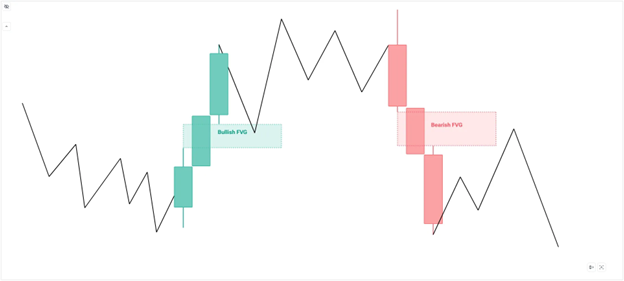
Imbalance refers to a zone where price moved so fast in one direction that there was little or no opportunity for opposite orders to be filled.
This creates a Fair Value Gap (FVG)—a visual clue that the market left something behind.

This is usually formed after a displacement has took place. A good displacement should create inefficiencies or gaps that it leaves unfilled orders due to a strong expansive move.

Imagine a crowd of people sprinting out of a building all at once—some doors swing wide open, some close behind them.
That rush is displacement.
The doors left half-open? That’s the imbalance—where someone might come back to re-enter later.
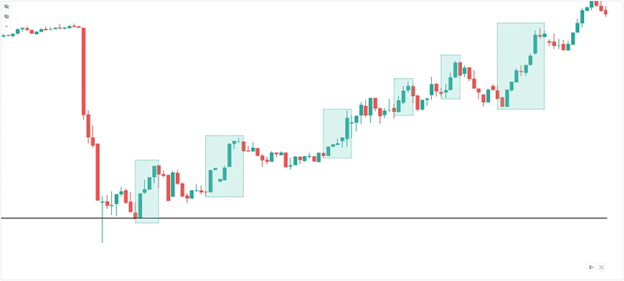
In this case, we are already in a bullish leg after price created a bullish sequence with higher highs and higher lows.
2. Drop down to a lower timeframe to frame the trend direction.

Your higher timeframe trend must be in-sync or aligned with the lower timeframe.
3. Wait for the kill-zone or a key market session; London or New York session.
Mark out the kill-zones. These levels are based on time: Asian, London, New York Session.
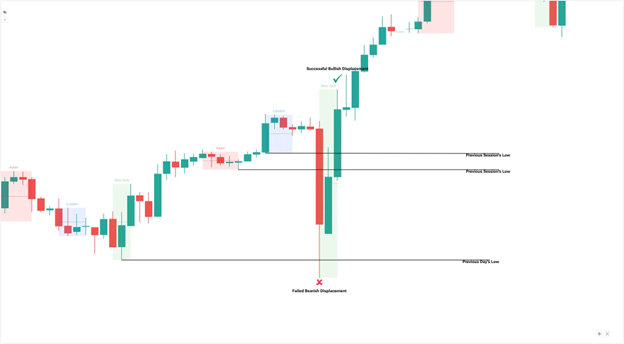
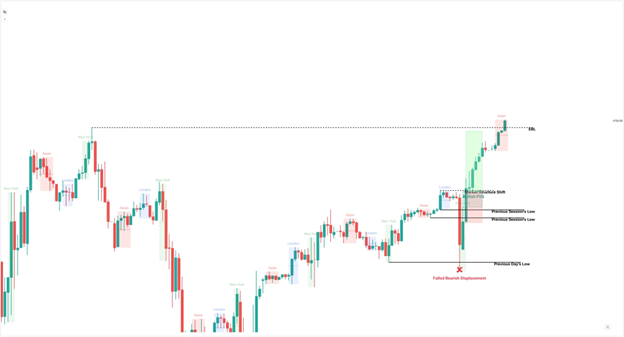
4. Watch for sweep of a Key Level.
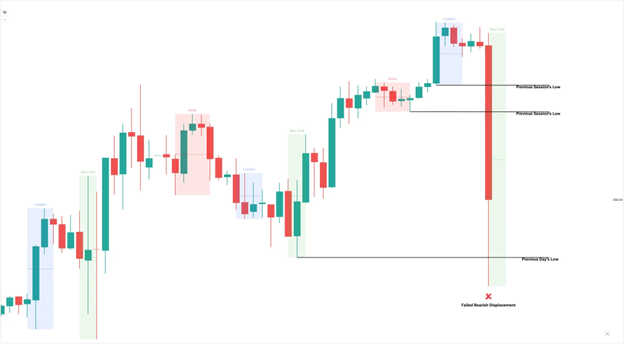
5. Wait for displacement candle (impulse move that breaks structure).
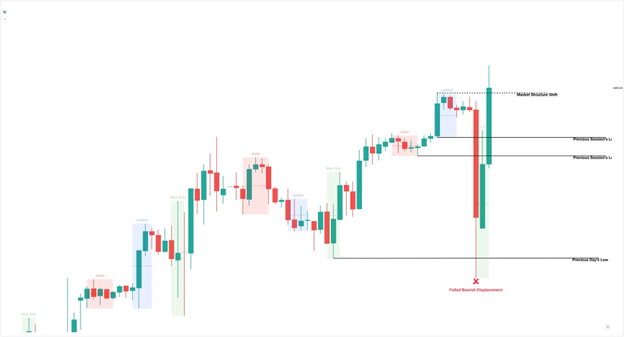
6. Mark the FVG it creates. Use that FVG for the entry on the retrace.
7. Set SL just beyond the fair value gap, TP at next ERL.
Displacement is what gives your FVG validity. No displacement = no trade.
Example Flow:
You didn’t chase a breakout—you waited for sweep, surge, and shift.

Don’t trade every big candle.
If the move didn’t:
…it’s probably not a true institutional displacement.
At this stage, you now understand what displacement and imbalance look like — and more importantly, what they reveal: smart money stepping in with purpose.
But here’s the next big question:
How do you confirm that this wasn’t just a fast move… but the beginning of a real shift in direction?
This is where many traders jump in too early — they see a big candle, maybe even a gap, and assume a trend has begun.
But institutional traders don’t guess. A tell-tell sign that institutions are already in is there must be a market structure shift in the direction where the displacement took place.
That brings us to one of the most critical parts of your SMC foundation:
These aren’t just patterns — they are your confirmation tools. MSS tells you a shift is underway. BOS tells you the shift is real. Together, they form the structural map that institutions follow after a liquidity grab.
This is how you’ll know when to act — and more importantly, when not to.
Part 4: How to Confirm Trend Direction with Market Structure Breaks & Shifts (SMC Guide) is up next!
ACY Securities is one of Australia's fastest growing multi-asset online trading providers, offering ultra-low-cost trading, rock-solid execution, technologically superior account management and premium market analysis.
Select the categories and companies you wish to follow directly to your person rss feed.
Create Custom RSS FeedSign up and join over 5,000 professional members who receive personalized news alerts, curated professional connections, and more for free!
Index volatility is asleep while single stocks fight it out underneath, credit refuses to confirm the equity rally, and a bare macro calendar hands next week to oil.
Digital assets and FX brokerage GC Exchange FZE (GCEX) has appointed Mohammed A. Mulla as a Board Member of its Dubai-based entity, part of the wider GCEX Group.
Learn what Blockchain-as-a-Service is, how it works, and why businesses are using BaaS to build blockchain applications without managing infrastructure.
CFDs vs stocks compared on leverage, ownership, costs, dividends, taxes, and risk. Learn the differences between stocks and CFDs and discover which suits your investing or trading goals.
Want to master the markets? A winning trading mindset beats a perfect strategy. Learn how emotional discipline helps you conquer fear and avoid heavy losses.
Read our latest Gold price action forecast to see how a double top pattern triggered a massive XAU/USD selloff.
Wondering how the API weekly report impacts oil prices? Learn how U.S. crude stockpiles and voluntary surveys predict the official EIA report.
cTrader Mobile 5.9 introduces a dedicated charts tab, single-tap chart access, a draggable floating action panel and a new focus mode for positions and orders, following the platform's Best Mobile Trading App win at UF Awards Global 2026. Sergey Borisov of Spotware comments on the update.
BitPay B.V., the European arm of BitPay, has been authorised as a crypto-asset service provider under MiCA by the Dutch AFM, allowing it to offer regulated crypto and stablecoin payment services, cross-border payments, and consumer spending tools across the EU.
Spotex has appointed Joe Tuccio, previously Head of Digital Partnerships at Seabury Capital, as Head of Digital Assets. Tuccio brings 20 years of financial markets experience and will lead partnerships with liquidity providers and custodians as Spotex expands its institutional FX venue into digital assets.