just now

Liquidity Finder Ltd is incorporated in England and Wales, company number 10610740, registered address 167-169 Great Portland Street, Fifth Floor, London W1W 5PF, United Kingdom.
Published: just now
The first week of June is going to stall, then become volatile with U.S. economic announcements stacked throughout the week.
Though there is a consensus of 98.7% chance for a rate hold in June, keep a close eye on the Fedwatch Tool as Powell speaks, unemployment claims, and May NFP data get released.
1. Powell Speaks (June 2, Mon)
Fed Chair Jerome Powell delivers remarks that could hint at the central bank’s rate outlook. Traders will watch closely for any shift in tone on inflation, labour markets, or timing of potential rate cuts.
2. Unemployment Claims (June 5, Thurs)
Weekly unemployment claims offer a real-time snapshot of labour market softness. A surprise spike could fuel rate cut bets; a dip could reinforce Fed caution.
3. Non-Farm Payrolls (June 6, Fri)
The big one. May’s NFP report, unemployment rate, and wage growth data will heavily influence market direction. Weak numbers could increase pressure on the Fed to act sooner, while strong data may delay cuts.
With these market movers in the chamber, S&P 500 could stall until the news provides a catalyst for movement. Traders will be watching Powell’s tone in the coming speech; with many believing that the Federal Reserve will maintain a rate cut in June.
However, any signs of dovishness will allow the markets to have breathing room; despite the on-and-off pattern of U.S. tariffs.
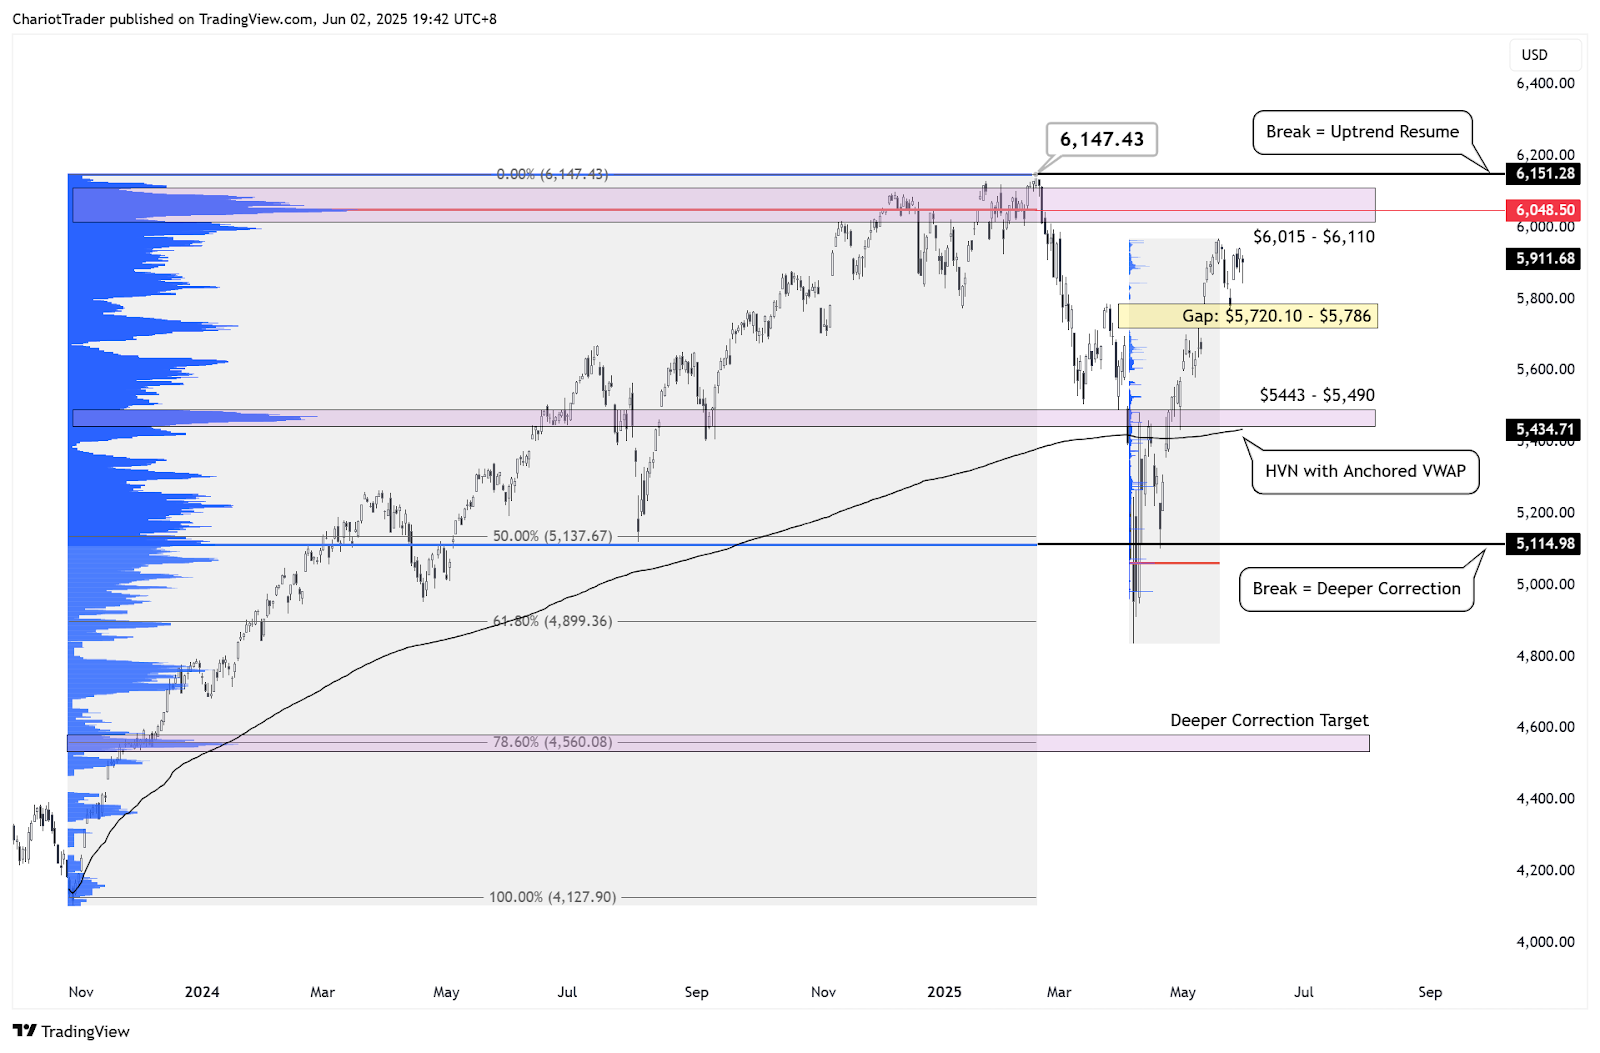
Looking at the daily chart’s volume profile (VP), we can notice a few things:
| 1️⃣ The SP 500 reclaimed its value area low (VAL) from its leg up starting from November 2024 to March 2025. |
| 2️⃣ The gap formed last month, despite having a small wick which technically closes it, is not closed. This is because the VP shows no volume being transacted. So there is a chance we return to the gap – which if broken signals a double top bearish reversal. |
| 3️⃣ The best level for a retrace is ~ $5,432 to $5,490 — a high volume node that aligns with the anchored vWAP from November ‘24. |
| 4️⃣ A break below the VAL at approx. $5,114.98 could signal a deeper correction towards the 78.6% Fibonacci at $4,560.08. |
| 5️⃣ A push up could be met with resistance with the High Volume Node (HVN) at $6,015 to $6,110. Further up is the value area high (VAH), which is also the All-Time-High at $6,147.43. |
Either way, caution is advised as the markets appear to be in a wait-and-see mode and is largely reactive to news.
You may also be interested in:
Key US & ECB Decisions, ISM Reports, and EUR/GBP Breakout Watch
DISCLAIMER: For educational purposes only. Trading comes with substantial risk, leading to possible loss of your capital. Traders are advised to do their own due diligence before investing.
Alchemy Markets is a multi-asset brokerage providing retail traders with the same elite trading conditions, tools, and transparency typically reserved for institutions.
Select the categories and companies you wish to follow directly to your person rss feed.
Create Custom RSS Feed
just now
Sign up and join over 5,000 professional members who receive personalized news alerts, curated professional connections, and more for free!
Retail futures trading leader NinjaTrader Group has appointed Mark Omens as Senior Vice President, Commercial Strategy, bringing a 25-year veteran of derivatives marketplace CME Group into a newly created role focused on exchange partnerships and enterprise growth.
Gold Price Action Forecast: Will XAU/USD Drop to $3930? Meta Description: Read our Gold price action forecast to see if XAU/USD will drop to $3930.
BitDelta Securities Financial Services LLC (“BitDelta Securities”) today announced that it has received full regulatory approval from the Capital Market Authority (“CMA”) of the United Arab Emirates under the Category 5 — Arrangement and Advice license framework (License No. 20200000439). The approval follows the firm's receipt of In-Principal Approval earlier this year and represents the successful conclusion of the CMA's full licensing process, including the satisfaction of capital requirements, governance appointments, and operational setup.
Crypto.com has received a $400 million strategic investment from Citadel Securities, valuing the firm at $20 billion. It marks the first institutional funding round in the company's history, aimed at accelerating its expansion into tokenised securities, derivatives and other asset classes.
WTI’s pullback into $79–82 is the first major test of the bullish Elliott Wave count, with buyers targeting a renewed break above $85.

BitDelta Securities has secured a full CMA Category 5 licence in the UAE and opened a regulated office in Business Bay, Dubai. The firm operates as an introducing broker, connecting investors with licensed international brokers across multiple asset classes, with CEO Dr. Demetrios Zamboglou commenting on the milestone.
Index volatility is asleep while single stocks fight it out underneath, credit refuses to confirm the equity rally, and a bare macro calendar hands next week to oil.
Digital assets and FX brokerage GC Exchange FZE (GCEX) has appointed Mohammed A. Mulla as a Board Member of its Dubai-based entity, part of the wider GCEX Group.
Learn what Blockchain-as-a-Service is, how it works, and why businesses are using BaaS to build blockchain applications without managing infrastructure.
CFDs vs stocks compared on leverage, ownership, costs, dividends, taxes, and risk. Learn the differences between stocks and CFDs and discover which suits your investing or trading goals.


