just now

Liquidity Finder Ltd is incorporated in England and Wales, company number 10610740, registered address 167-169 Great Portland Street, Fifth Floor, London W1W 5PF, United Kingdom.
Published: just now


To help you master the origins, structure, and practical use of Japanese candlesticks - the most powerful charting method for reading price action, understanding institutional behavior, and timing entries with precision.

Japanese candlesticks were developed in the 1700s by a Japanese rice trader named Munehisa Homma, often considered the father of price action. He traded at the Dojima Rice Exchange in Osaka - the first official futures market in the world.
Homma discovered that price is driven not just by supply and demand, but by trader emotion. He began to record price fluctuations using visual candles, noting the open, high, low, and close for each trading day. His system allowed him to anticipate price turns based on recurring psychological patterns - the foundation of what we still use today.
Fun Fact: Homma reportedly made over 100 consecutive winning trades using this system - centuries before the term "technical analysis" existed.
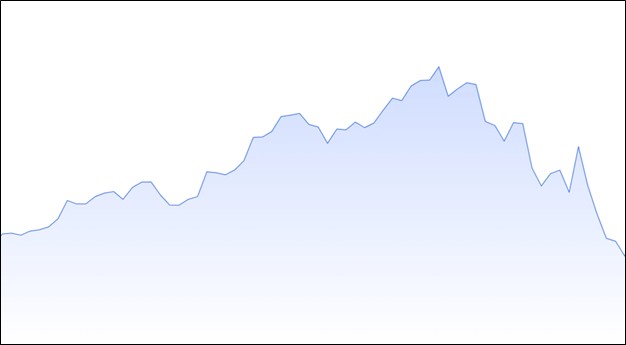
Imagine you’re watching a football game - but instead of seeing the full match, you’re only shown the final score. That’s what line charts do. You miss who was winning, momentum swings, and key plays.
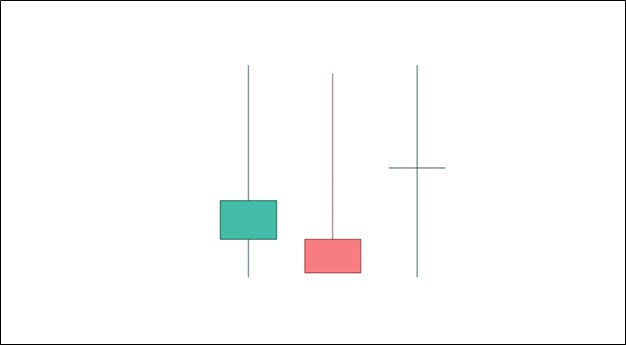
Candlestick charts are like watching the entire game in slow motion - you get to see when bulls were in control, when bears took over, and where the momentum shifted.
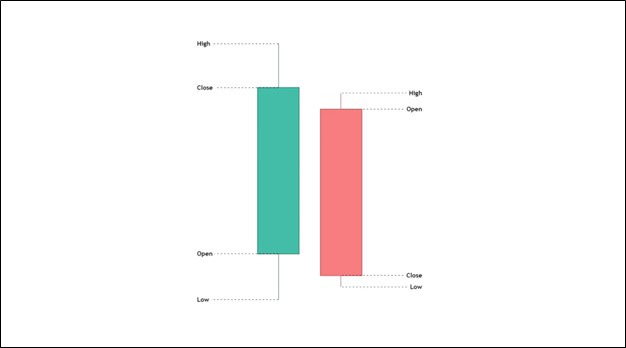
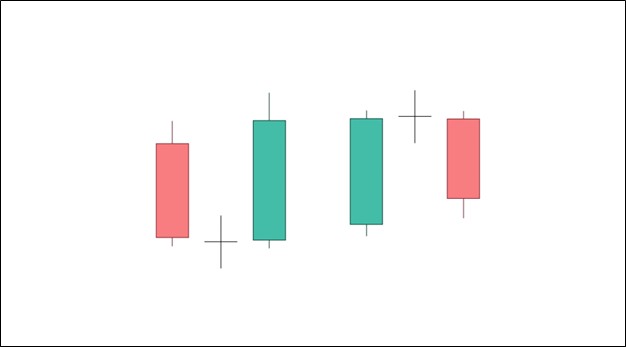
Each candlestick captures four key data points over a specific time period:
| Chart Type | Limitation |
| Line Chart | Shows only closing prices - no detail on highs/lows |
| Bar Chart | Similar info as candlesticks, but harder to read visually |
| Renko | Filters out noise, but ignores time and lacks real price movement |
| Heiken Ashi | Smooths trends but distorts actual price data |
| Candlestick | Easy to read, highly detailed, shows real momentum, rejection, and reversal signs |

Whether you’re using:
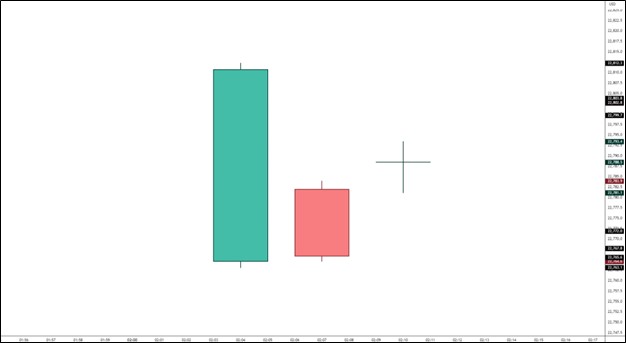
Candlestick patterns act as your confirmation trigger - they help time your entry, confirm your bias, or signal a possible shift in direction.
Quick Checklist When Reading a Candle
Ask yourself:
Pro Tips: How to Use Candlesticks Effectively

Japanese candlesticks are not just visual aids - they’re a universal language of price. They show strength, rejection, indecision, and intent in a way no indicator can. Whether you're trading Smart Money Concepts or classic price action, candle mastery is non-negotiable.
Learn to read candles, and you’ll learn to read the market.
Strategies That You Can Use:
How To Trade & Scalp Indices at the Open Using Smart Money Concepts (SMC)
How to Trade Breakouts Effectively in Day Trading with Smart Money Concepts
Complete Step-by-Step Guide to Day Trading Gold (XAU/USD) with Smart Money Concepts (SMC)
The Power of Multi-Timeframe Analysis in Smart Money Concepts (SMC)
Forex Trading Strategy for Beginners
Mastering Candlestick Pattern Analysis with the SMC Strategy for Day Trading
Mastering Risk Management: Stop Loss, Take Profit, and Position Sizing
RSI Divergence Trading Strategy for Gold: How to Identify and Trade Trend Reversals
Stochastics Trading Secrets: How to Time Entries in Trending Markets using Stochastics
Gold Trading Stochastics Strategy: How to Trade Gold with 2R–3R Targets
RSI Hidden Divergence Explained: How to Spot Trend Continuations Like a Pro
How To Trade News:
Why Smart Money Concepts Work in News-Driven Markets - CPI, NFP, and More
How to Trade NFP Using Smart Money Concepts (SMC)-A Proven Strategy for Forex Traders
How to Trade CPI Like Smart Money - A Step-by-Step Guide Using SMC
Learn How to Trade US Indices:
How to Start Trading Indices and Get into the Stock Market with Low Capital (2025 Guide)
Best Indices to Trade for Day Traders | NASDAQ, S&P 500, DAX + Best Times to Trade Them
How To Trade & Scalp Indices at the Open Using Smart Money Concepts (SMC)
NAS100 - How to Trade the Nasdaq Like a Pro (Smart Money Edition)
How to Trade CPI Like Smart Money - A Step-by-Step Guide Using SMC
Why Smart Money Concepts Work in News-Driven Markets - CPI, NFP, and More
How to Start Trading Gold:
How to Swing Trade Gold (XAU/USD) Using Smart Money Concepts: A Simple Guide for Traders
Complete Step-by-Step Guide to Day Trading Gold (XAU/USD) with Smart Money Concepts (SMC)
The Ultimate Guide to Backtesting and Trading Gold (XAU/USD) Using Smart Money Concepts (SMC)
Why Gold Remains the Ultimate Security in a Shifting World
How to Start Day Trading:
5 Steps to Start Day Trading: A Strategic Guide for Beginners
8 Steps How to Start Forex Day Trading in 2025: A Beginner’s Step-by-Step Guide
3 Steps to Build a Trading Routine for Consistency and Discipline - Day Trading Edition
The Ultimate Guide to Understanding Market Trends and Price Action
Learn how to navigate yourself in times of turmoil:
How to Identify Risk-On and Risk-Off Market Sentiment: A Complete Trader’s Guide
How to Trade Risk-On and Risk-Off Sentiment - With Technical Confirmation
The Ultimate Guide to Understanding Market Trends and Price Action
Want to learn how to trade like the Smart Money?
Why Smart Money Concepts Work: The Truth Behind Liquidity and Price Action
Mastering the Market with Smart Money Concepts: 5 Strategic Approaches
Mastering Candlestick Pattern Analysis with the SMC Strategy for Day Trading
Understanding Liquidity Sweep: How Smart Money Trades Liquidity Zones in Forex, Gold, US Indices
The SMC Playbook Series Part 4: How to Confirm Trend Reversal & Direction using SMC
The SMC Playbook Series Part 5: The Power of Multi-Timeframe Analysis in Smart Money Concepts (SMC)
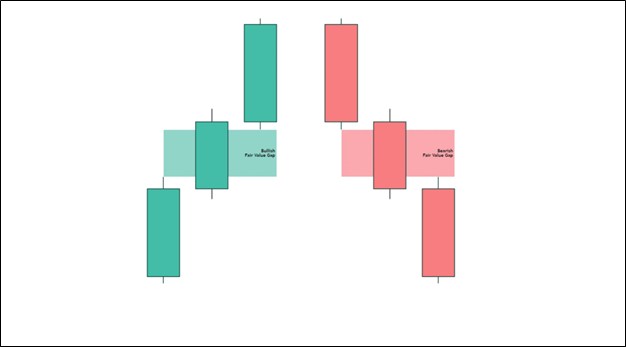
Fair Value Gaps Explained: How Smart Money Leaves Footprints in the Market
The Best Time to Use Smart Money Concepts (SMC): Why Timing Is Everything in Trading SMC
How to Trade the London Session Using Smart Money Concepts (SMC)
Trading Psychology and Continuous Improvement Contents:
The Mental Game of Execution - Debunking the Common Trading Psychology
5 Steps to Backtest a Trading Strategy with AI: A Step-by-Step Guide
Managing Trading Losses: Why You Can Be Wrong and Still Win Big in Trading
The Hidden Threat in Trading: How Performance Anxiety Sabotages Your Edge
Why You Fail in Trading: You Don’t Have Enough Capital to Survive
Why 90% of Retail Traders Fail Even with Profitable Trading Strategies
The Top 10 Best Trading Books That Changed My Mindset, Strategy & Performance
Follow me for more daily market insights!
Jasper Osita - LinkedIn - FXStreet - YouTube
This content may have been written by a third party. ACY makes no representation or warranty and assumes no liability as to the accuracy or completeness of the information provided, nor any loss arising from any investment based on a recommendation, forecast or other information supplies by any third-party. This content is information only, and does not constitute financial, investment or other advice on which you can rely.
ACY Securities is one of Australia's fastest growing multi-asset online trading providers, offering ultra-low-cost trading, rock-solid execution, technologically superior account management and premium market analysis.
Select the categories and companies you wish to follow directly to your person rss feed.
Create Custom RSS FeedSign up and join over 5,000 professional members who receive personalized news alerts, curated professional connections, and more for free!
Sterling steadies after political uncertainty rattled gilt markets, while EUR/USD and EUR/GBP approach key technical levels ahead of today's European session.
GBP/AUD remains trapped in a well-defined bearish trend on both the weekly and daily timeframes.
Discover the key drivers, technical levels, and central bank expectations shaping the EUR/USD trend as the ECB prepares to hold rates and markets watch for a potential breakout.
Sydney-based multi-asset broker ACY Securities has introduced PAXGUSD, a new CFD instrument that allows clients to trade tokenised gold against the US Dollar 24 hours a day, seven days a week. The instrument is available across MetaTrader 4, MetaTrader 5, and the ACY Trading Platform.
Binance has lowered its VIP 3 Wallet Assets threshold from $3 million to $1 million and will now count OTC Spot Trading Volume at a 4x multiplier toward VIP qualification, removing the previous VIP 4 cap and allowing eligible users to progress through the full tier framework up to VIP 9.
Retail futures trading leader NinjaTrader Group has appointed Mark Omens as Senior Vice President, Commercial Strategy, bringing a 25-year veteran of derivatives marketplace CME Group into a newly created role focused on exchange partnerships and enterprise growth.
Gold Price Action Forecast: Will XAU/USD Drop to $3930? Meta Description: Read our Gold price action forecast to see if XAU/USD will drop to $3930.
BitDelta Securities Financial Services LLC (“BitDelta Securities”) today announced that it has received full regulatory approval from the Capital Market Authority (“CMA”) of the United Arab Emirates under the Category 5 — Arrangement and Advice license framework (License No. 20200000439). The approval follows the firm's receipt of In-Principal Approval earlier this year and represents the successful conclusion of the CMA's full licensing process, including the satisfaction of capital requirements, governance appointments, and operational setup.
Crypto.com has received a $400 million strategic investment from Citadel Securities, valuing the firm at $20 billion. It marks the first institutional funding round in the company's history, aimed at accelerating its expansion into tokenised securities, derivatives and other asset classes.
WTI’s pullback into $79–82 is the first major test of the bullish Elliott Wave count, with buyers targeting a renewed break above $85.


