just now


Liquidity Finder Ltd is incorporated in England and Wales, company number 10610740, registered address 167-169 Great Portland Street, Fifth Floor, London W1W 5PF, United Kingdom.
Published: just now

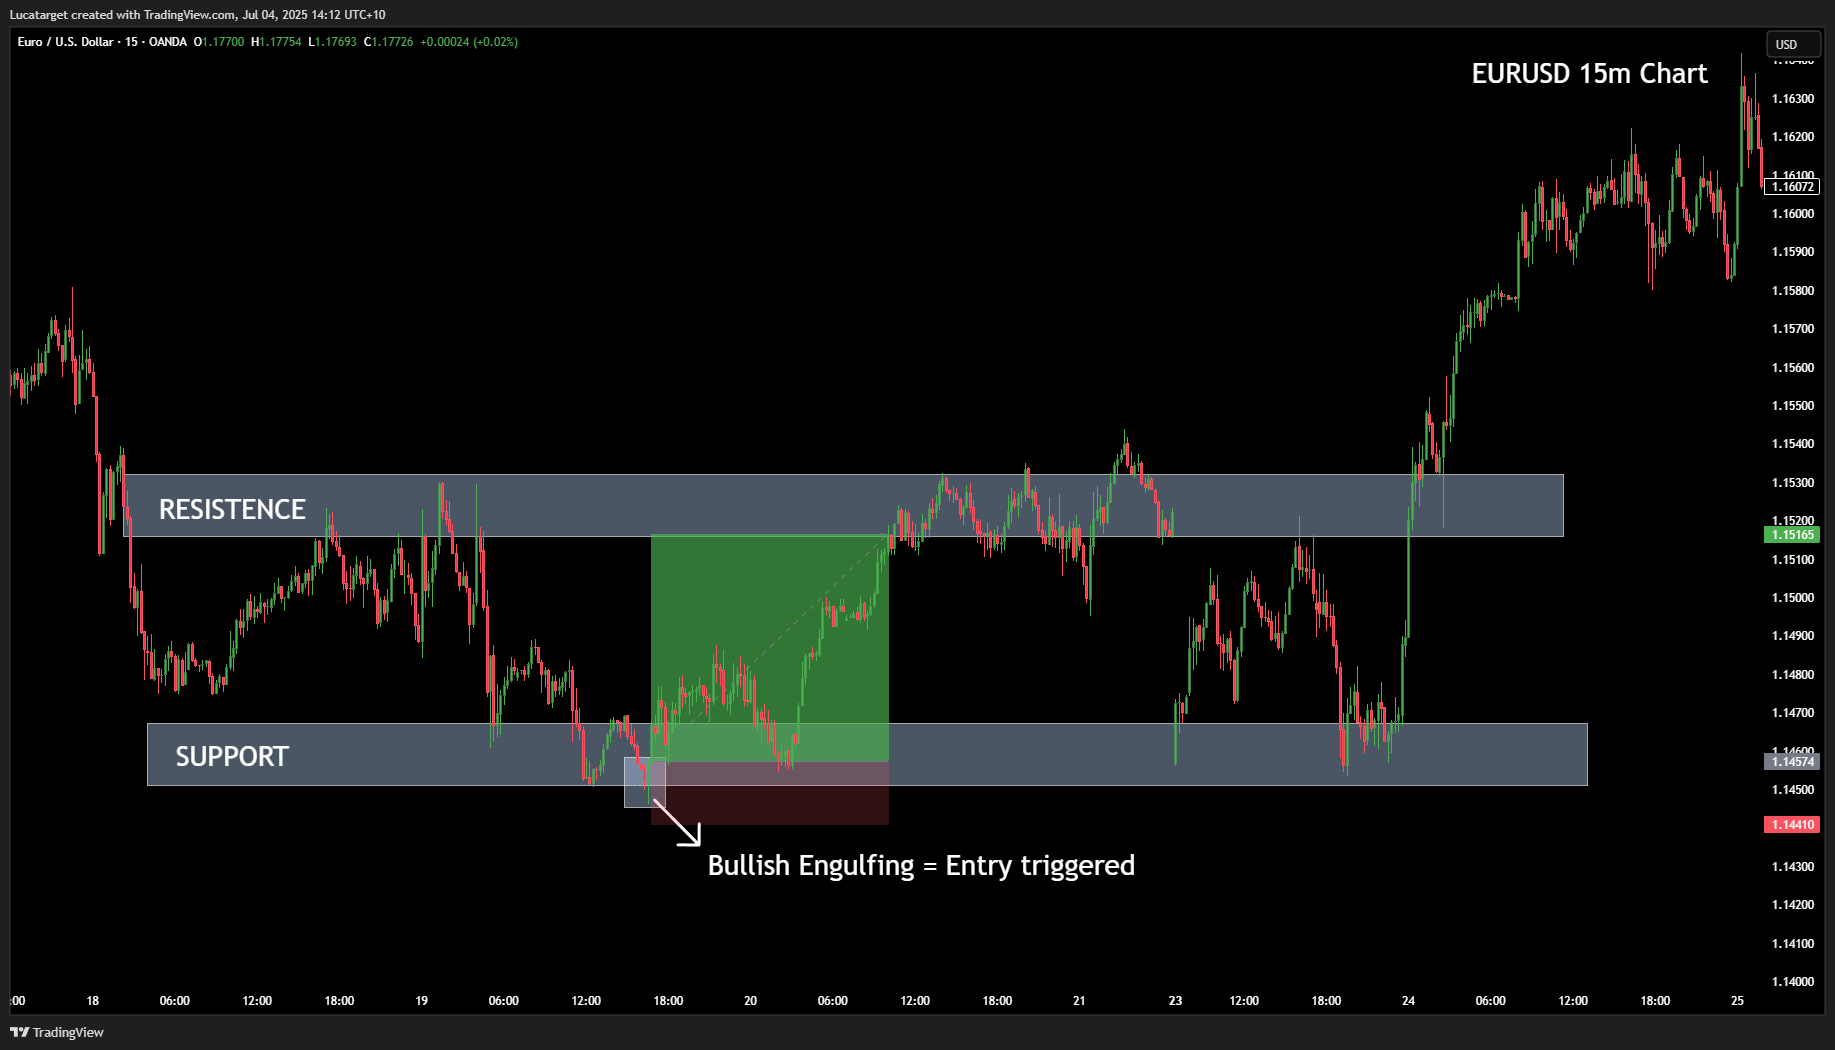
You're closely watching EUR/USD as it approaches a strong support zone after multiple failed attempts to break below.
An engulfing candle forms. You step in with confidence your entry is clean, your stop-loss is well-placed below the previous candle, and within minutes, the trade begins to move in your favor.
This is what precision feels like. And more importantly, it's what confidence through structure can offer.
The reality is simple: even the sharpest analysis loses its value if the entry is poor. You might risk too much, enter too late, or worse, get stopped out just before the market moves in your direction.
That’s why mastering reliable entry strategies is non-negotiable if you want to trade consistently.
Today, I’ll walk you through five entry strategies that I use daily. They are built for different market conditions and suit a variety of trading personalities from patient swing traders to fast-paced scalpers.
Each one is actionable, practical, and designed to improve your decision-making immediately.
Support and resistance are more than just lines on a chart. When used correctly, they offer some of the cleanest entries available.
In ranging conditions, prices often bounce between clearly defined horizontal levels. This is where the A-B-C entry structure comes into play.
The "A" setup is the gold standard. It occurs when price taps into the bottom of a range and shows signs of rejection.
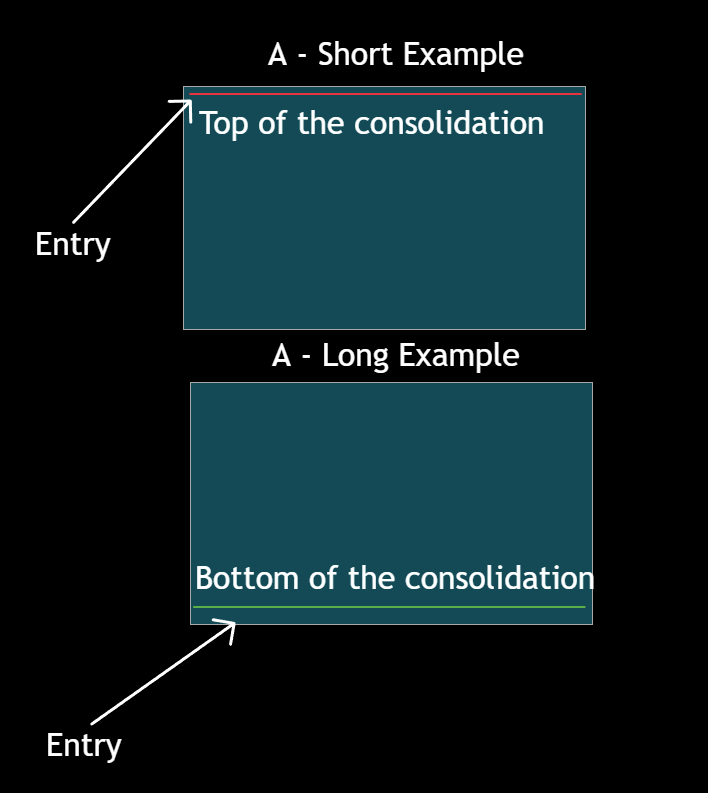
This could be a bullish engulfing candle, a long rejection wick, or a shift in momentum.
This is your most favorable entry: you buy close to support or sell close to the resistence, place your stop just below the most recent swing low, and let the trade develop naturally toward resistance/support.
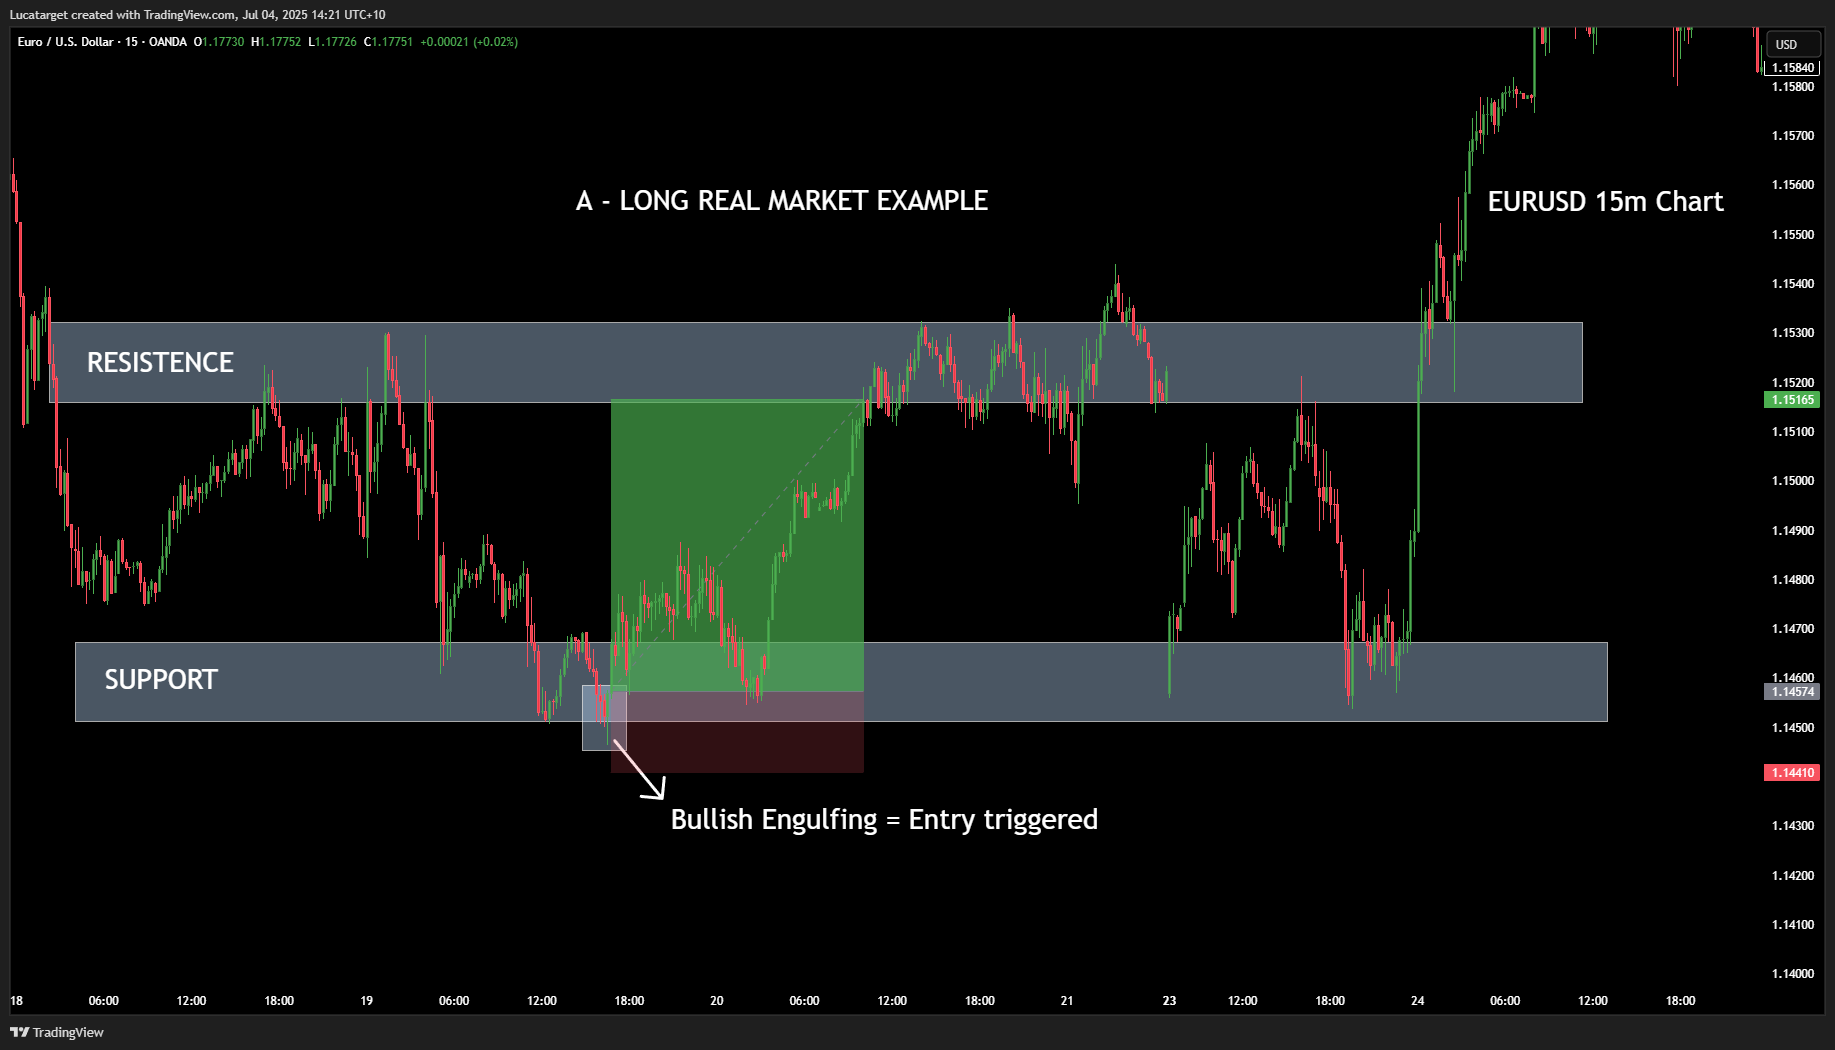
Here is a short trade example on EURUSD at 15m timeframe.
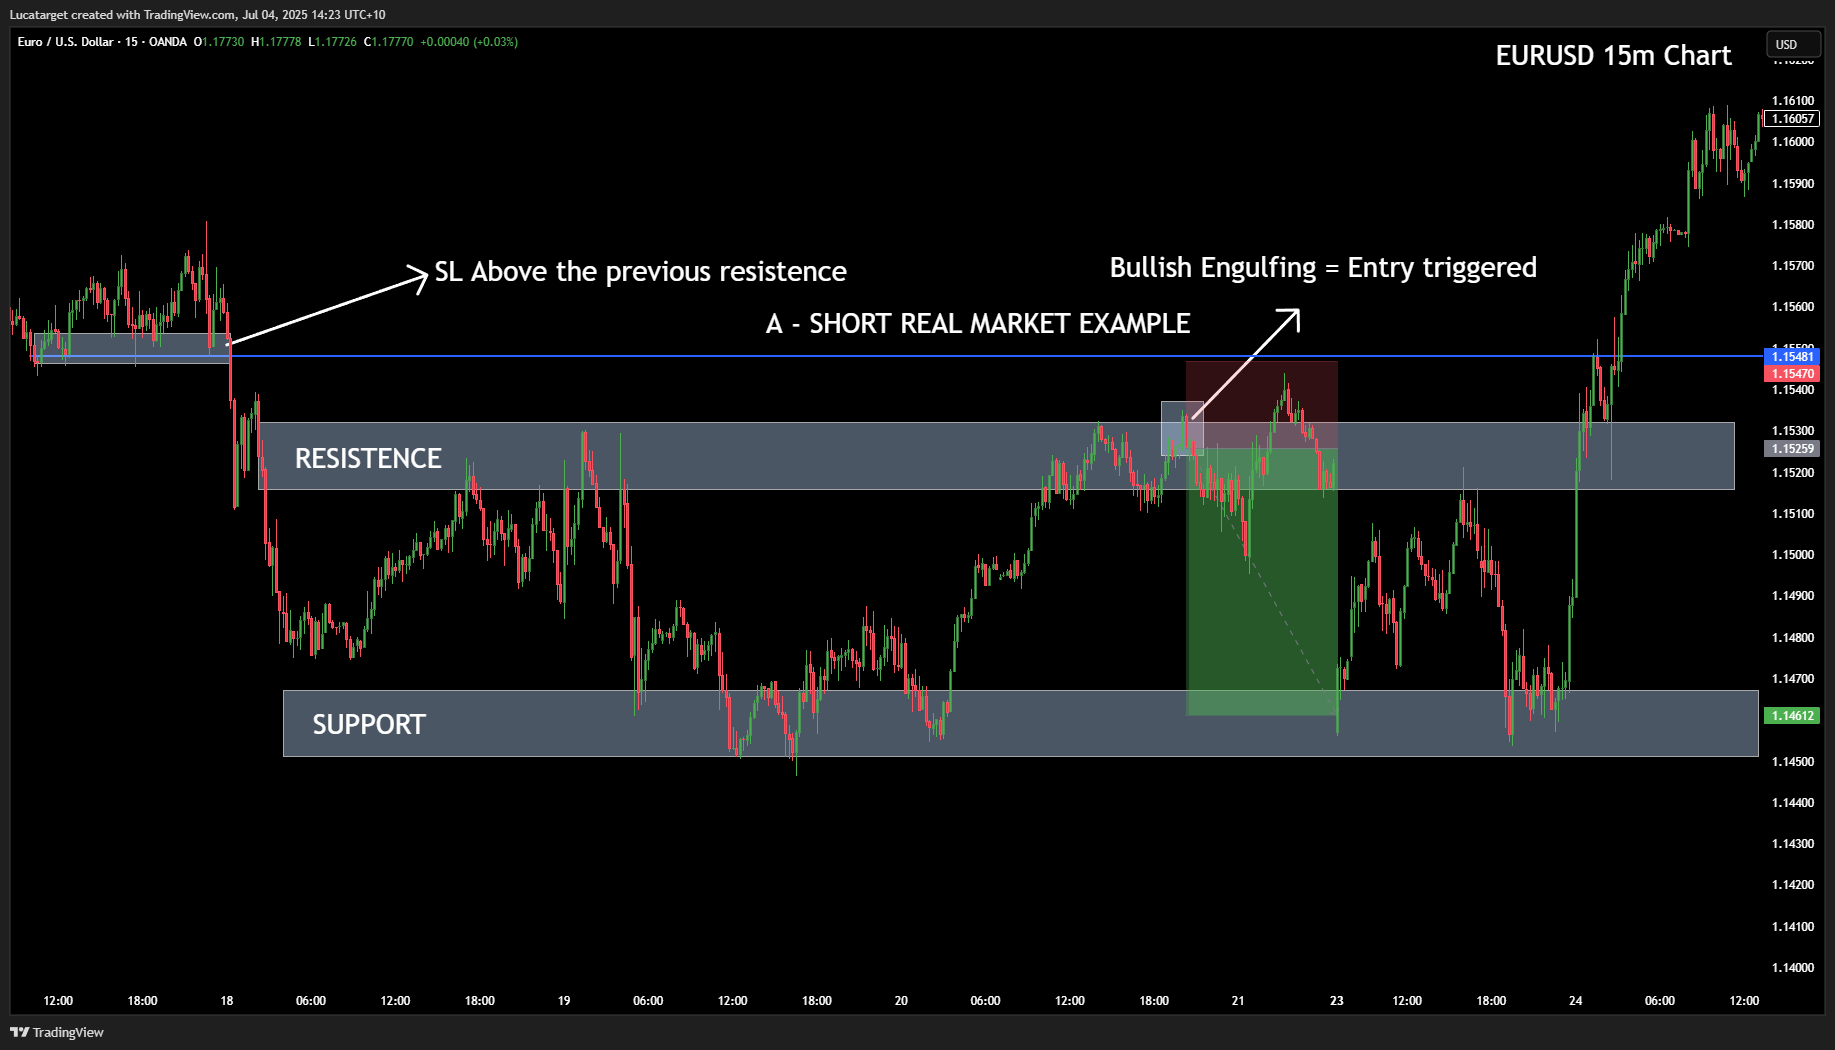
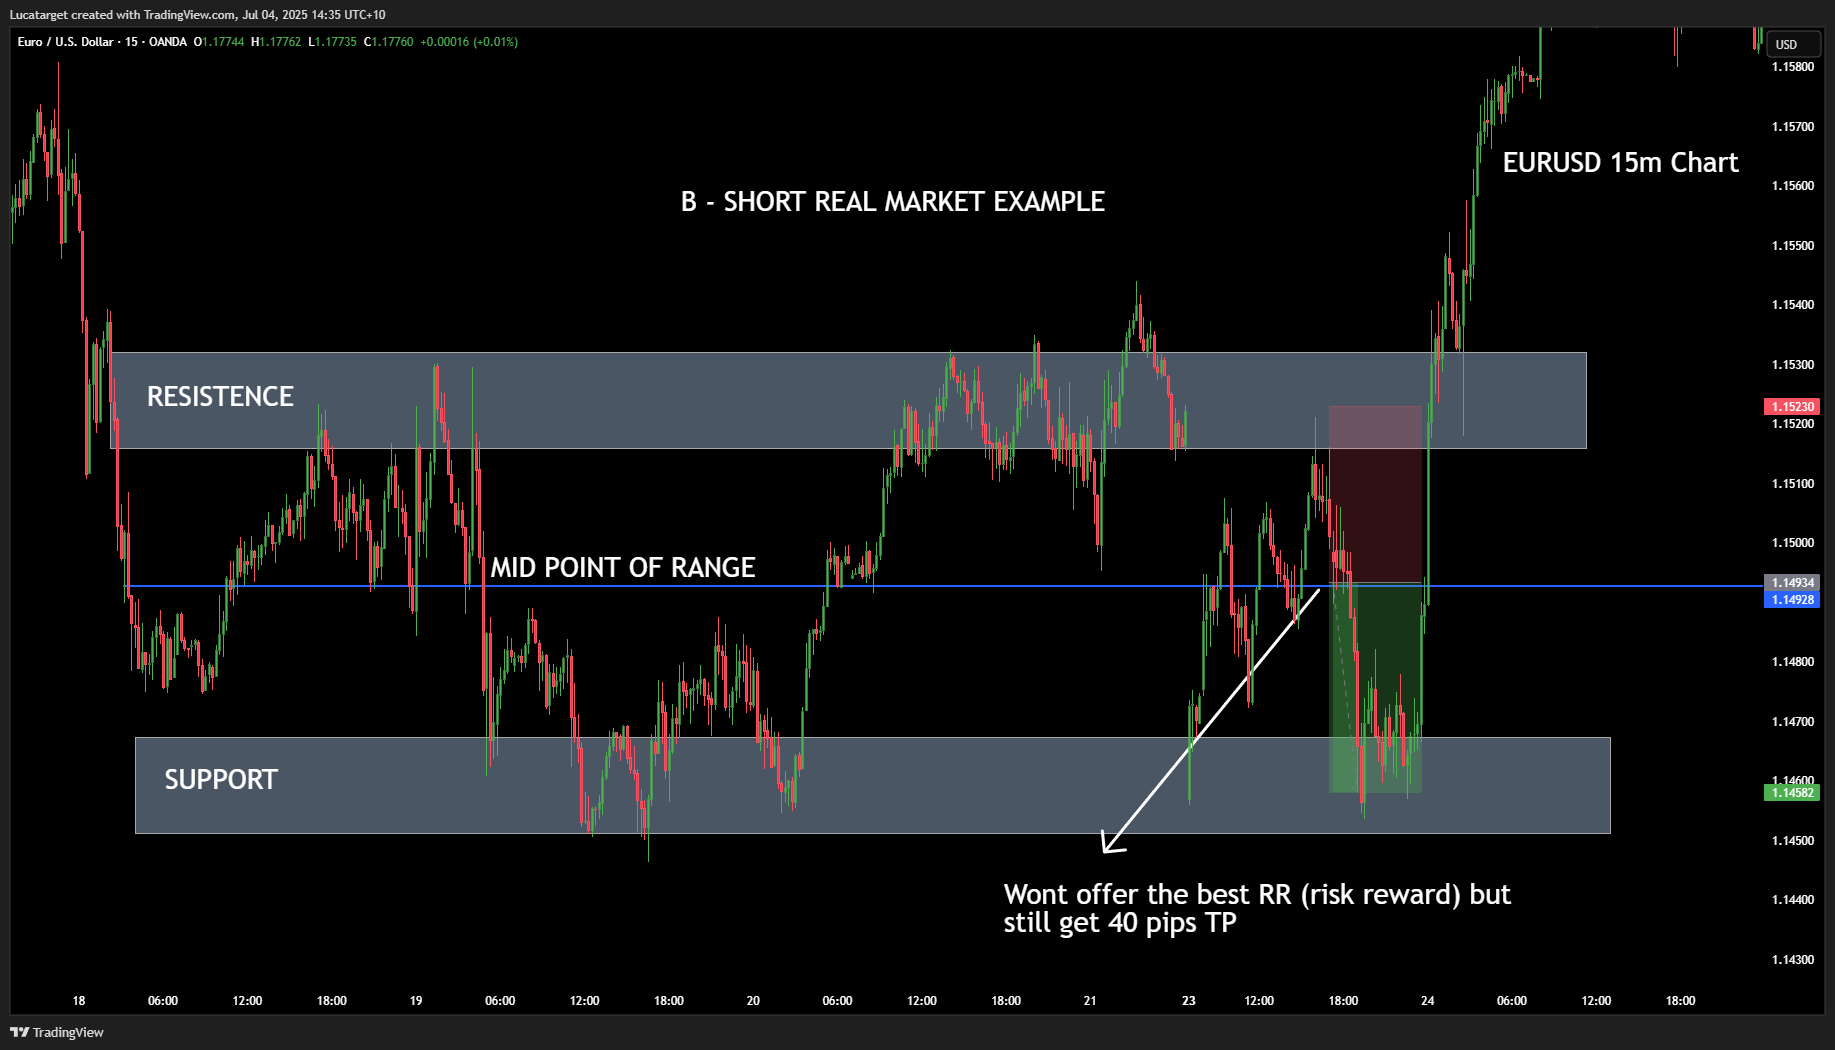
The "B" setup is more ambiguous. It takes place somewhere near the middle of the range.
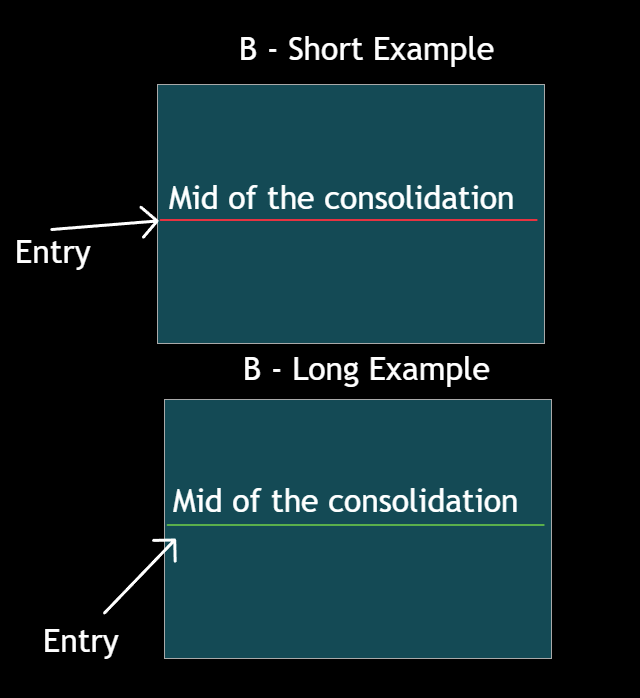
Here, directional bias isn’t as clear, so you need to rely on more confirmation, such as increased volume, candlestick behavior, or a lower timeframe break of structure.
Entries from this zone carry more risk and may offer less room for reward. But it still a great possibility if you believe that the market may follow up/down to break the resistence/support and you can extend your TP.
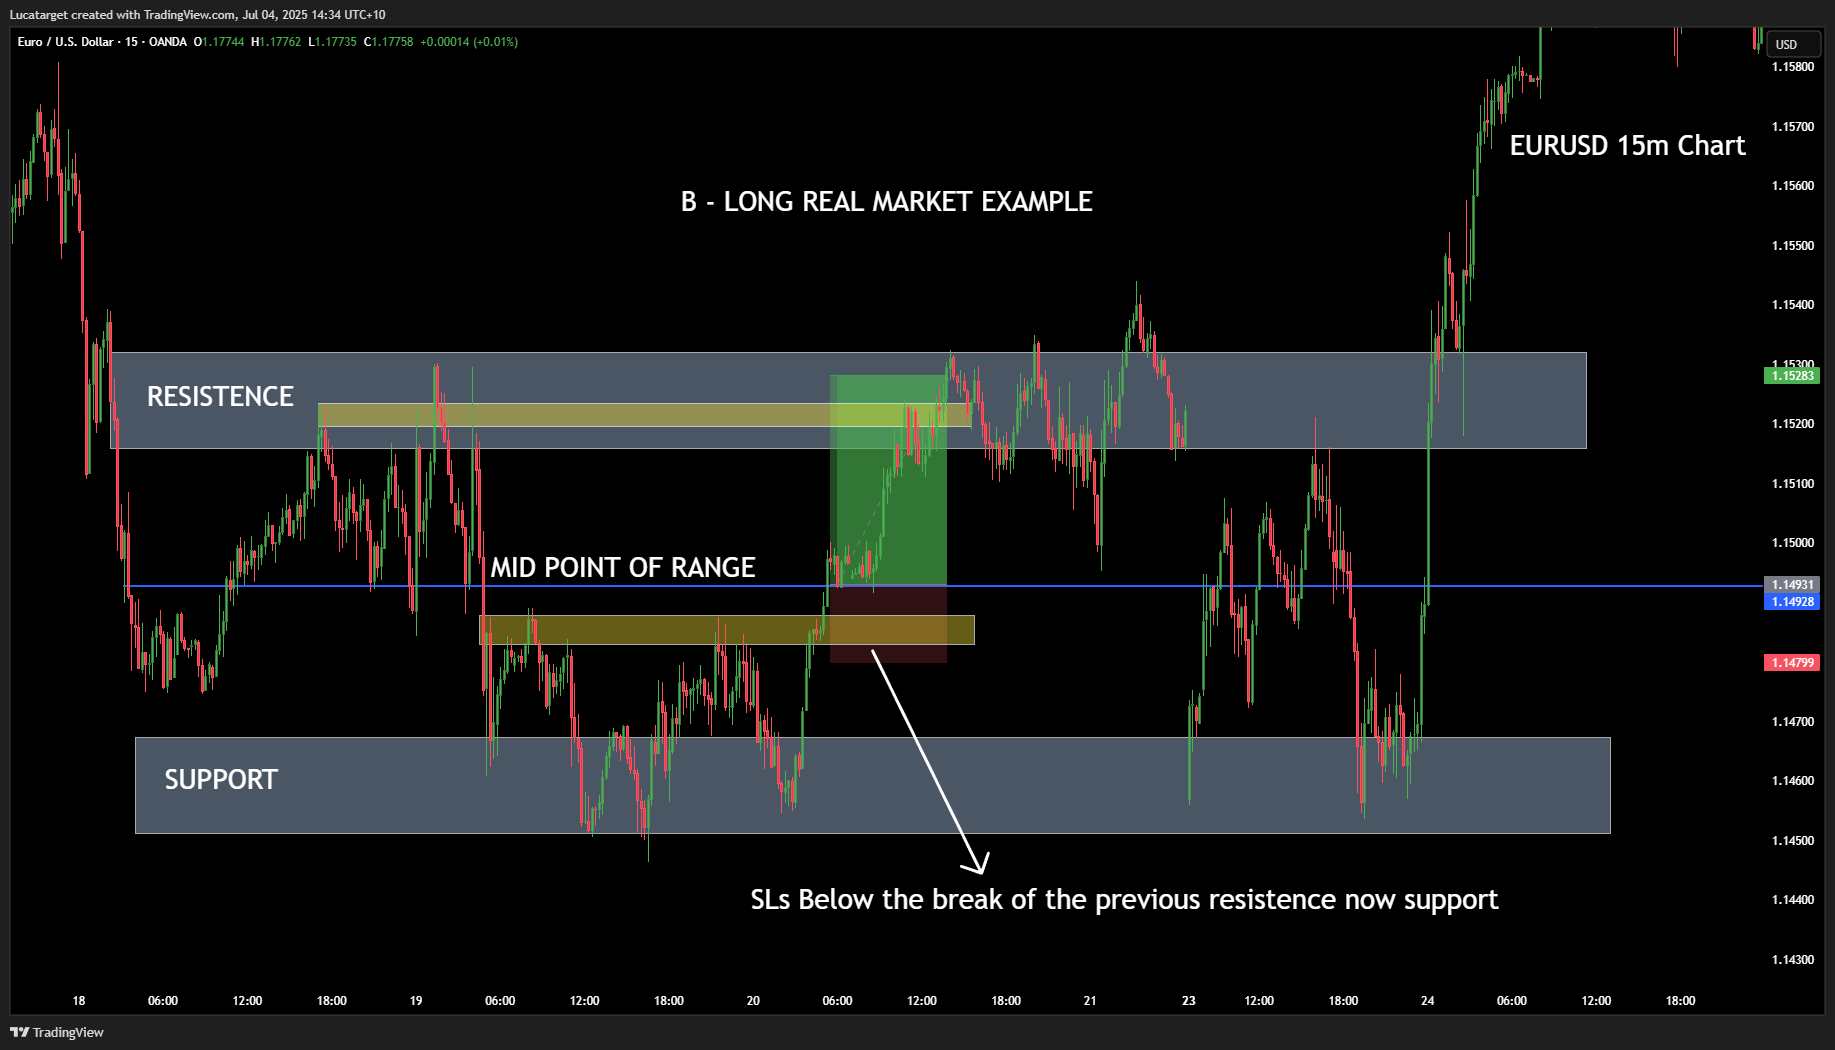
Here is another example if the short side now on the B entry type.
The "C" setup is more aggressive. You're either trying to catch a breakout above/below the range high/low (I prefer to catch the breakout than trying to short/long) or fade it with a short position expecting rejection.
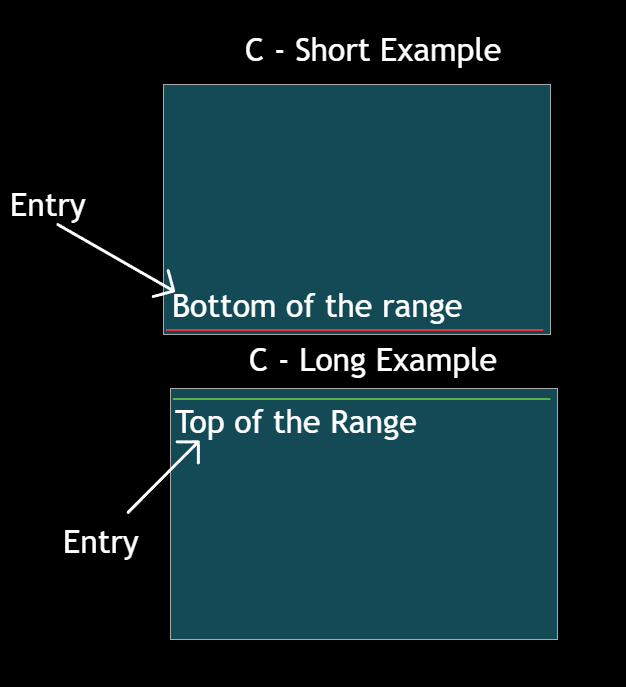
This is riskier because you're closer to resistance and further from any logical stop-loss placement. It should only be attempted when fundamentals or sentiment align clearly in one direction.
This setup thrives on patience and clean structure. It's easy to visualize, easy to backtest, and ideal for traders who prefer to trade fewer, higher-probability setups.
Momentum breakouts are designed for those who trade fast and think faster.
When price suddenly breaks through a key level with speed often triggered by economic news, data releases, or unexpected sentiment shifts this strategy helps you ride that volatility.
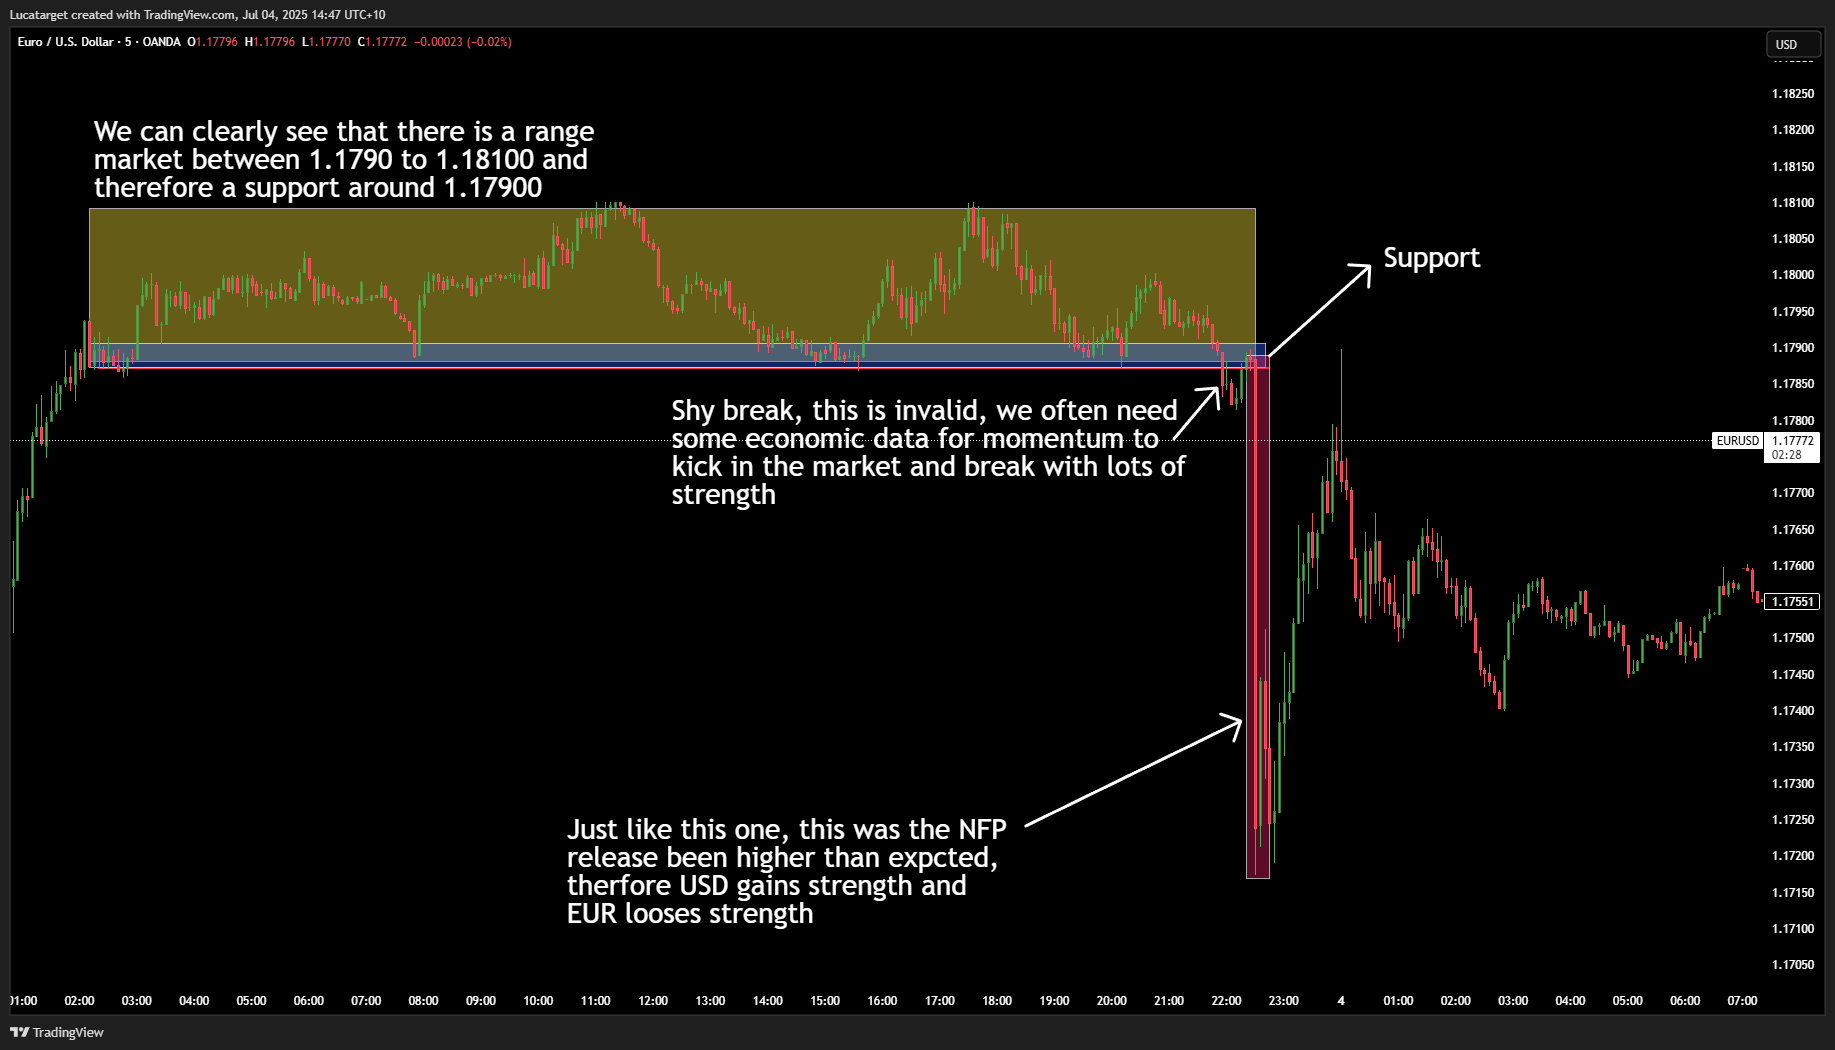
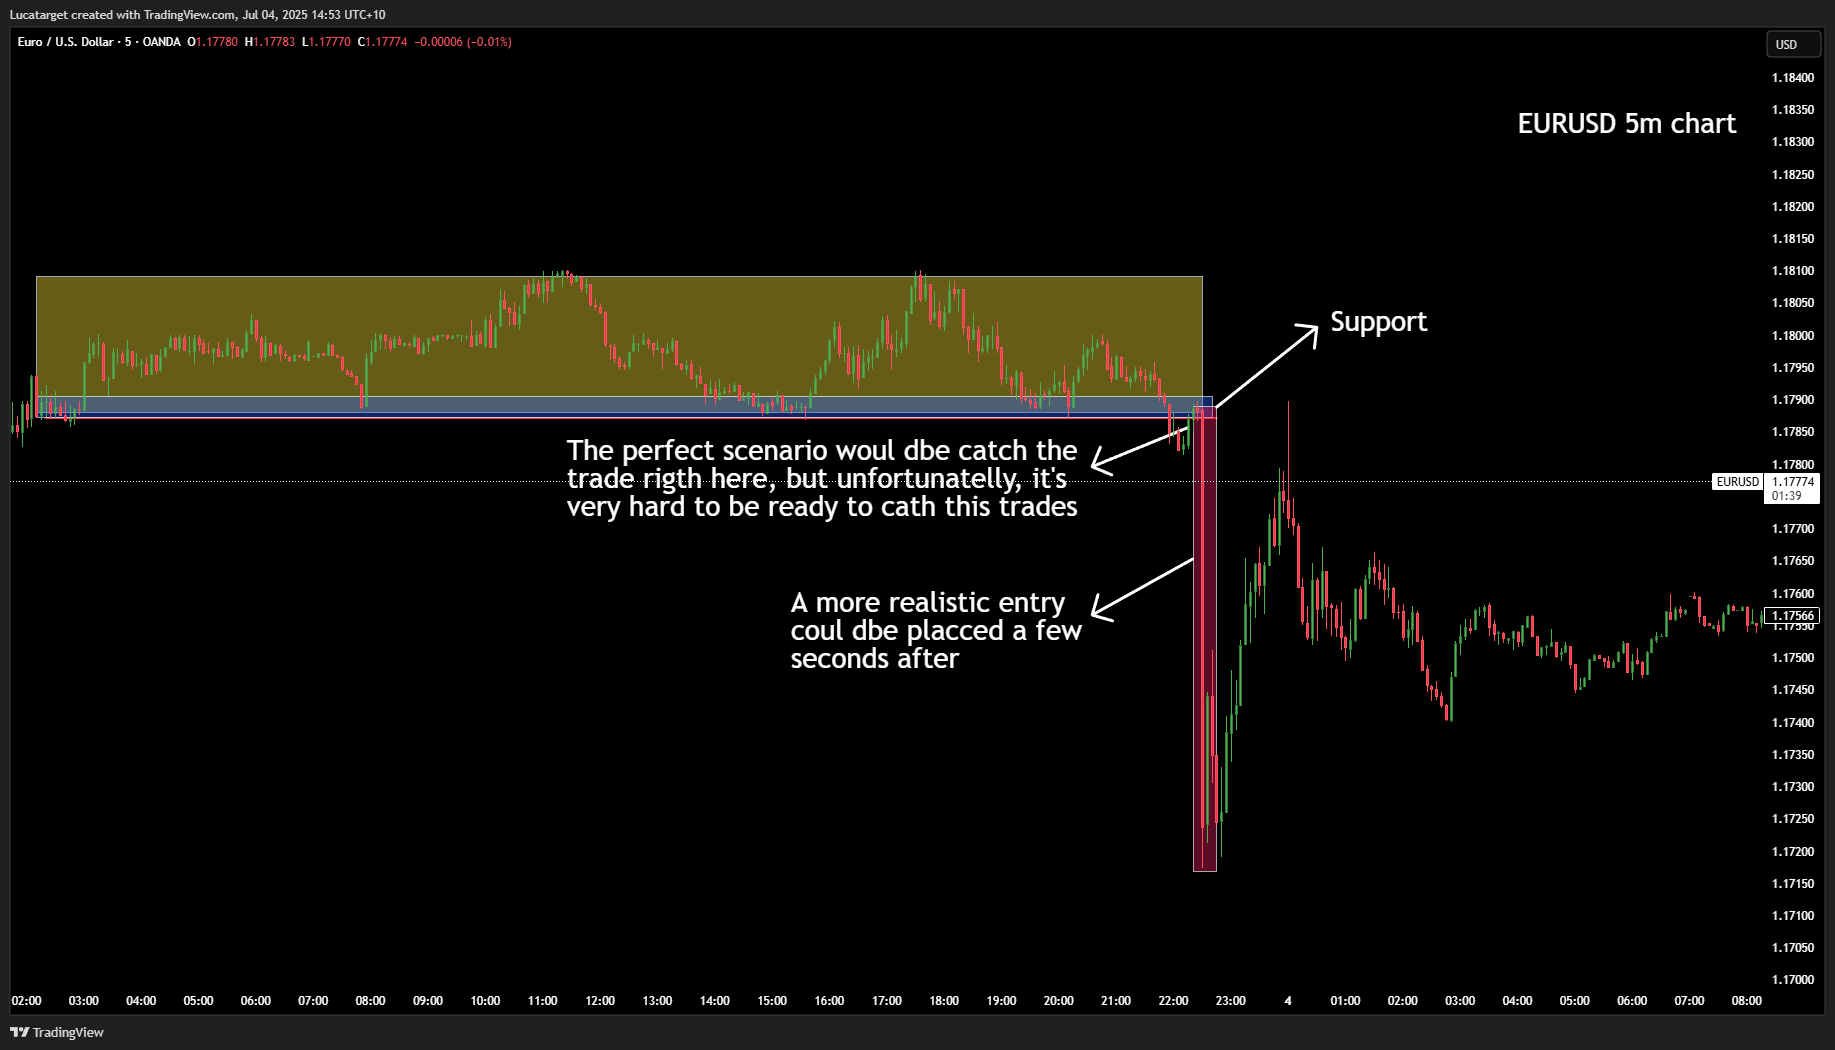
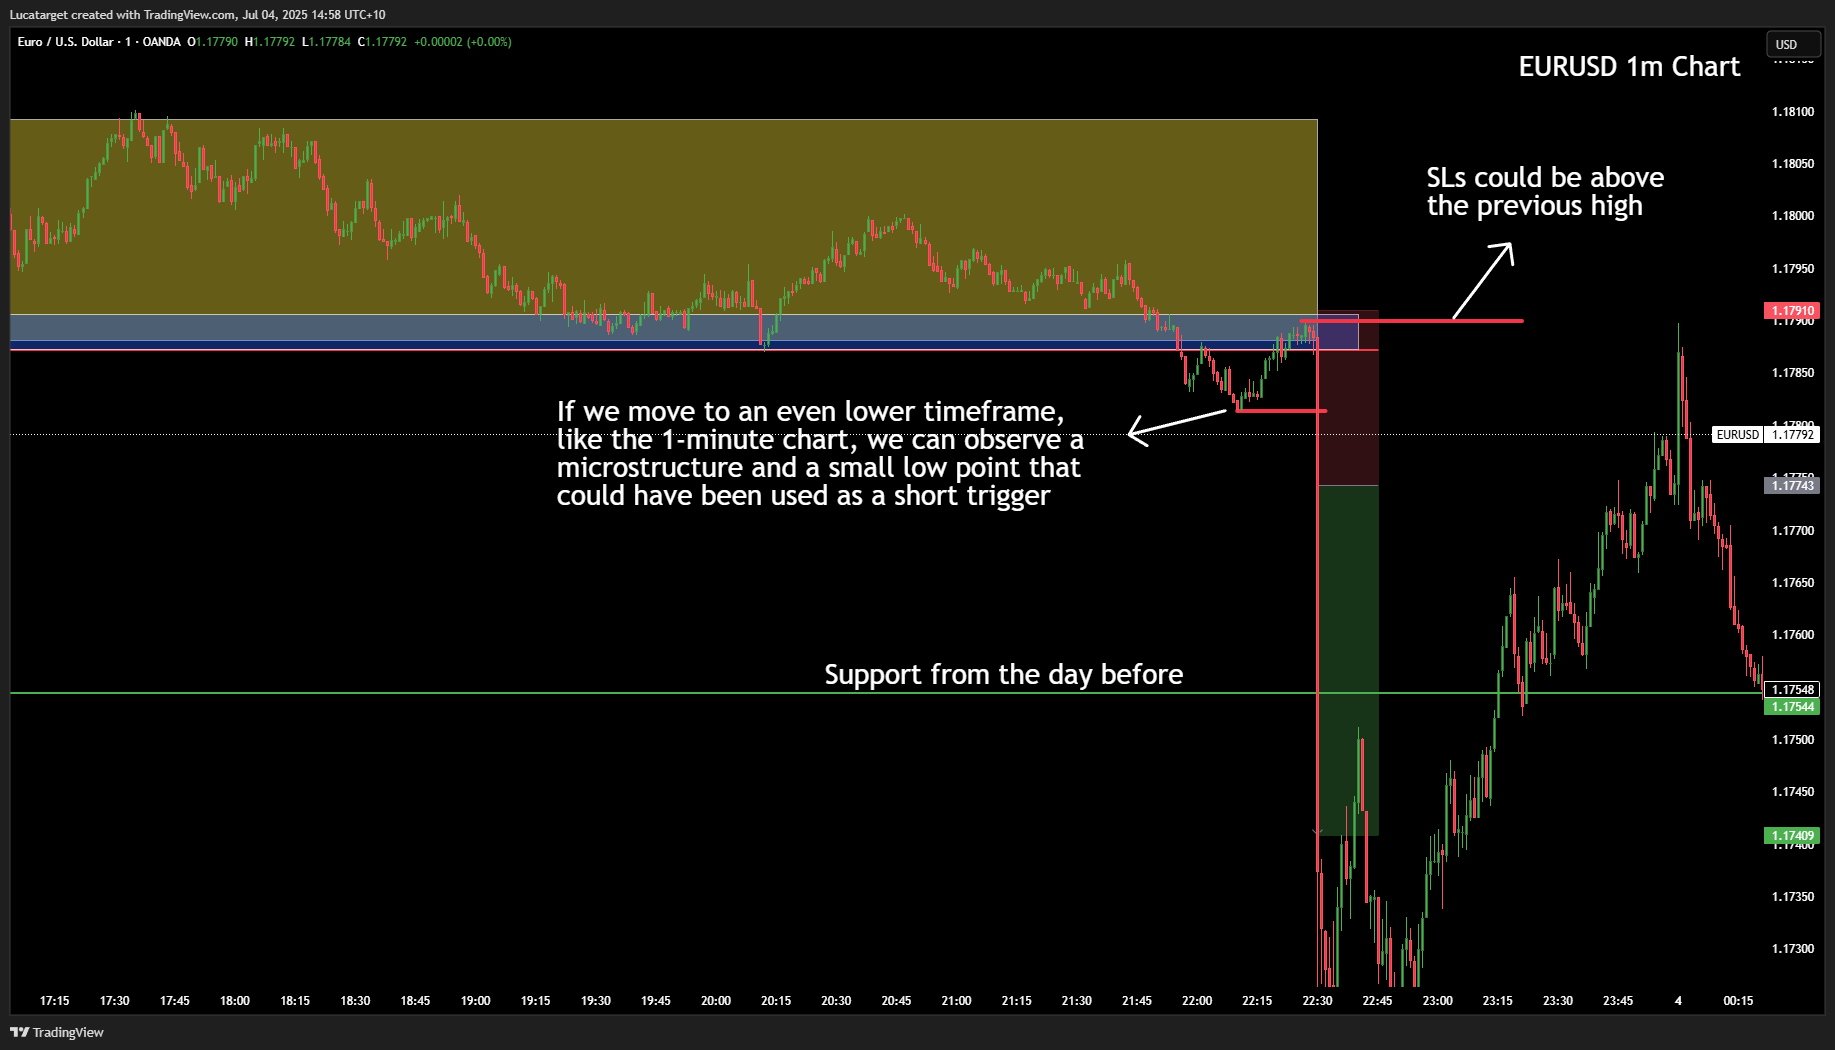
To manage risk, you must be tactical. Moving your stop-loss to break-even early is critical. Taking partial profits on the first push helps reduce emotional pressure.
This setup demands clarity and speed. It is not the place for hesitation.
Momentum breakouts are especially effective on lower timeframes (1M to 15M), during major sessions like London and New York, or around high-impact news events just like these NFP trade example.
Preparation is everything. Always map out your levels before the move happens.
When the market is already trending, the challenge isn’t finding direction it’s finding a way to get in without chasing. That’s where Fibonacci retracement levels come in.
This setup begins with identifying the most recent impulsive move a clear swing high to swing low in an uptrend, or vice versa.
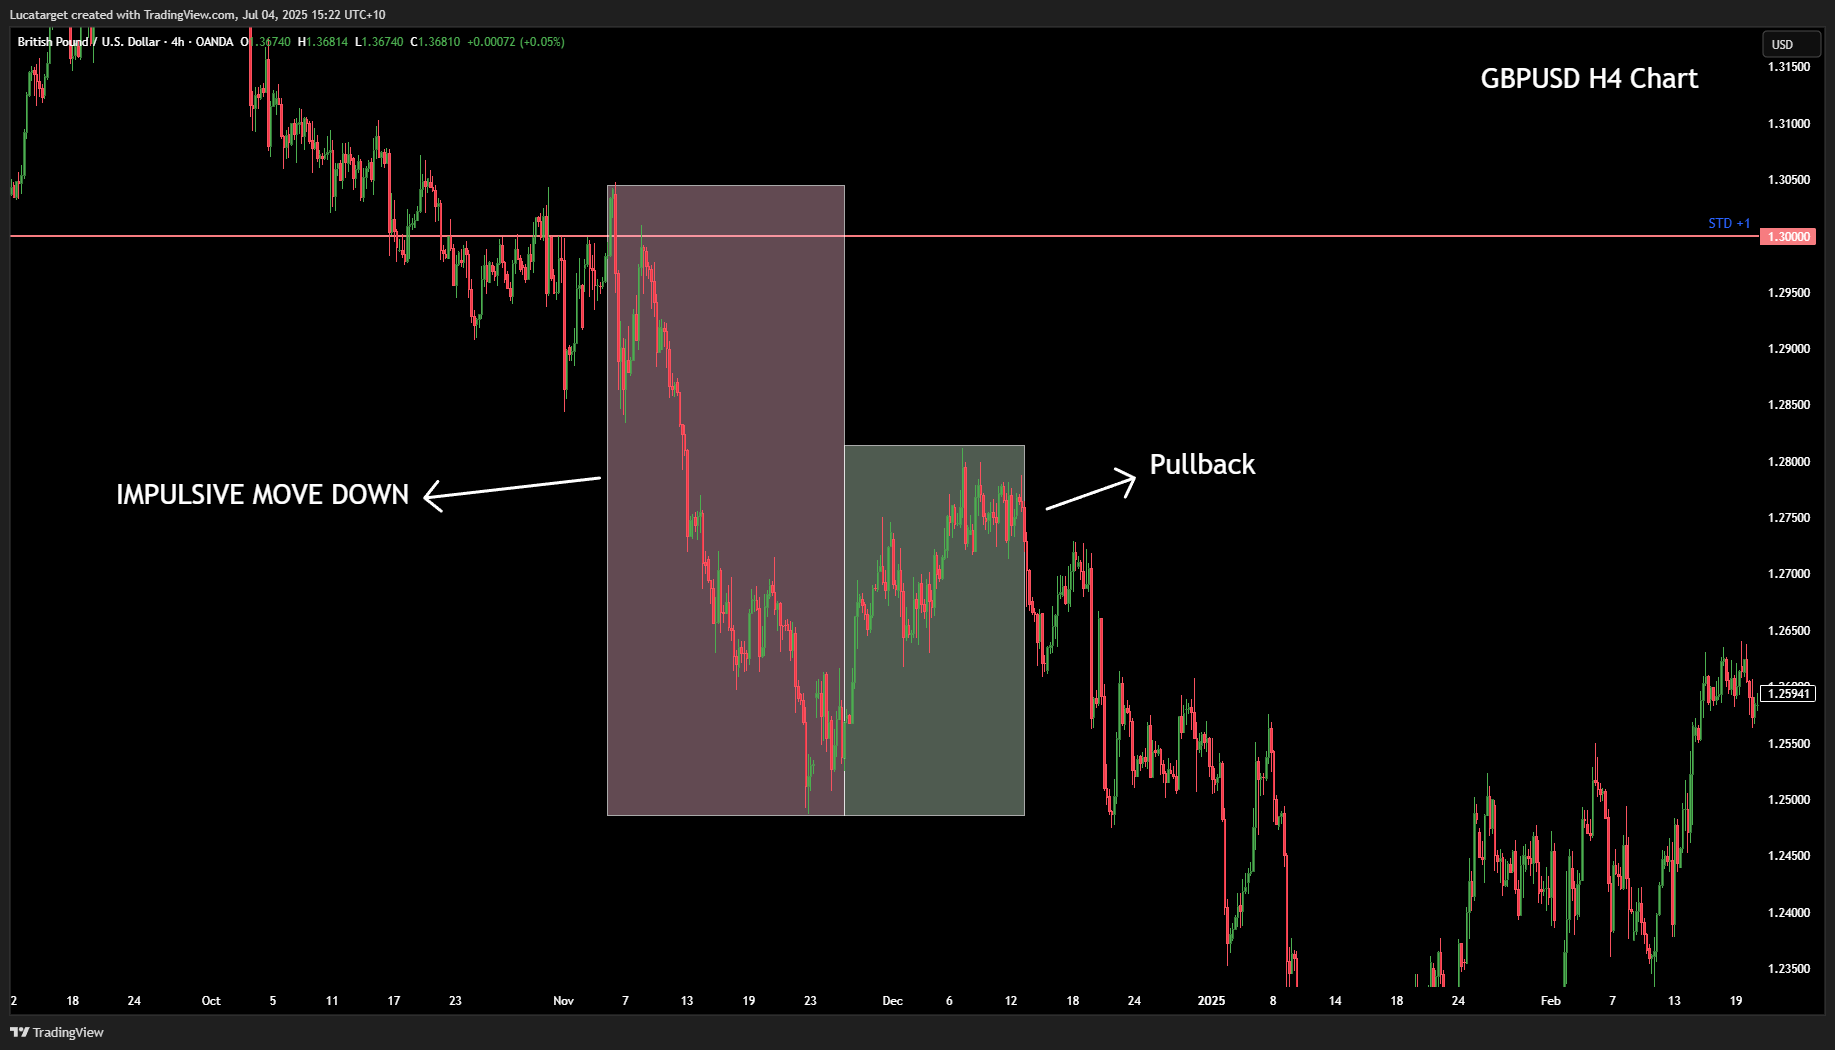
You then draw your Fibonacci tool across that leg. The most important levels to watch are 50% and 61.8%, which historically act as magnets for retracements (pullbacks).
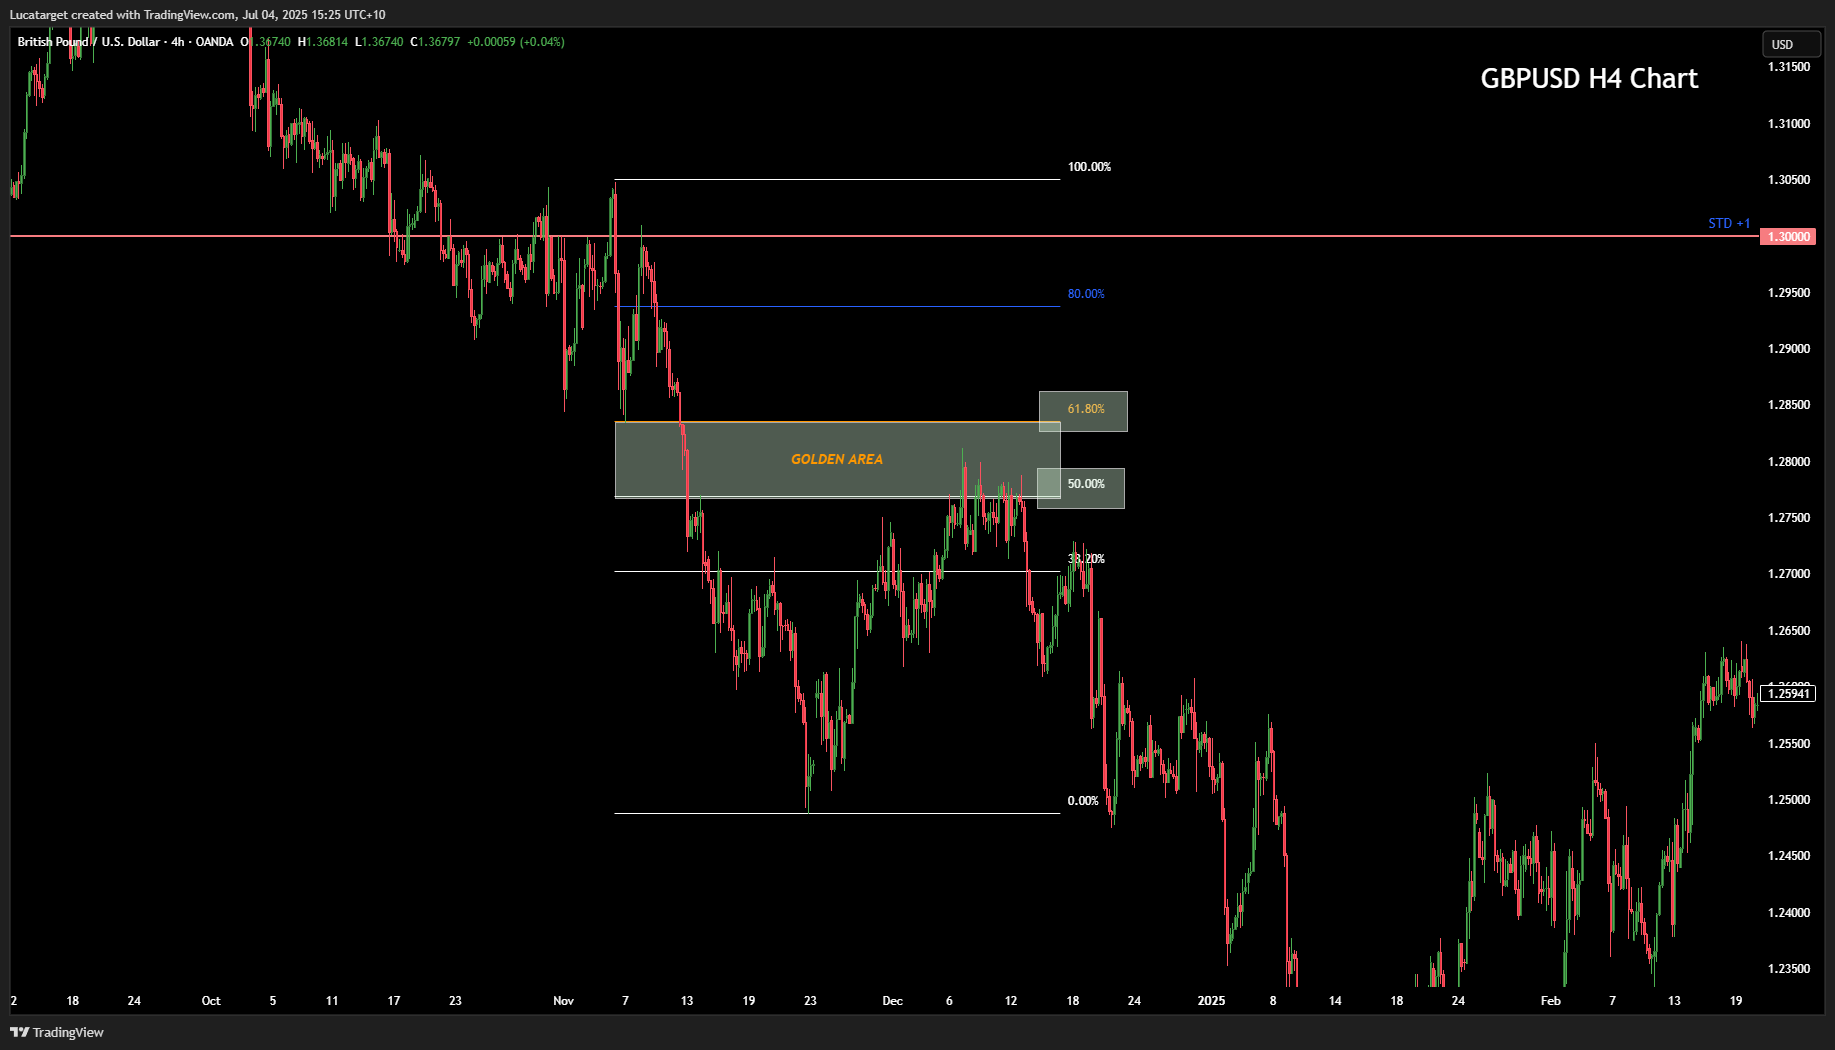
Once price retraces into this zone (what I like to call the Golden Area), you wait for confirmation.
This could be a pin bar, an engulfing candle, or a rejection of that level followed by a bullish close.
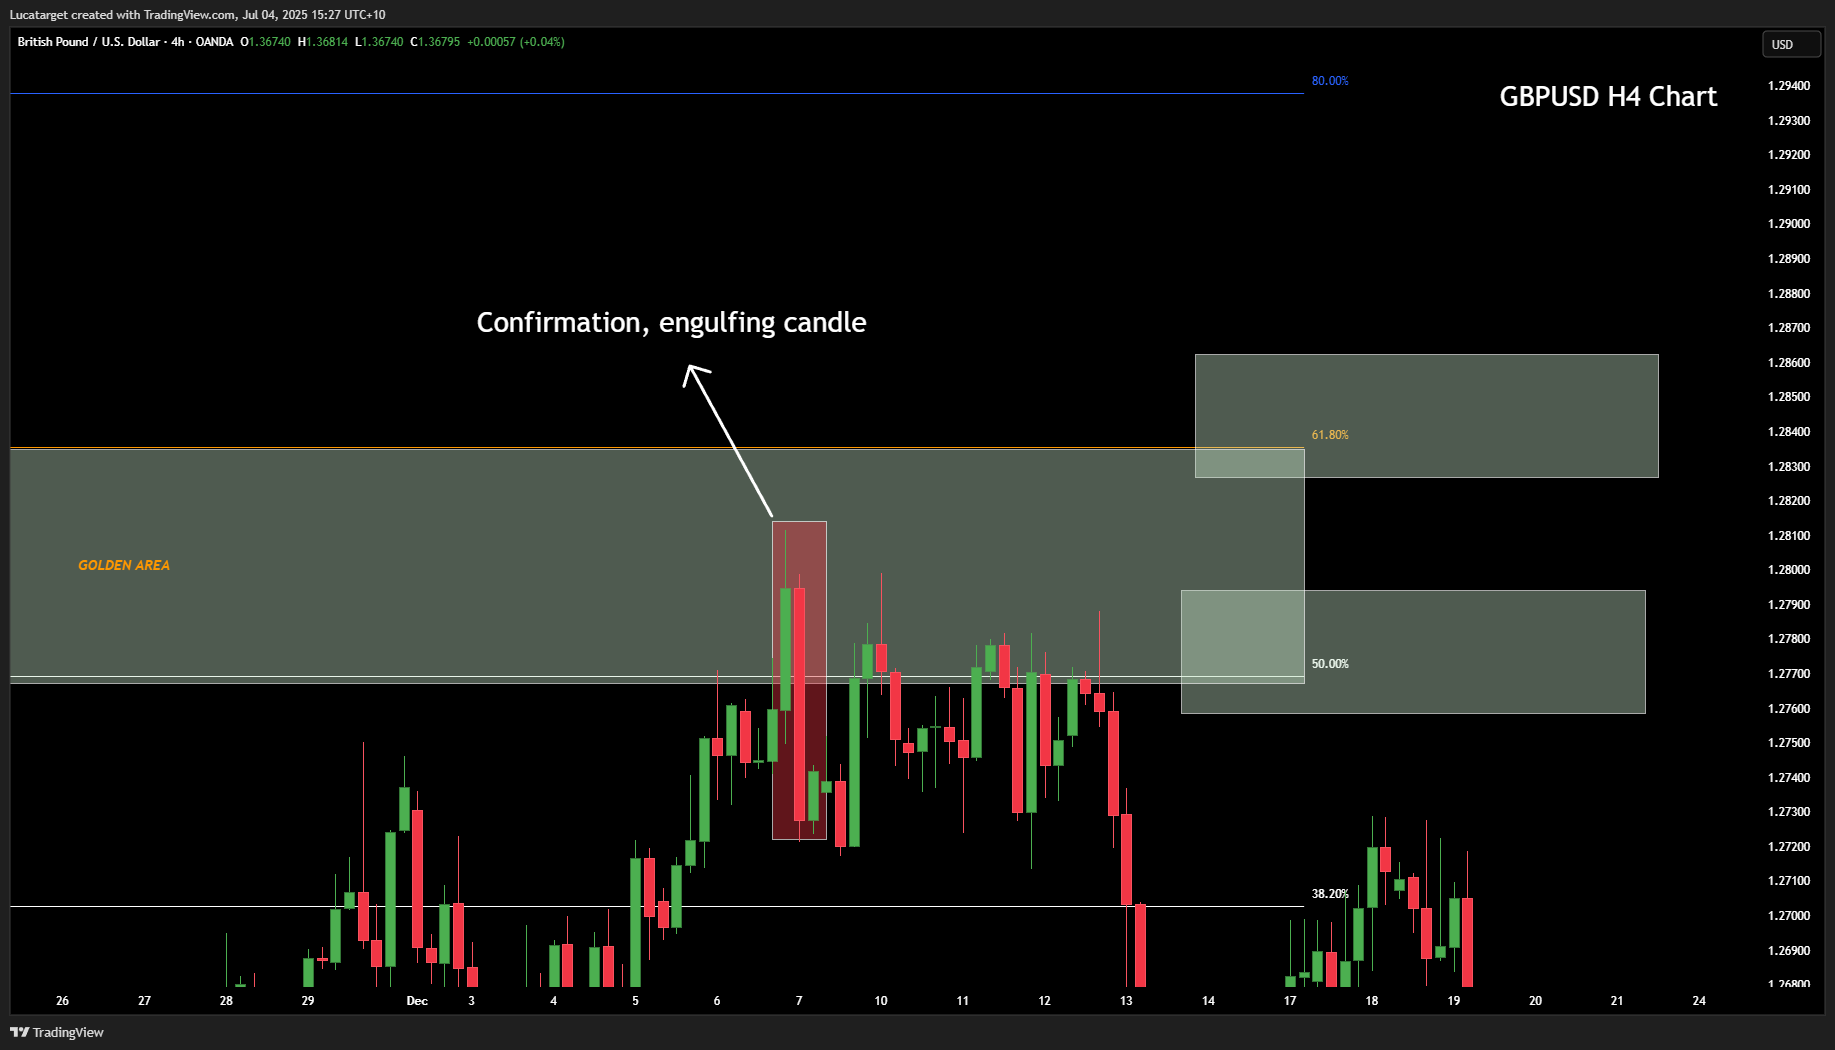
Your stop goes just below (if is a long postion) or below (if it is a short positon like the example) the Fib level of 70% or 80%, and your target becomes a retest of the previous high/low or continuation of the trend.
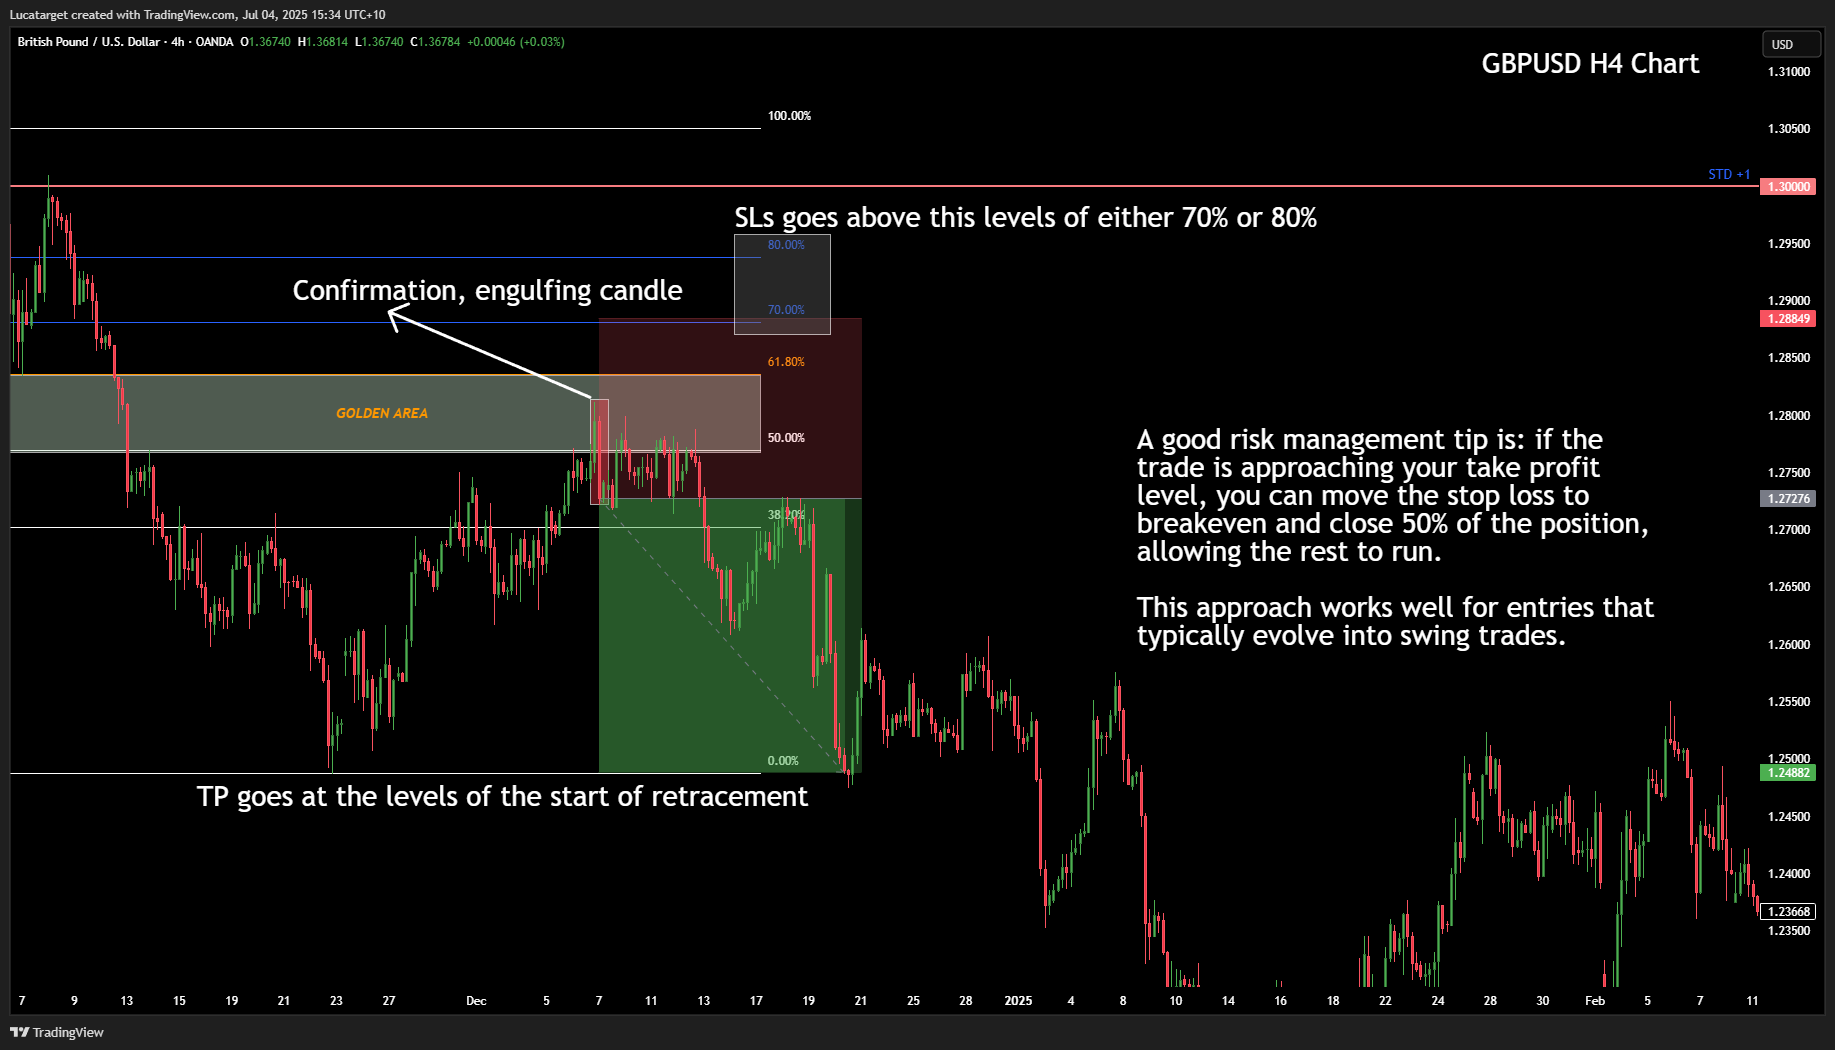
This strategy allows you to stay in sync with the broader move without jumping in at a poor price. It demands patience but rewards discipline.
This is a more mechanical strategy and perfect for traders who want rules over feel. This system works best on 1H and 4H charts, and can easily be automated.
It is excellent for traders who prefer to follow structure with minimal subjectivity.
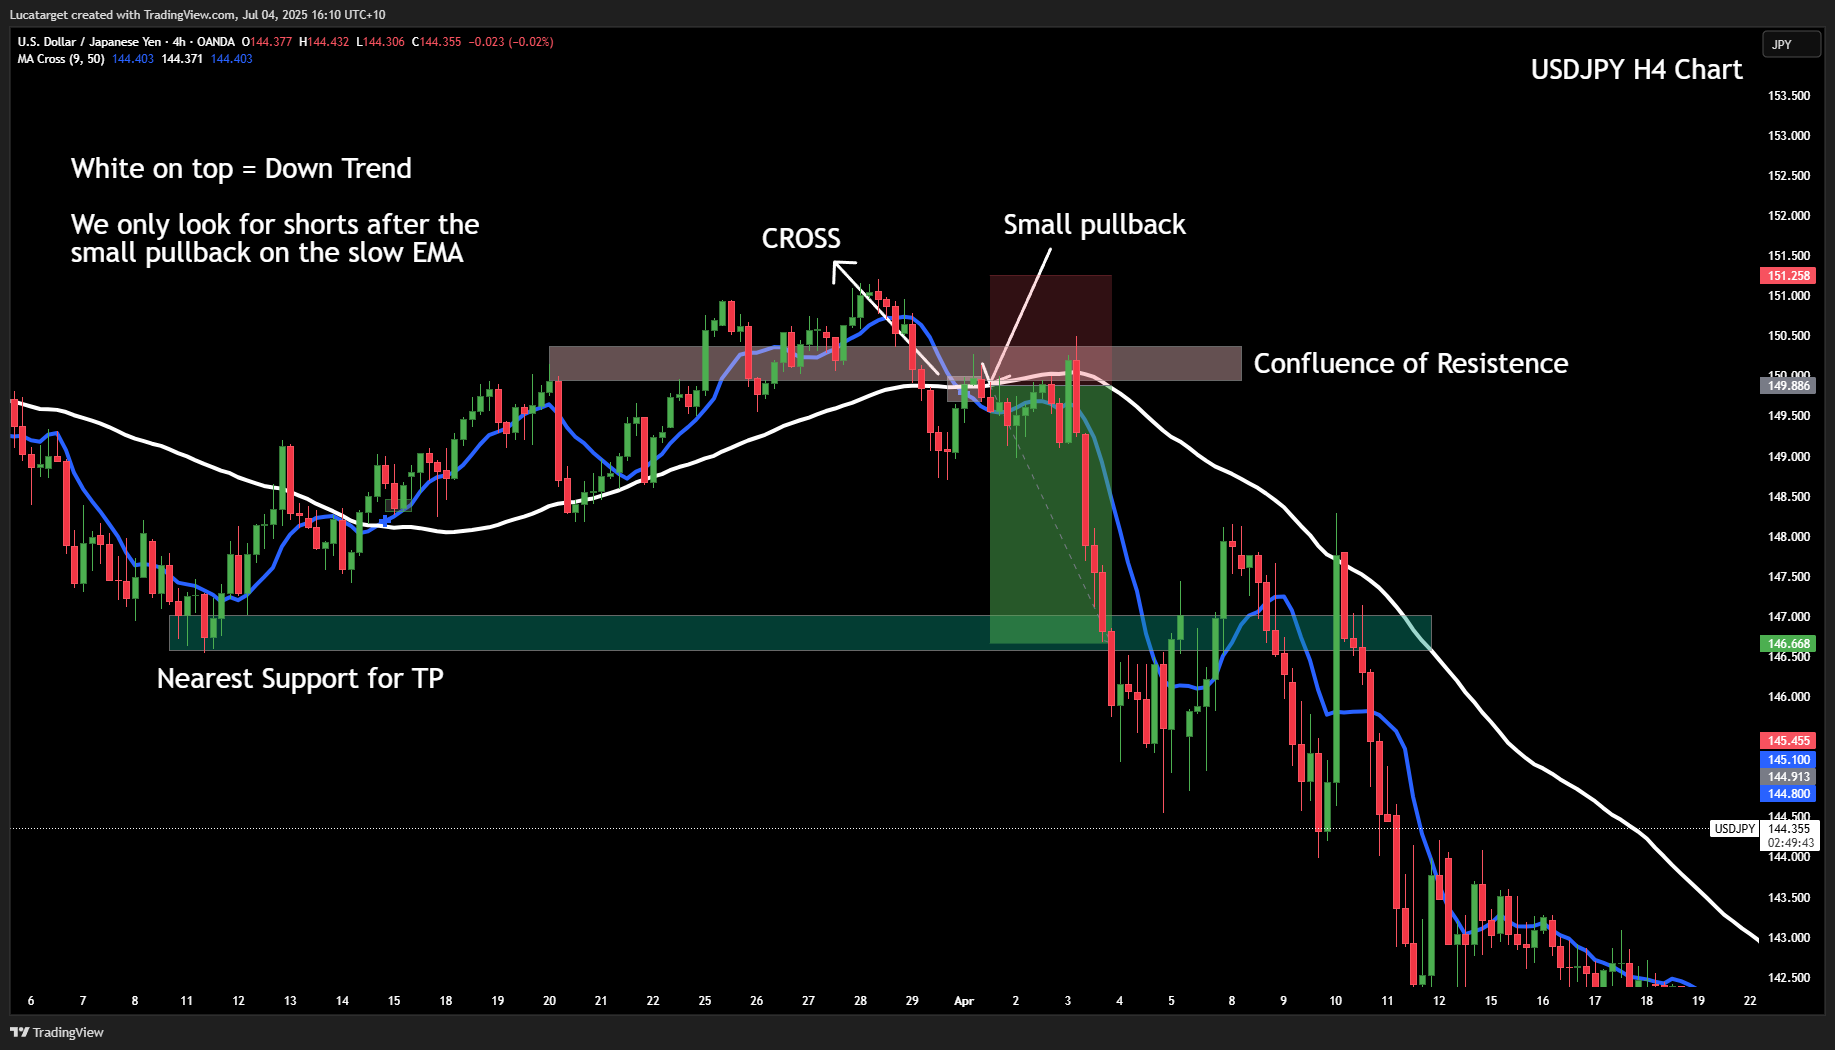
You use two moving averages a faster one (like a 9 or 20 EMA) and a slower one (like a 50 or 200 EMA). On my examples I will be using the fater EMA as 9 (on blue colour) and the slower EMA as 50 (on white).
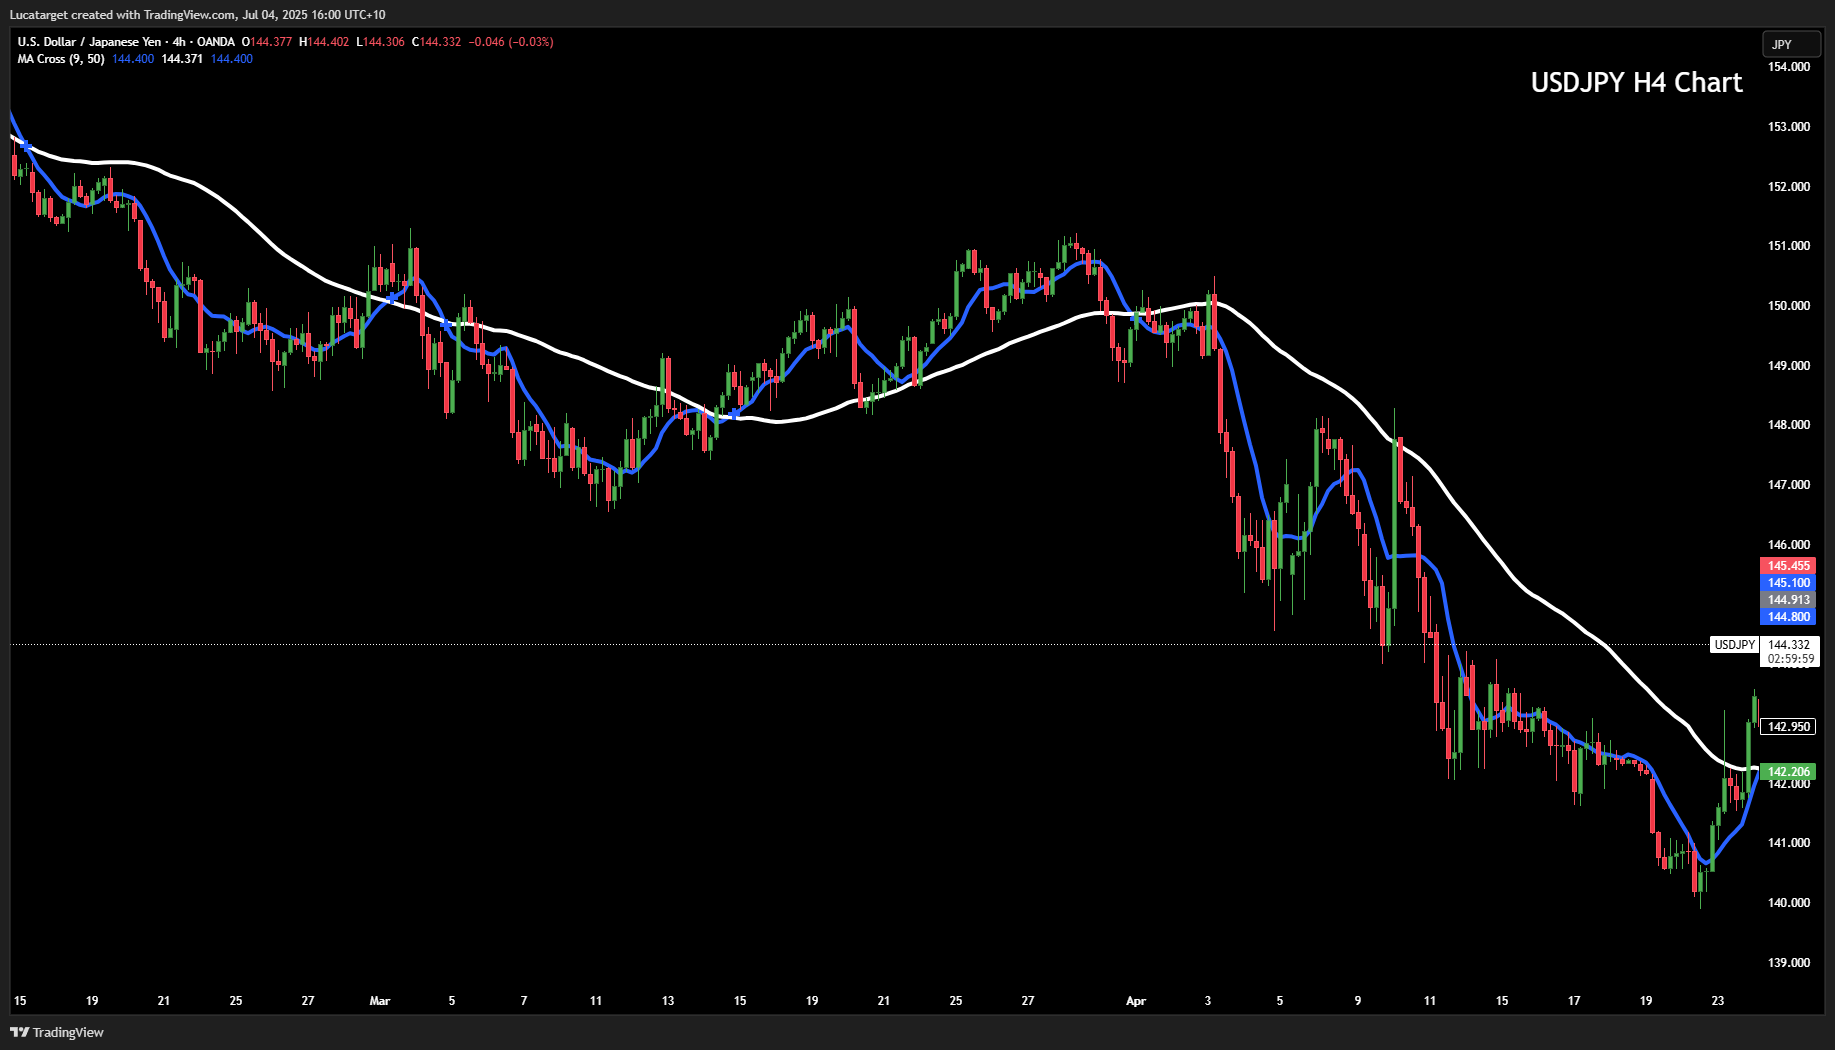
Your chart should be looking like this;
When the fast moving average (blue) crosses above the slow(white) one, it signals a potential trend change to the upside. When it crosses below, it suggests bearish momentum is increasing.
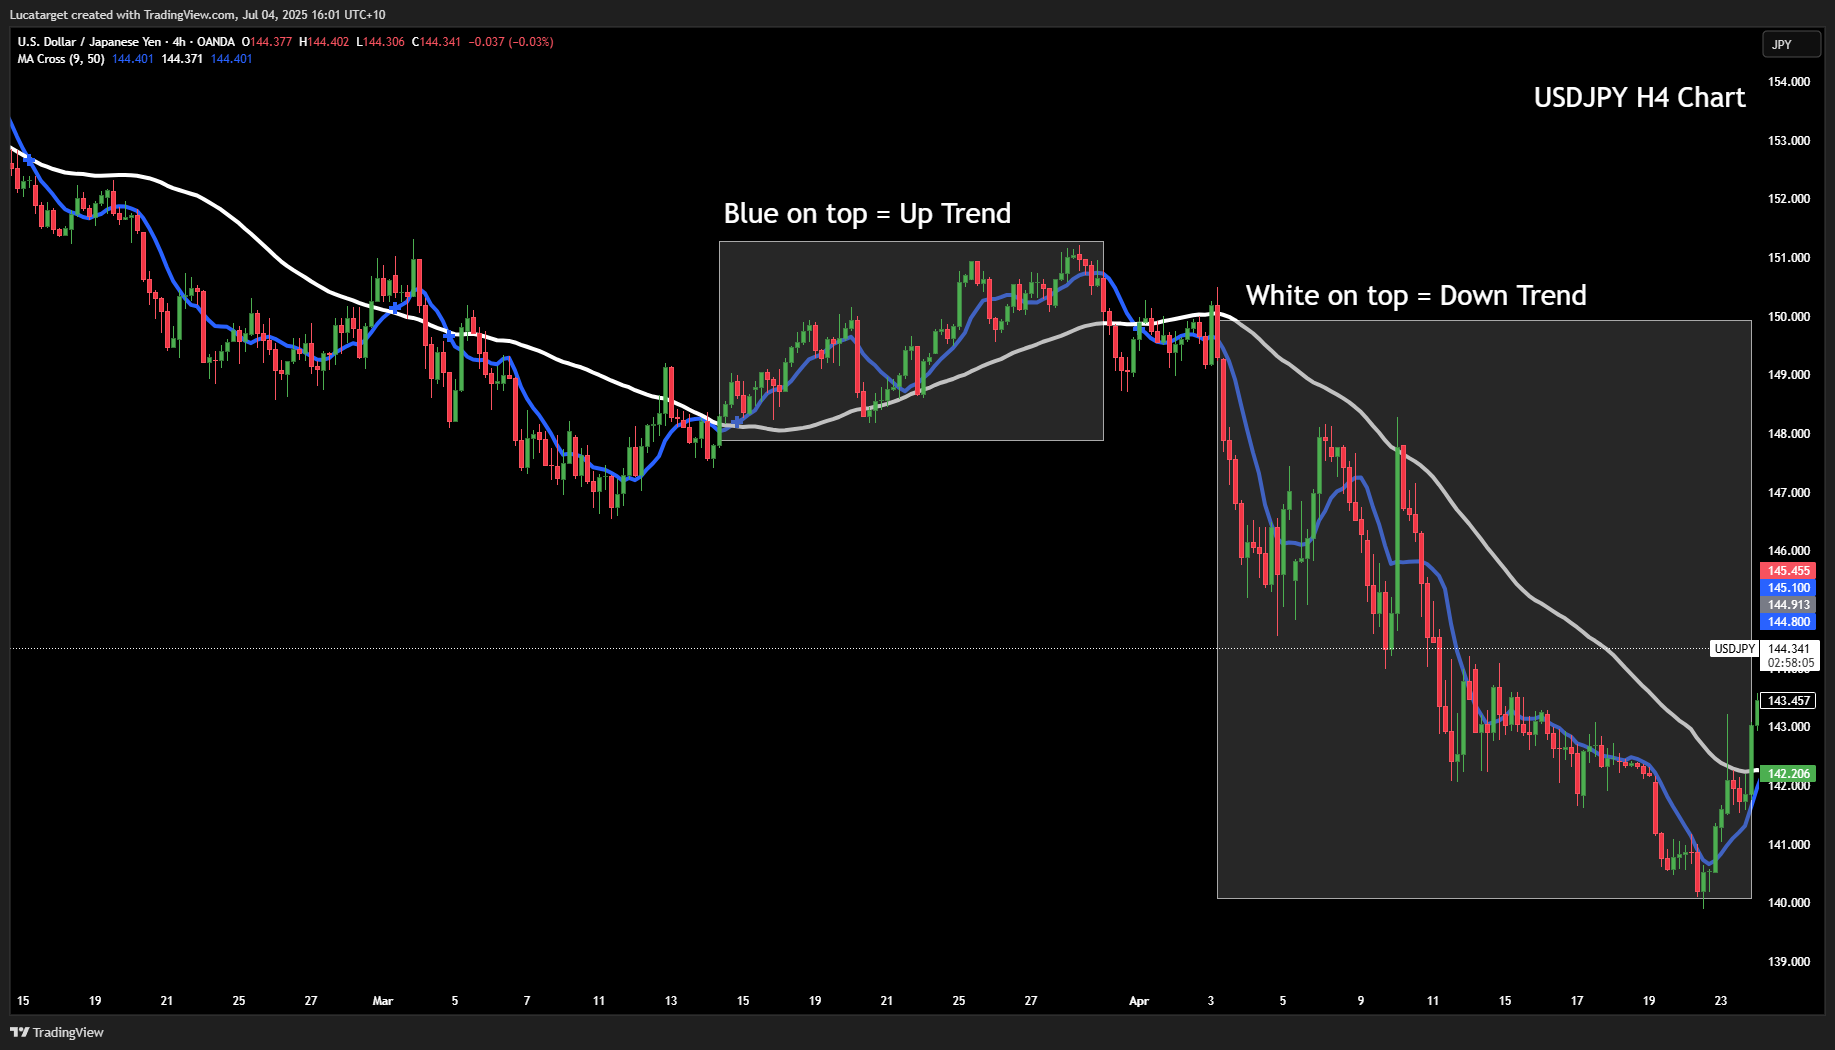
Here is a long trade example ,where the faster EMA (blue) crosses over the slow EMA (white) and gives a small pullback on the faster EMA (blue) and we can have our entry point rigth on that pullback touch on the EMA.
The TP will be on the closest support/resistence and the SL will be on the previous high/low
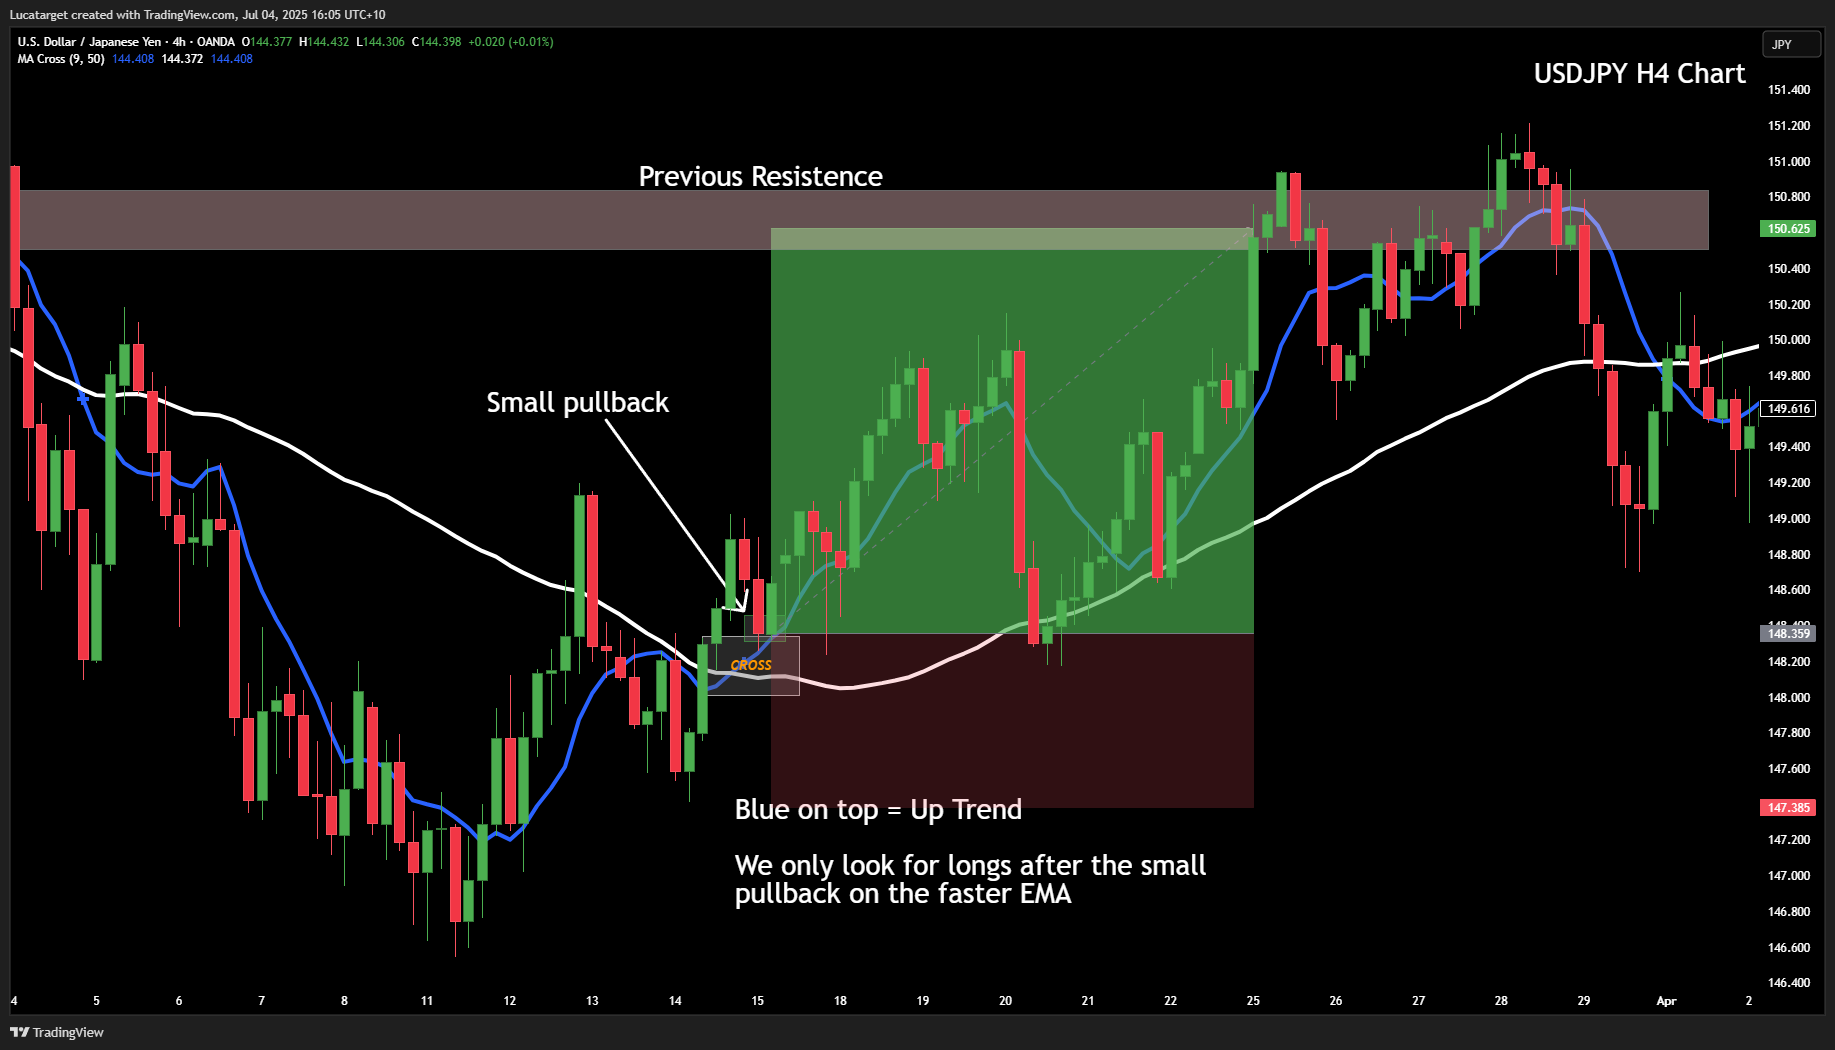
On this other example for short trade, the slower EMA (white) crossed the faster EMA (blue) therefore giving us an opportunity for a short trade after the small pullback on the slower EMA (white), in this specific scenario we had a resistence that had a confluence with the entry, giving us a higher probability
The TP will always be set at the nearest low/high support/resistence!
You don’t need to know all four strategies from day one. Pick the one that best suits your style and your schedule. Test it over at least 100 trades. Document your entries, your wins, your losses, and your emotions. Only then move on to the next setup.
The more familiar you become with one entry method, the more confident you’ll be in the heat of live trading.
Confidence isn’t a personality trait it’s built through preparation and experience.
Trading isn’t about knowing every tool. It’s about doing the right things again and again.
1- Use your charts to serve as a ‘reply’ tool to practice live entries based on historical data.
2- Annotate your charts with reasons for entries and exits.
3- Wait for confirmation; don’t try to predict every move.
4- Use alerts and pending orders to reduce emotional trades.
5- Keep your risk consistent. Entries improve when emotions are managed.
Q:Which forex strategy is best for beginners?
A: The A-B-C Support & Resistance Setup is the most beginner-friendly. It provides a clear structure and teaches patience, risk control, and how price reacts at key levels.
Q:How do I know if a breakout is real or fake?
A: Look for volume confirmation, a strong candle close above the breakout level, and whether the breakout aligns with a broader fundamental or sentiment catalyst (e.g., news).
Q:Can I use multiple strategies together?
A: Yes, but only after mastering each one individually. Combining entries like Fibonacci retracement with candlestick confirmation is a great way to increase conviction.
Q:How much should I risk per trade?
A: A good rule of thumb is to risk 1–2% of your capital per trade. The key is consistency. Let your edge play out without large emotional drawdowns.
Q:What timeframe works best for these strategies?
A: That depends on your lifestyle. Swing traders may prefer the 1H and 4H charts, while intraday or news traders will find more opportunity in the 5M or 15M timeframes.
Further Reading: Deepen Your Trading Knowledge
Continue sharpening your market analysis and trading strategies with these hand-picked guides across gold, macroeconomics, risk sentiment, and trading psychology that I’ve wrote!
Gold Trading & Strategy
Risk Sentiment & Global Events
Economic Data & Macro Strategy
Trading Skills & Execution
Trading Psychology & Performance
This content may have been written by a third party. ACY makes no representation or warranty and assumes no liability as to the accuracy or completeness of the information provided, nor any loss arising from any investment based on a recommendation, forecast or other information supplies by any third-party. This content is information only, and does not constitute financial, investment or other advice on which you can rely.
ACY Securities is one of Australia's fastest growing multi-asset online trading providers, offering ultra-low-cost trading, rock-solid execution, technologically superior account management and premium market analysis.

Select the categories and companies you wish to follow directly to your person rss feed.
Create Custom RSS Feed
just now

just now
Sign up and join over 5,000 professional members who receive personalized news alerts, curated professional connections, and more for free!
Marex has entered the football financing market through a partnership with specialist sports investment and advisory firm Pinto Capital, targeting clubs in the Premier League and EFL Championship.
Around 110,000 UK retail investors have secured $300 million worth of Anthropic shares in its record-breaking $81 billion IPO. The heavily oversubscribed offer, coordinated by RetailBook, saw smaller investors prioritised, with 63% of applicants receiving their full allocation.
Clear Street has completed its acquisition of Boom Securities (H.K.) Limited, establishing its first licensed brokerage presence in Hong Kong
Sterling slips to its lowest against the dollar since October as markets trim Bank of England bets and Fed minutes point to further US rate rises, while the euro hits a fresh one-year low. Daily FX analysis from Equals.
JT Prime, the institutional Prime of Prime founded by Raj Sitlani, Jonathan Brewer and Jeff Wilkins, is set to become the new home for institutional client relationships currently serviced by FXCM Pro. Clients have been offered the same leverage, fees and connectivity, ensuring continuity of trading conditions.
The Nasdaq 100 has shifted into a short-term bullish recovery after finding strong support around 26,611. Following the sharp sell-off, price has formed a sequence of higher lows and has moved back above the 20-hour moving average at around 27,270, while the 5-hour and 10-hour averages are also turning higher.
U.S. equity futures rose in the after hours, led by Nasdaq-100 futures up 1% and S&P 500 futures up 0.6%, as investors focused on Anthropic’s Nasdaq debut. The AI company priced its IPO at $83 per share, above expectations, and expanded the offering to raise around $81.3 billion, making it the largest IPO on record.
Brokers can offer LMAX perpetual futures alongside FX and CFDs through a single trading account. LMAX says brokers with existing credentials can go live in under five days.
24X National Exchange has filed a proposed rule change with the SEC to launch 24X Options, a general options market trading from 9:30 a.m. to 4:00 p.m. ET. The filing also covers binary KPI options on quarterly revenue, earnings per share and other metrics for 23 of the most actively traded U.S. companies.
cTrader Mobile 5.11 introduces Signals, a new app where traders can browse signals from leading providers and act on them directly in the platform.