just now
Liquidity Finder Ltd is incorporated in England and Wales, company number 10610740, registered address 167-169 Great Portland Street, Fifth Floor, London W1W 5PF, United Kingdom.
Published: just now


If you’ve ever wondered why so many traders love the Nasdaq 100 (NAS100) despite the S&P 500 having more volume, you’re not alone. This guide breaks down:
Let’s break it down like real traders do-zero hype, full insight.

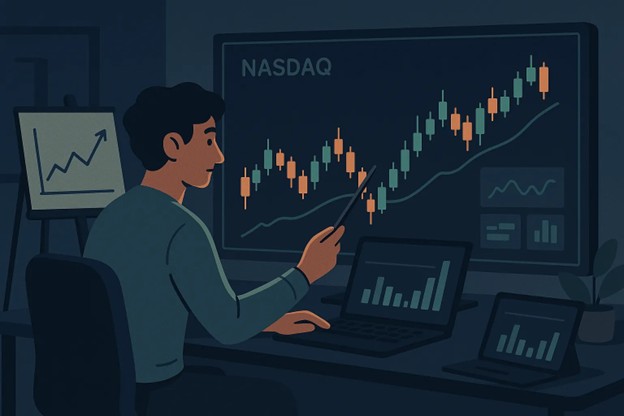
The Nasdaq 100 (symbol: NAS100 or NDX) is an index that tracks the top 100 non-financial companies listed on the Nasdaq exchange.
It includes tech giants like:
This index is a tech-heavy, growth-focused benchmark-making it more sensitive to macro news, interest rate shifts, and innovation cycles like AI and cloud computing.
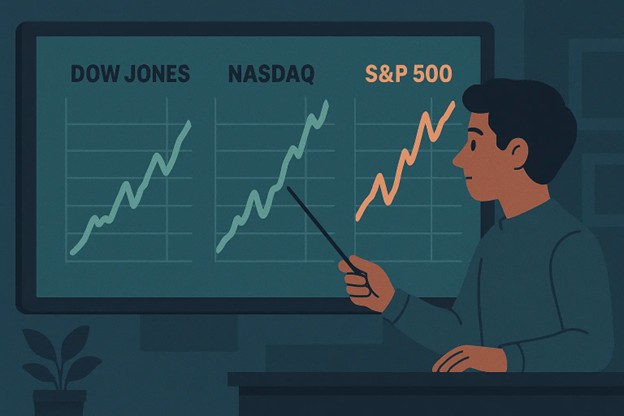
Here’s where most traders get it wrong: they think more volume = better trading conditions. But what really matters is how the market moves, not just how many contracts trade.
| Index | Focus | Avg U.S. Session Volume (Futures) | Behavior Style | Best For |
| NAS100 | Tech, Growth, Innovation | 250K - 400K contracts | Fast, reactive, volatile | Momentum trading, breakouts |
| US30 | Blue-Chip Industrials | 80K - 150K contracts | Slow, structured | Swing trades, trend following |
| SPX500 | Broad Market (500 stocks) | 500K - 800K contracts | Smooth, balanced | Long-term investors, hedge funds |
SPX has the most volume. NASDAQ gives the most opportunity.
Here’s the truth:
SPX Volume ≠ Tradeability
NASDAQ = Designed for Active Traders
| Factor | NAS100 Advantage |
|---|---|
| Intraday Range | Often 200+ points daily |
| Volatility Response | Strong spikes around major news |
| Liquidity Reactions | Clean sweeps before price reversals |
| Trader Behavior | Preferred by scalpers, day traders, SMC users |
Best Time to Trade NAS100
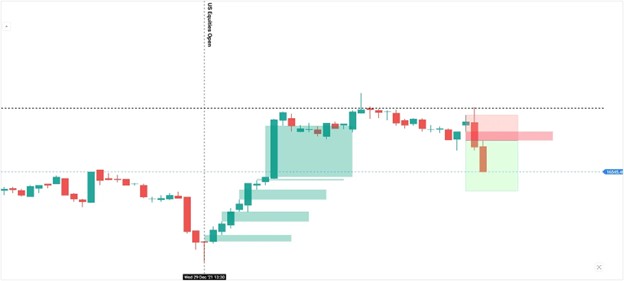
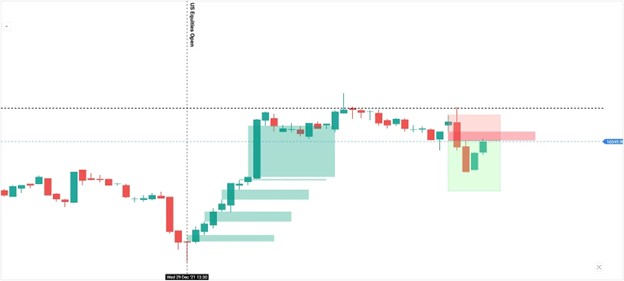
The U.S. session is where Smart Money plays:
| Time (EST) | What Happens |
|---|---|
| 8:00 – 9:30 AM | Pre-market traps and sweeps |
| 9:30 – 11:00 AM | NY Open volatility and momentum |
| 2:00 – 4:00 PM | “Power Hour” continuations or reversals |
These are your Kill Zones. Trade within them, not outside them.
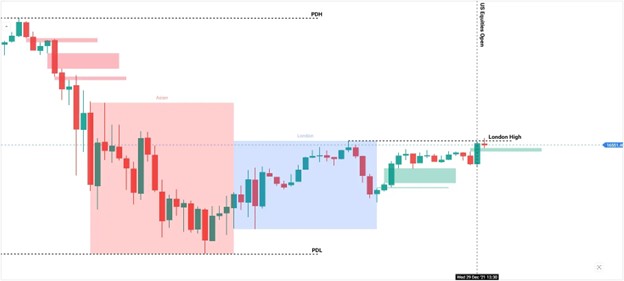
Pro Tip: Don’t include levels that have already been hit prior to NY open.
To learn more about Fair Value Gaps, check out my contents:
Common NASDAQ Trading Mistakes to Avoid
Pro Trader Rules for NASDAQ
Nasdaq Setup Checklist (At a Glance)
| Step | What to Do |
| 1. Pre-session prep | Mark highs/lows, gaps, NY open |
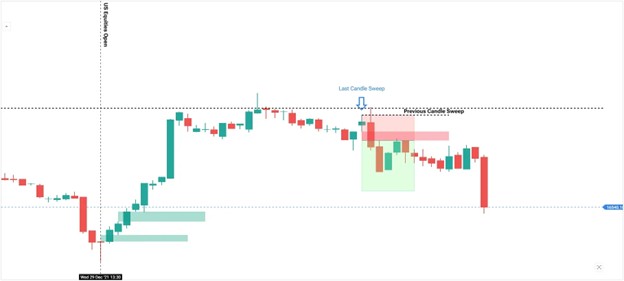
| 2. Observe the open | Watch for stop hunts or traps on key levels |
| 3. Confirm the shift | Look for displacement + MSS |
| 4. Execute with clarity | Enter with M1 or M5 confluence |
| 5. Manage the trade | Take partials, move SL, exit near liquidity |
If you’re an active trader looking for momentum, volatility, and smart setups, NAS100 is where the action is.
Despite having less volume than SPX, Nasdaq gives you:
Trade structure, not speed. Trade NASDAQ, not noise.
Check Out Our Market Education
How to Start Day Trading:
5 Steps to Start Day Trading: A Strategic Guide for Beginners
8 Steps How to Start Forex Day Trading in 2025: A Beginner’s Step-by-Step Guide
3 Steps to Build a Trading Routine for Consistency and Discipline - Day Trading Edition
Learn how to navigate yourself in times of turmoil:
How to Identify Risk-On and Risk-Off Market Sentiment: A Complete Trader’s Guide
How to Trade Risk-On and Risk-Off Sentiment — With Technical Confirmation
The Ultimate Guide to Understanding Market Trends and Price Action
Want to learn how to trade like the Smart Money?
Mastering the Market with Smart Money Concepts: 5 Strategic Approaches
Mastering Candlestick Pattern Analysis with the SMC Strategy for Day Trading
Understanding Liquidity Sweep: How Smart Money Trades Liquidity Zones in Forex, Gold, US Indices
The SMC Playbook Series Part 4: How to Confirm Trend Reversal & Direction using SMC
The SMC Playbook Series Part 5: The Power of Multi-Timeframe Analysis in Smart Money Concepts (SMC)
Fair Value Gaps Explained: How Smart Money Leaves Footprints in the Market
Trading Psychology and Continuous Improvement Contents:
The Mental Game of Execution - Debunking the Common Trading Psychology
5 Steps to Backtest a Trading Strategy with AI: A Step-by-Step Guide
Managing Trading Losses: Why You Can Be Wrong and Still Win Big in Trading
Follow me on LinkedIn: Jasper Osita
This content may have been written by a third party. ACY makes no representation or warranty and assumes no liability as to the accuracy or completeness of the information provided, nor any loss arising from any investment based on a recommendation, forecast or other information supplies by any third-party. This content is information only, and does not constitute financial, investment or other advice on which you can rely.
ACY Securities is one of Australia's fastest growing multi-asset online trading providers, offering ultra-low-cost trading, rock-solid execution, technologically superior account management and premium market analysis.
Select the categories and companies you wish to follow directly to your person rss feed.
Create Custom RSS FeedSign up and join over 5,000 professional members who receive personalized news alerts, curated professional connections, and more for free!
cBridge, by Spotware, has launched Markout Report, a risk intelligence module that lets brokers detect toxic flow, rank accounts by financial impact and act before losses accumulate, all within the bridge.
Sterling steadies after political uncertainty rattled gilt markets, while EUR/USD and EUR/GBP approach key technical levels ahead of today's European session.
GBP/AUD remains trapped in a well-defined bearish trend on both the weekly and daily timeframes.
Discover the key drivers, technical levels, and central bank expectations shaping the EUR/USD trend as the ECB prepares to hold rates and markets watch for a potential breakout.
Sydney-based multi-asset broker ACY Securities has introduced PAXGUSD, a new CFD instrument that allows clients to trade tokenised gold against the US Dollar 24 hours a day, seven days a week. The instrument is available across MetaTrader 4, MetaTrader 5, and the ACY Trading Platform.
Binance has lowered its VIP 3 Wallet Assets threshold from $3 million to $1 million and will now count OTC Spot Trading Volume at a 4x multiplier toward VIP qualification, removing the previous VIP 4 cap and allowing eligible users to progress through the full tier framework up to VIP 9.
Retail futures trading leader NinjaTrader Group has appointed Mark Omens as Senior Vice President, Commercial Strategy, bringing a 25-year veteran of derivatives marketplace CME Group into a newly created role focused on exchange partnerships and enterprise growth.
Gold Price Action Forecast: Will XAU/USD Drop to $3930? Meta Description: Read our Gold price action forecast to see if XAU/USD will drop to $3930.
BitDelta Securities Financial Services LLC (“BitDelta Securities”) today announced that it has received full regulatory approval from the Capital Market Authority (“CMA”) of the United Arab Emirates under the Category 5 — Arrangement and Advice license framework (License No. 20200000439). The approval follows the firm's receipt of In-Principal Approval earlier this year and represents the successful conclusion of the CMA's full licensing process, including the satisfaction of capital requirements, governance appointments, and operational setup.
Crypto.com has received a $400 million strategic investment from Citadel Securities, valuing the firm at $20 billion. It marks the first institutional funding round in the company's history, aimed at accelerating its expansion into tokenised securities, derivatives and other asset classes.