just now

Liquidity Finder Ltd is incorporated in England and Wales, company number 10610740, registered address 167-169 Great Portland Street, Fifth Floor, London W1W 5PF, United Kingdom.
Published: just now
In last week’s analysis — “Nasdaq Eyes All-Time Highs Amidst Govt Shutdown — US Still Closed” — the narrative projected that once the U.S. government stalemate stabilized and rate cut expectations became dominant, the Nasdaq would surge toward uncharted highs. That projection has now fully materialized.
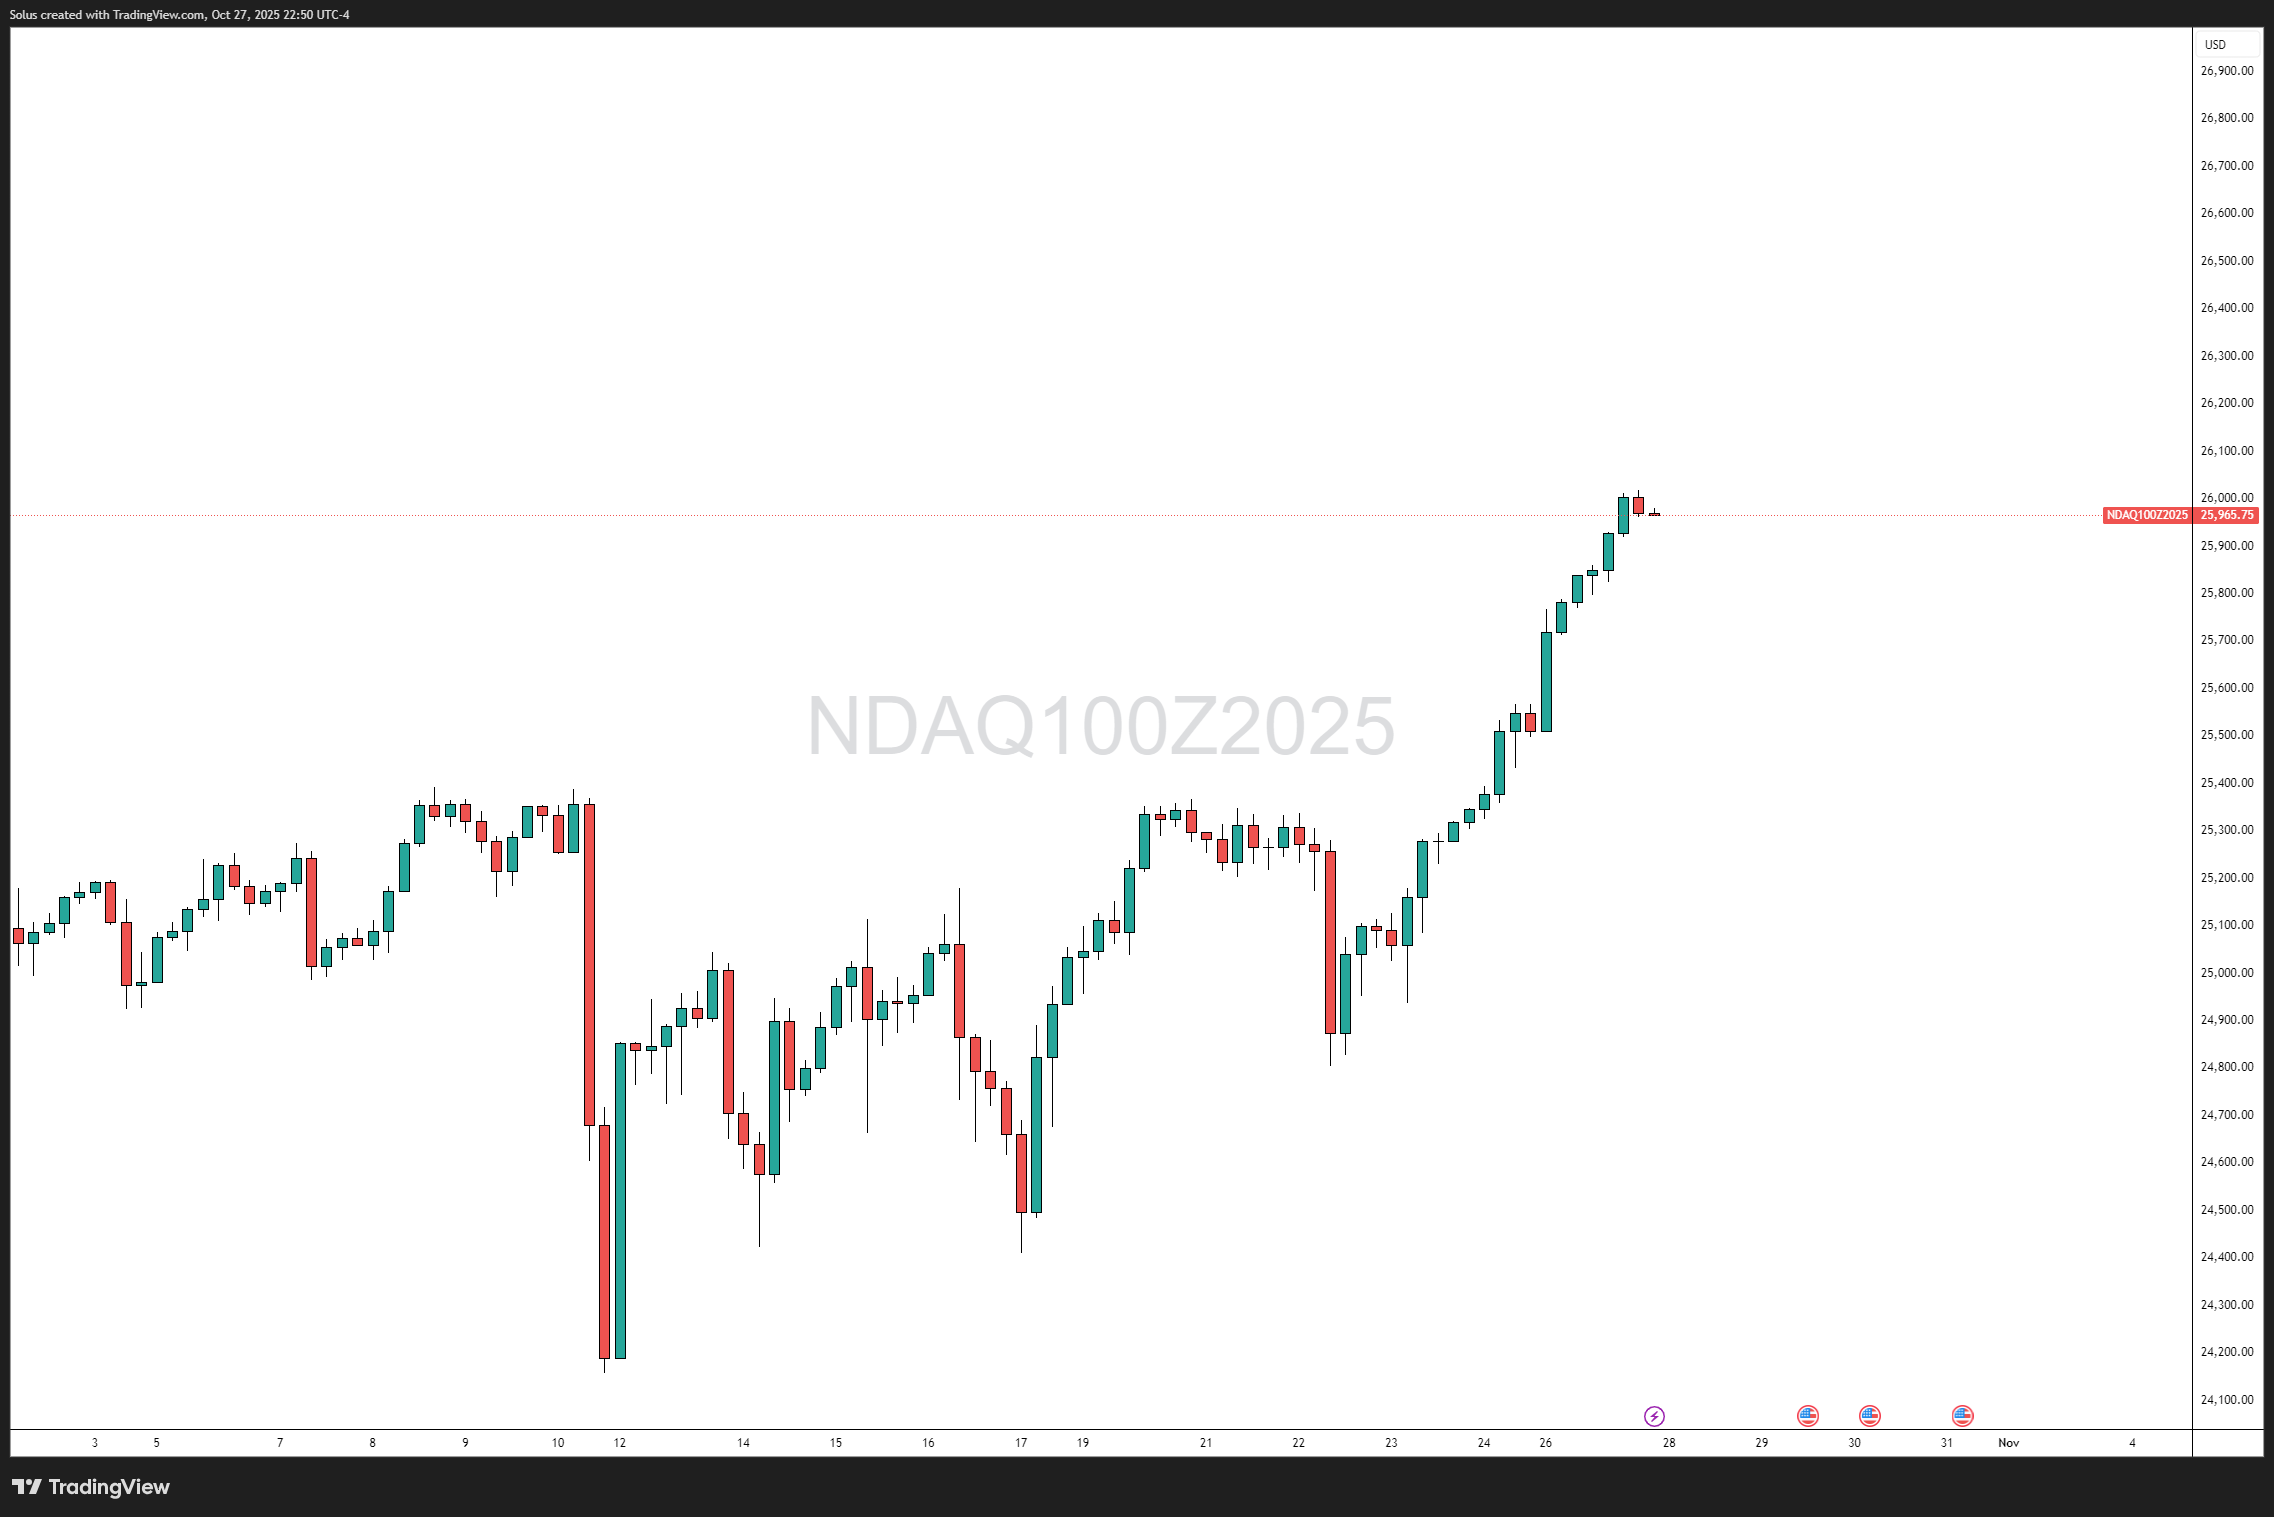
As of this week, Nasdaq 100 Futures have rallied to approximately 25,960–26,000, establishing new all-time highs. The price action shows nine consecutive bullish sessions — a sustained drive fueled by institutional demand and an environment flush with easing expectations.
Even with the ongoing U.S. government shutdown, investor sentiment has turned decisively risk-on. The market has chosen to look beyond fiscal paralysis, focusing instead on monetary policy easing, AI-driven tech resilience, and improving liquidity conditions.
At the core of this rally lies a near-certain Federal Reserve rate cut.
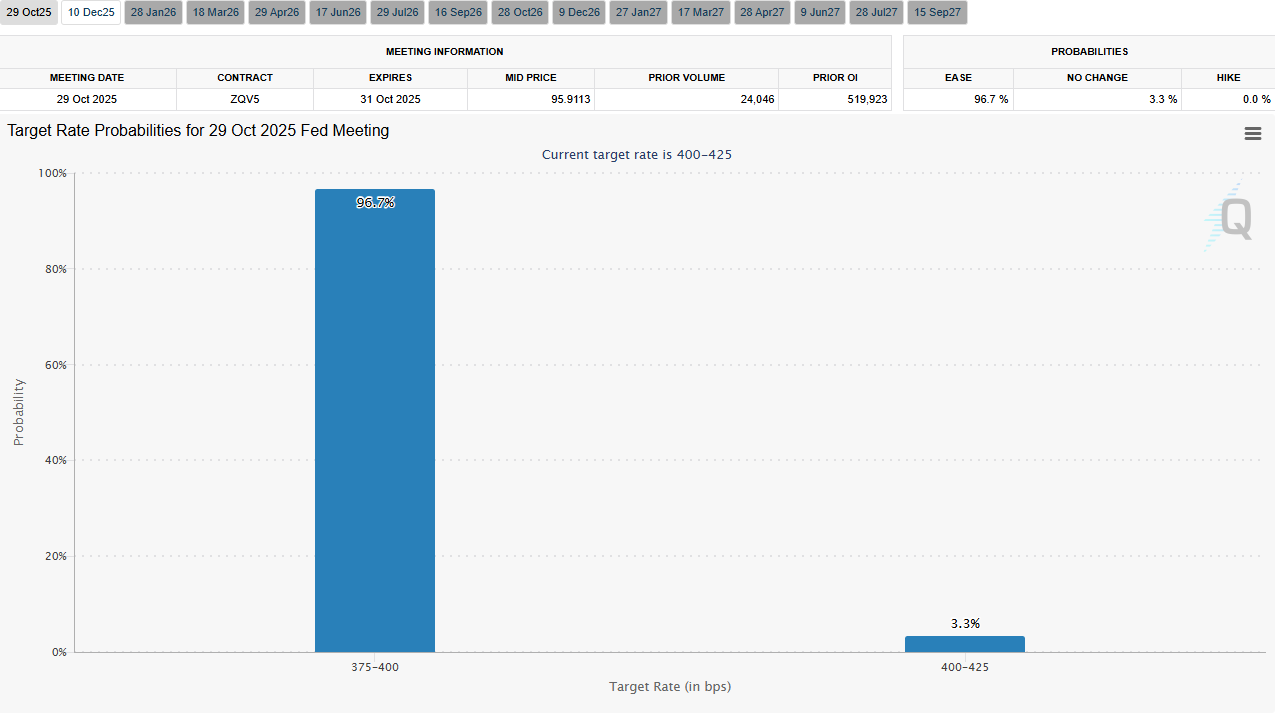
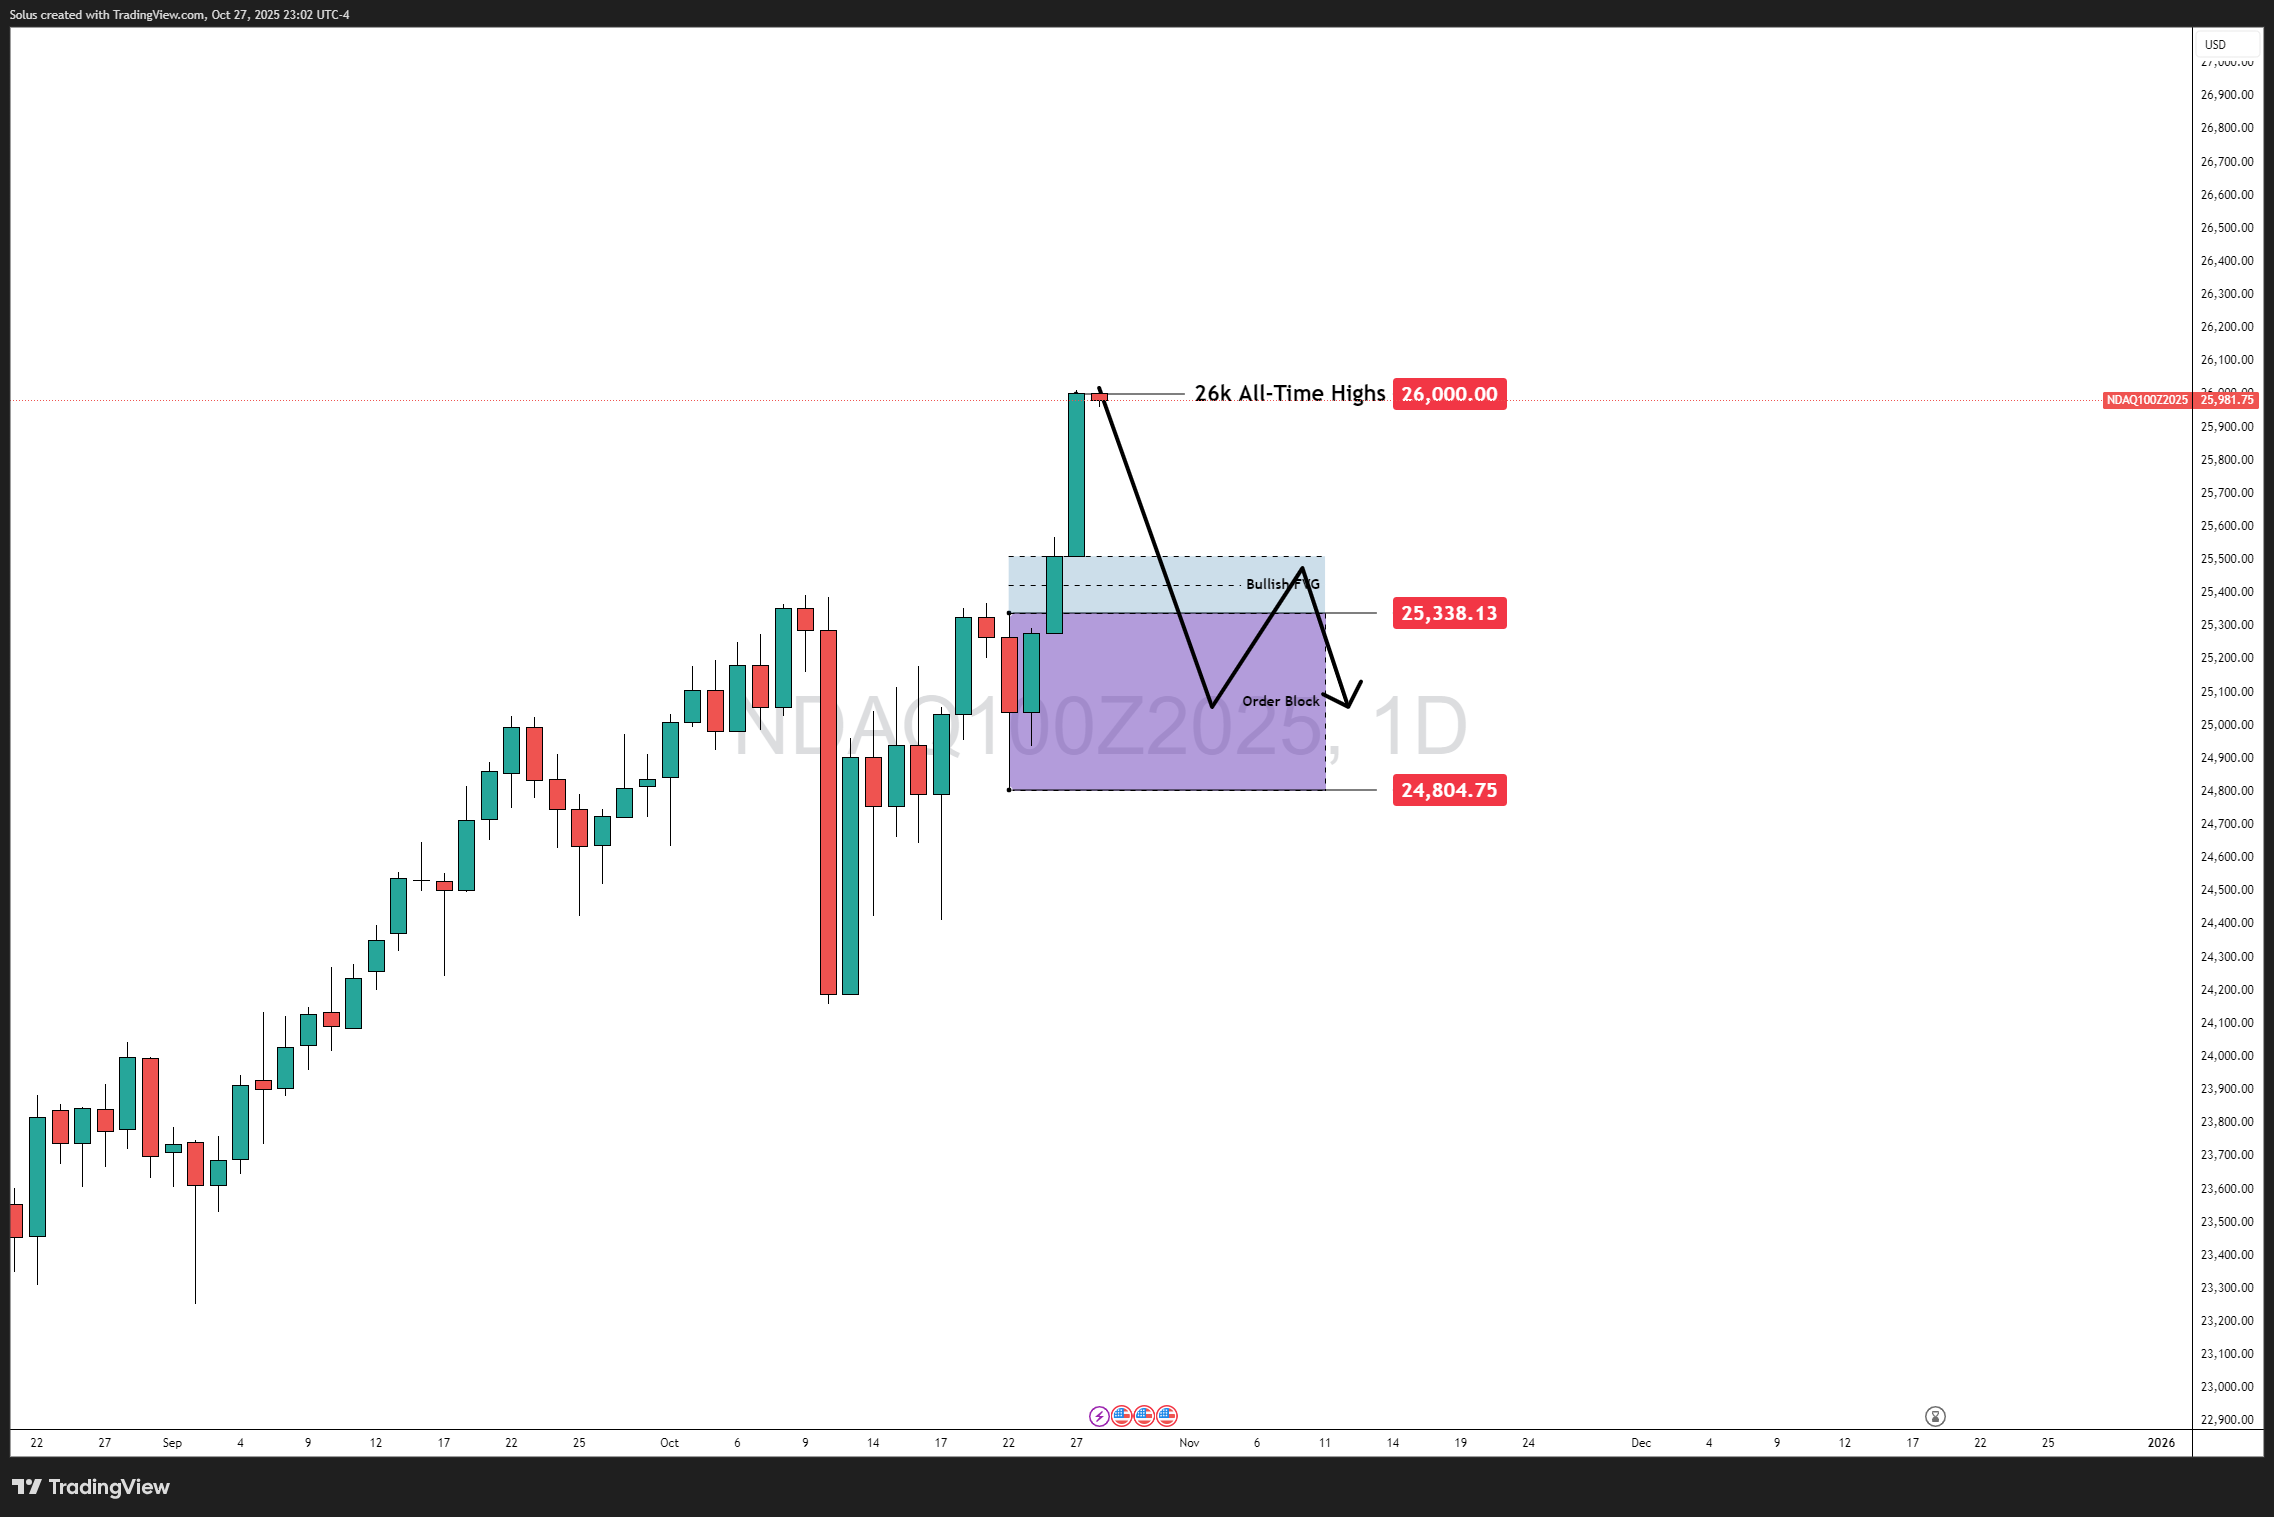
According to the CME FedWatch Tool, there’s now a 96.7% probability that the Fed will reduce its benchmark rate by 25 basis points on October 30, lowering the target range from 4.25% to 4.00%. Only 3.3% of market participants expect no change, and 0% foresee a hike.
That level of conviction is rare — essentially signaling that the market has already moved ahead of the Fed.
In the world of equities, rate cuts are like oxygen: they lower borrowing costs, reduce yields, and push investors to re-allocate capital from bonds and cash into growth-driven assets like tech stocks.
The Nasdaq, as the growth engine of U.S. equities, naturally becomes the prime beneficiary.
When liquidity expectations rise, valuations expand — not because earnings immediately change, but because the discount rate applied to future cash flows falls.
This macro-mechanical repricing is what often precedes major bull runs, and it’s precisely what we’re seeing unfold.
Interestingly, the ongoing government shutdown — initially perceived as a risk — has instead created a short-term liquidity cushion.
Here’s why:
With much of Washington in limbo, Treasury issuance has slowed, meaning fewer government bonds are flooding the market. That reduces the near-term demand for dollars and alleviates pressure on yields.
In parallel, economic data releases are being delayed, limiting immediate catalysts for hawkish monetary sentiment.
This strange silence — a “data blackout” — has turned into a tailwind for risk assets.
Investors, deprived of fresh macro volatility triggers, have doubled down on equities, particularly in sectors where growth stories remain intact.
The Nasdaq’s surge during this period underscores how liquidity dynamics can outweigh fiscal uncertainty, at least temporarily.
Behind the index’s breakout is the continued dominance of mega-cap tech and AI-related sectors.
When rates fall, growth duration stocks benefit the most.
This isn’t just speculative enthusiasm — it’s mathematical.
Lower discount rates make long-dated cash flows more valuable, hence the Nasdaq’s outperformance versus the Dow or S&P 500 during periods of easing policy.
In essence, the market is repricing future innovation — betting that the Fed’s move to re-stimulate growth will extend the AI and tech spending supercycle into 2026.
If the Fed follows through on the 25bps cut, it will mark the start of a transitionary easing phase, shifting from restrictive policy to neutral accommodation.
This move provides a liquidity floor beneath equities, making pullbacks more limited unless macro data severely disappoints.
Historically, initial rate cuts — especially when pre-emptive rather than reactive — have triggered multi-month rallies in equities.
That’s because they ease funding conditions before major economic stress appears.
The real volatility trigger won’t be the rate cut itself — it’s already priced in — but rather Powell’s tone during the 2:30 AM Fed press conference.
There are two possible interpretations:
Dovish Powell:
If he emphasizes the Fed’s confidence in disinflation and its willingness to support growth, risk sentiment will remain strong.
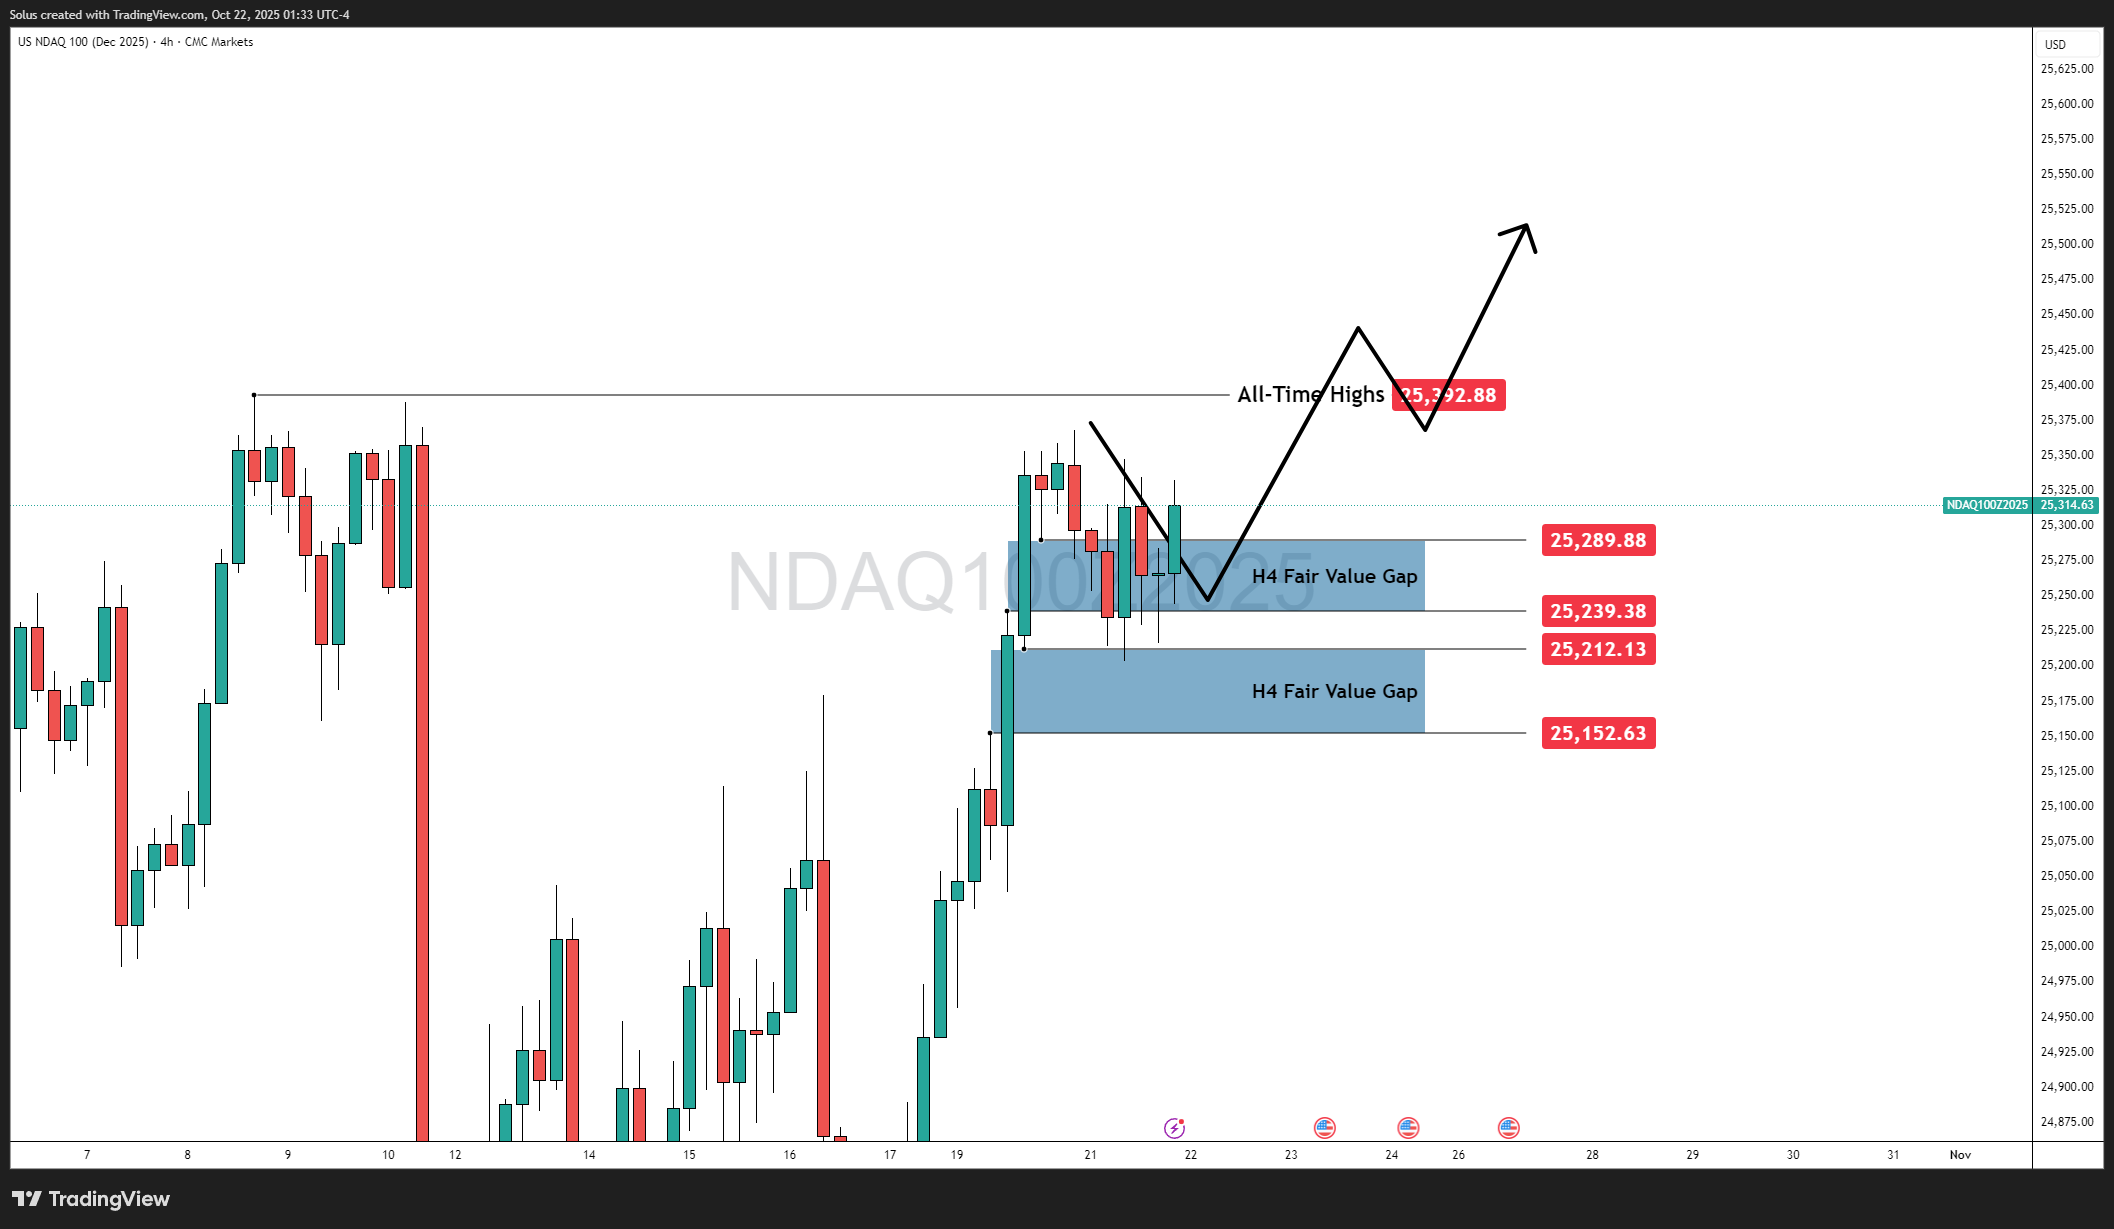
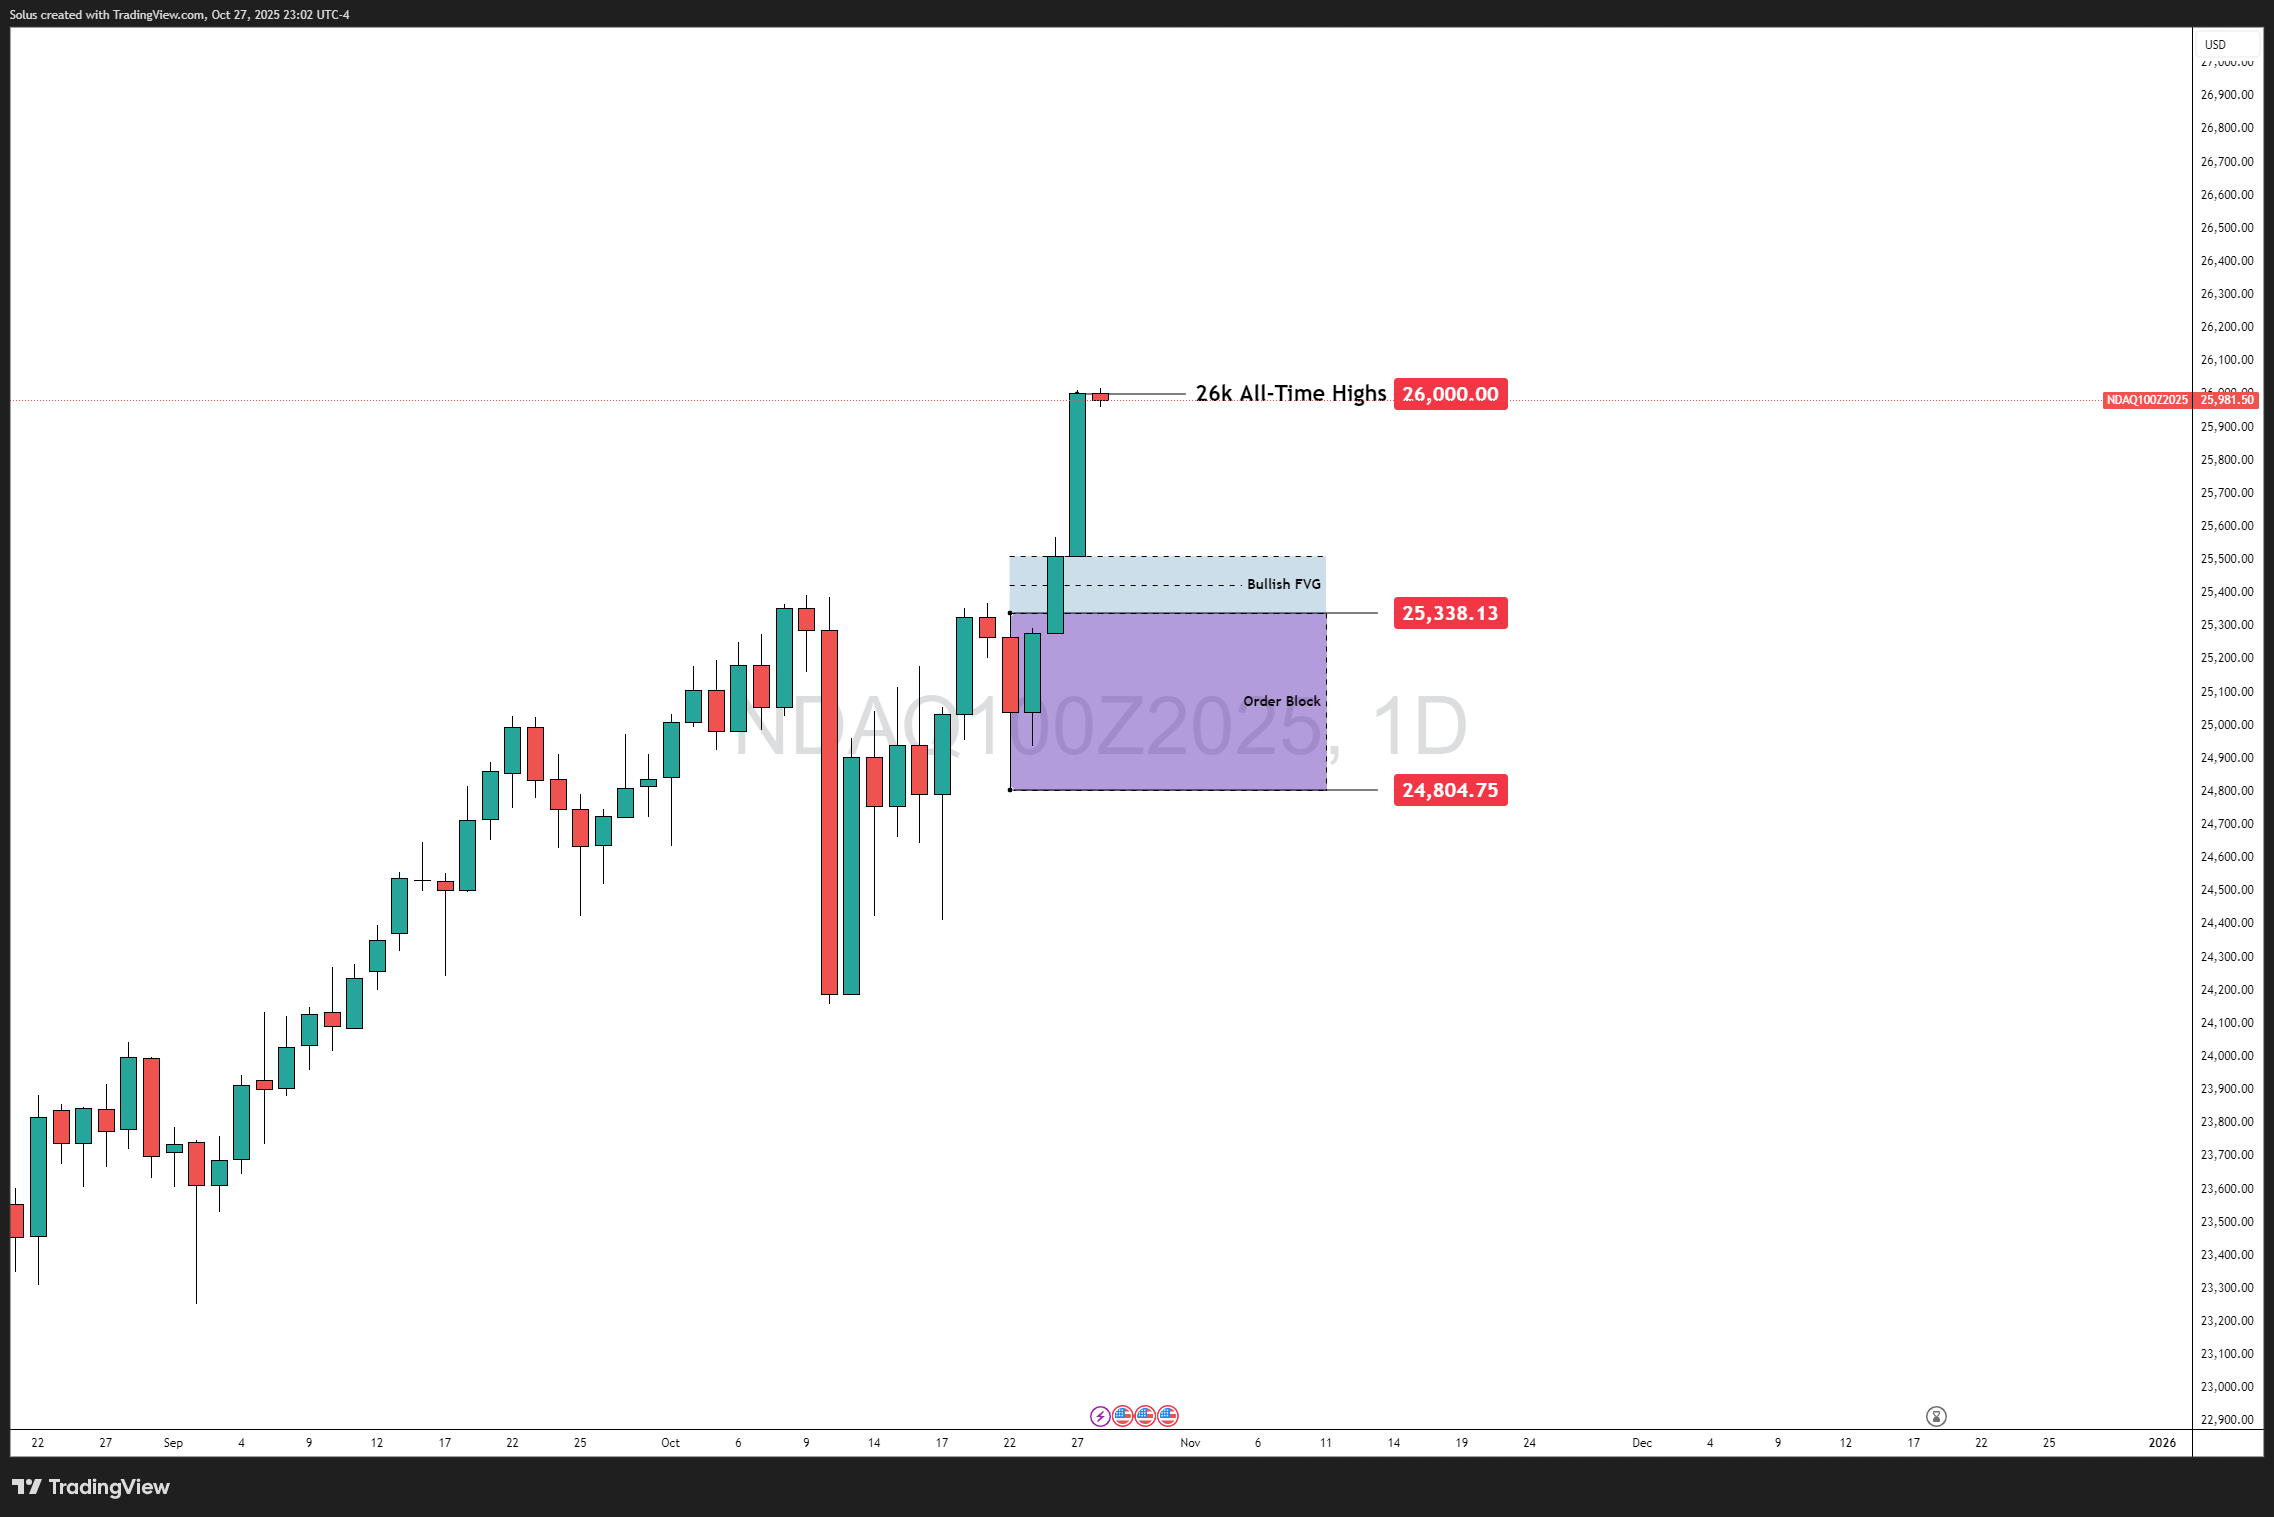
This scenario could extend Nasdaq’s breakout to 26,250–26,500, possibly initiating a fresh leg higher before year-end.
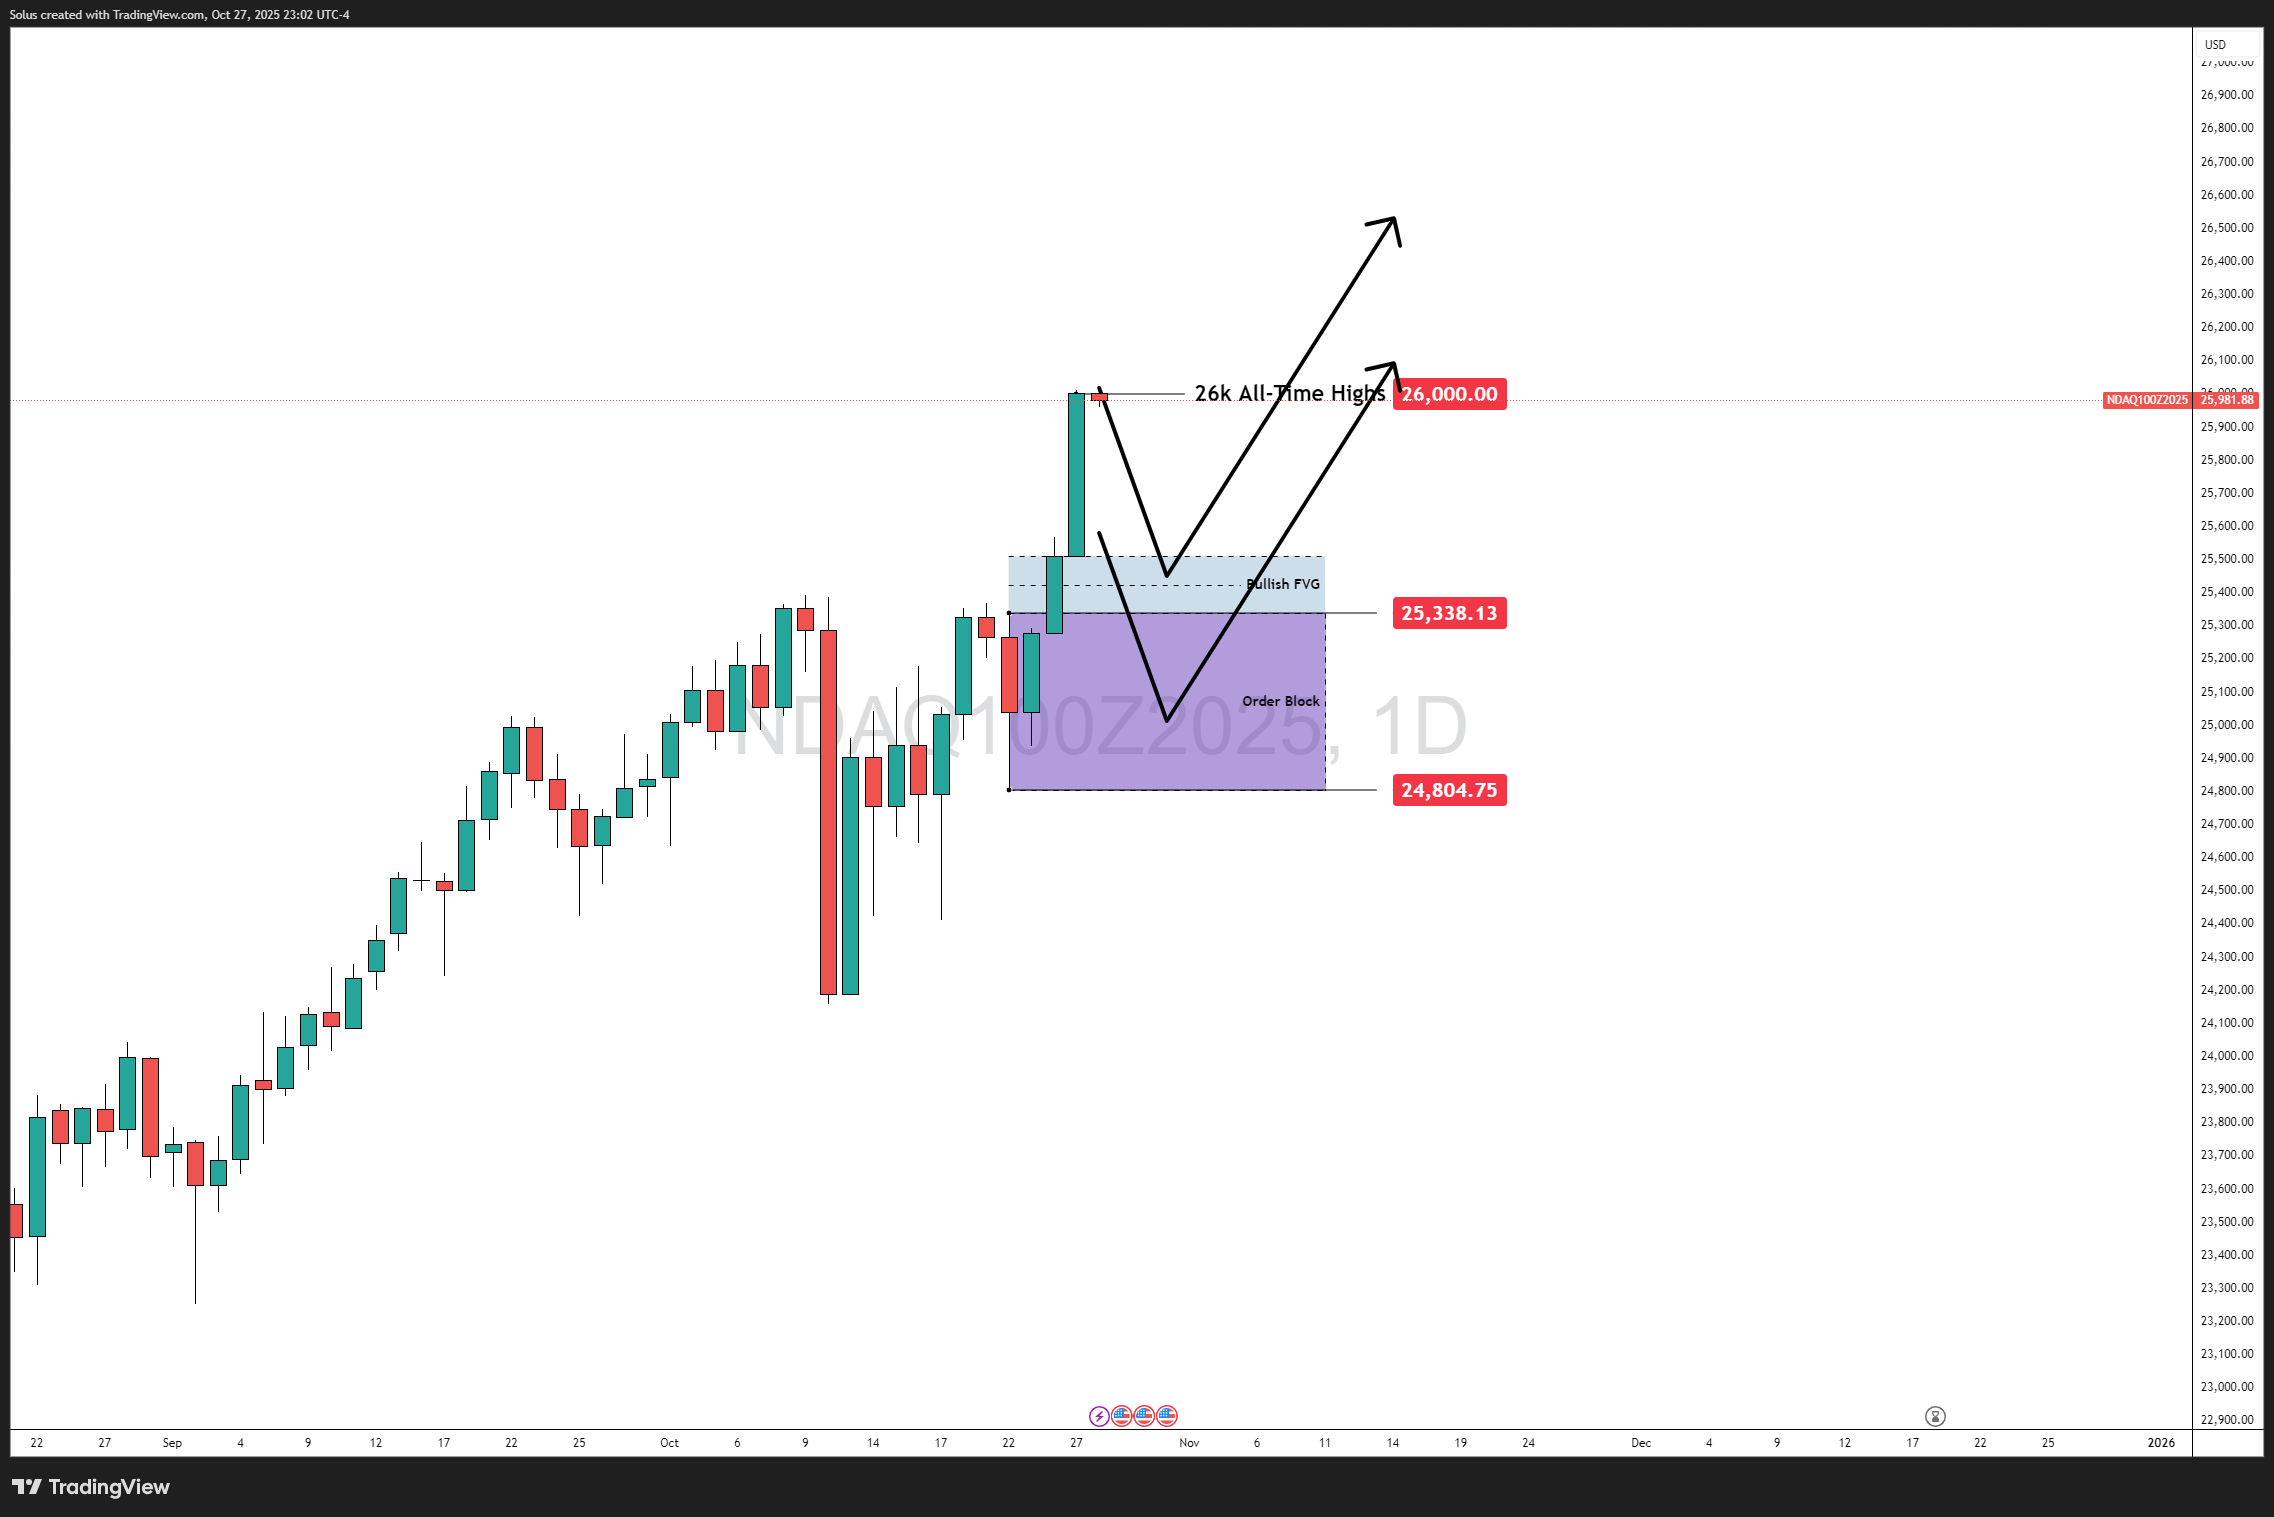
Cautious Powell:
If he frames the cut as a “technical adjustment” rather than the start of an easing cycle, markets may interpret it as a “one and done” move, leading to short-term profit-taking and a pullback toward 25,700–25,450.
In both cases, Nasdaq’s structural trend remains bullish — but tone determines the pace and depth of the next move.
Also on the calendar this week is the U.S. Advance GDP print (October 30, 8:30 PM), forecast at 3.0% QoQ, down from 3.8% previously.
A weaker reading would reinforce the need for easing, further supporting equities.
However, a surprise upside may briefly reignite “higher for longer” fears, creating short-term volatility.
Traders should note: the sequencing of the events matters — the rate decision first, then Powell’s tone, followed by GDP data.
By the time GDP lands, market positioning will already be established, magnifying any overreactions.
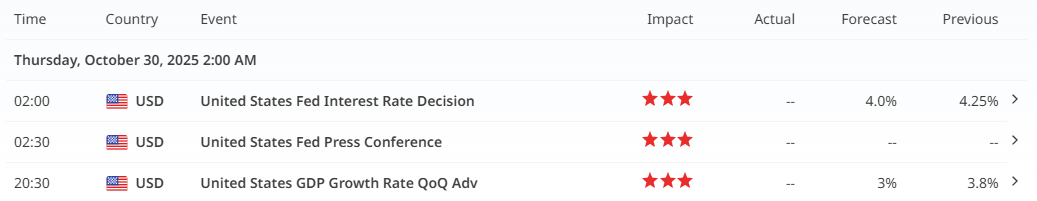
On the chart, Nasdaq 100 Futures (NDAQ100Z2025) have surged into price discovery mode, holding steady around 25,950–26,000 after a nine-day consecutive advance.
Momentum remains heavily bullish, with the most recent candles showing minimal wicks — an indication of strong buying pressure and minimal intraday rejection.
What we’re witnessing is the perfect alignment of fundamentals, liquidity, and positioning.
Institutional flows, retail sentiment, and macro expectations are synchronized in one direction — higher.
The Fed’s anticipated cut acts as both a fundamental and psychological catalyst, encouraging traders to price in renewed optimism before confirmation.
Moreover, the lack of major economic data due to the shutdown has given markets the breathing room to extend trends uninterrupted by short-term noise.
Liquidity is returning, volatility is contained, and every dip has been quickly absorbed.
But caution is warranted: when everyone is on one side of the boat, volatility spikes can be sharp once profit-taking begins.
The Nasdaq 100’s breakout into all-time highs encapsulates the forward-looking nature of modern markets.
Even as the U.S. government remains in partial shutdown, traders have turned their gaze toward monetary policy and liquidity dynamics.
The rate cut is priced in — but the tone is not.
That single variable will decide whether we see an acceleration toward 26,500 or a short-term reversion toward support.
As things stand, structural momentum favors the bulls. The rally isn’t merely speculative; it’s underpinned by liquidity repricing, institutional demand, and the return of growth optimism.
Nasdaq has officially entered its next chapter — one that could define how markets close 2025 and open 2026.
It’s time to go from theory to execution - risk-free.
Create an Account. Start Your Free Demo!
Looking for step-by-step approaches you can plug straight into the charts? Start here:
Sharpen your edge with proven tools and frameworks:
News moves markets fast. Learn how to keep pace with SMC-based playbooks:
From NASDAQ opens to DAX trends, here’s how to approach indices like a pro:
Gold remains one of the most traded assets - here’s how to approach it with confidence:
Candlesticks are the building blocks of price action. Master the most powerful ones:
Ready to go intraday? Here’s how to build consistency step by step:
Markets swing between calm and chaos. Learn to read risk-on vs risk-off like a pro:
Step inside the playbook of institutional traders with SMC concepts explained:
Forex pairs aren’t created equal - some are stable, some are volatile, others tied to commodities or sessions.
If you’ve ever been stopped out right before the market reverses - this is why:
Mindset is the deciding factor between growth and blowups. Explore these essentials:
The real edge in trading isn’t strategy - it’s how you protect your capital:
If you’re not sure where to start, follow this roadmap:
This way, you’ll grow from foundation → application → mastery, instead of jumping around randomly.
Follow me for more daily market insights!
Jasper Osita - LinkedIn - FXStreet - YouTube
This content may have been written by a third party. ACY makes no representation or warranty and assumes no liability as to the accuracy or completeness of the information provided, nor any loss arising from any investment based on a recommendation, forecast or other information supplies by any third-party. This content is information only, and does not constitute financial, investment or other advice on which you can rely.
ACY Securities is one of Australia's fastest growing multi-asset online trading providers, offering ultra-low-cost trading, rock-solid execution, technologically superior account management and premium market analysis.
Select the categories and companies you wish to follow directly to your person rss feed.
Create Custom RSS FeedSign up and join over 5,000 professional members who receive personalized news alerts, curated professional connections, and more for free!
Sydney-based multi-asset broker ACY Securities has introduced PAXGUSD, a new CFD instrument that allows clients to trade tokenised gold against the US Dollar 24 hours a day, seven days a week. The instrument is available across MetaTrader 4, MetaTrader 5, and the ACY Trading Platform.
Binance has lowered its VIP 3 Wallet Assets threshold from $3 million to $1 million and will now count OTC Spot Trading Volume at a 4x multiplier toward VIP qualification, removing the previous VIP 4 cap and allowing eligible users to progress through the full tier framework up to VIP 9.
Retail futures trading leader NinjaTrader Group has appointed Mark Omens as Senior Vice President, Commercial Strategy, bringing a 25-year veteran of derivatives marketplace CME Group into a newly created role focused on exchange partnerships and enterprise growth.
Gold Price Action Forecast: Will XAU/USD Drop to $3930? Meta Description: Read our Gold price action forecast to see if XAU/USD will drop to $3930.
BitDelta Securities Financial Services LLC (“BitDelta Securities”) today announced that it has received full regulatory approval from the Capital Market Authority (“CMA”) of the United Arab Emirates under the Category 5 — Arrangement and Advice license framework (License No. 20200000439). The approval follows the firm's receipt of In-Principal Approval earlier this year and represents the successful conclusion of the CMA's full licensing process, including the satisfaction of capital requirements, governance appointments, and operational setup.
Crypto.com has received a $400 million strategic investment from Citadel Securities, valuing the firm at $20 billion. It marks the first institutional funding round in the company's history, aimed at accelerating its expansion into tokenised securities, derivatives and other asset classes.
WTI’s pullback into $79–82 is the first major test of the bullish Elliott Wave count, with buyers targeting a renewed break above $85.

BitDelta Securities has secured a full CMA Category 5 licence in the UAE and opened a regulated office in Business Bay, Dubai. The firm operates as an introducing broker, connecting investors with licensed international brokers across multiple asset classes, with CEO Dr. Demetrios Zamboglou commenting on the milestone.
Index volatility is asleep while single stocks fight it out underneath, credit refuses to confirm the equity rally, and a bare macro calendar hands next week to oil.
Digital assets and FX brokerage GC Exchange FZE (GCEX) has appointed Mohammed A. Mulla as a Board Member of its Dubai-based entity, part of the wider GCEX Group.