just now

Liquidity Finder Ltd is incorporated in England and Wales, company number 10610740, registered address 167-169 Great Portland Street, Fifth Floor, London W1W 5PF, United Kingdom.
Published: just now


Now that the Fed has made its move—holding rates steady—the focus shifts from policy to price. With the fundamental catalyst already in line, it's time to check out the charts to map potential directions. This is where traders stop reacting to headlines and start reading the structure.
Whether the dollar continues to rally or starts to fade, the path forward will be shaped by price movements.
After a sharp drop in early April, USDJPY has shown signs of stabilization. Price is now consolidating between 142.400 and 146.000, forming a potential accumulation zone for upside potential.
Daily
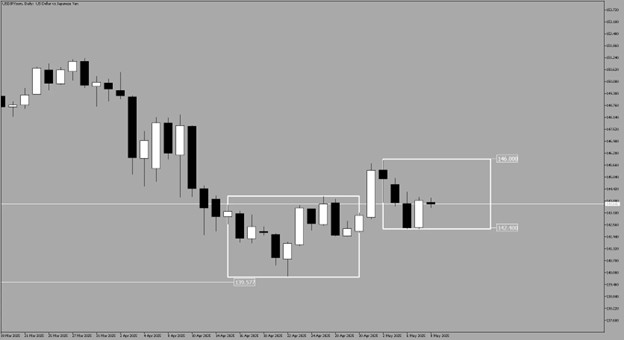
On the Daily, USDJPY is creating a bullish sequence with a new high in favor of the Dollar.
Dollar is currently testing the previous resistance for a potential support level for upside move.
4-Hour
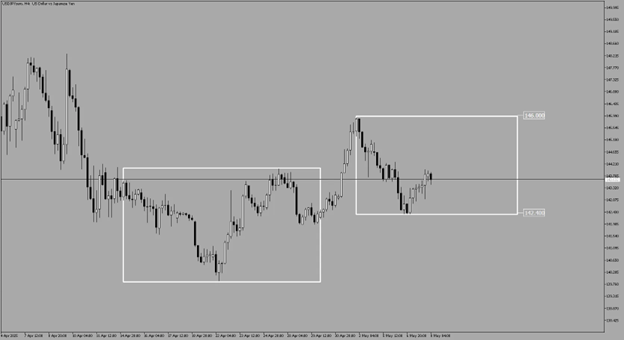
USDJPY is approaching the equilibrium level with a potential bullish traction ahead, as long as we break out of the 50% line.
📈 Bullish Scenario
📉 Bearish Scenario
The Aussie is currently at a key decision point. After breaking out of its prior range, price is now retesting the former resistance zone—potentially turning it into support. Momentum has stalled, and the next few candles will decide whether bulls reclaim control or bears drag price back into the range.
Daily
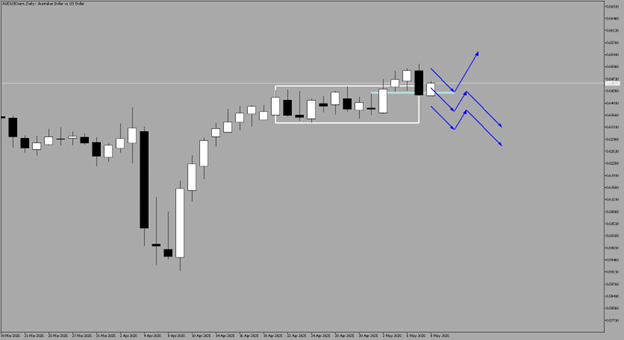
Aussie is currently testing the previous resistance level and is potentially turning into a support level resting at 0.64400 - 0.64500.
As of now, the level is trying to hold with fair value gap resting at 0.64271 - 0.64333 still intact.
4-Hour
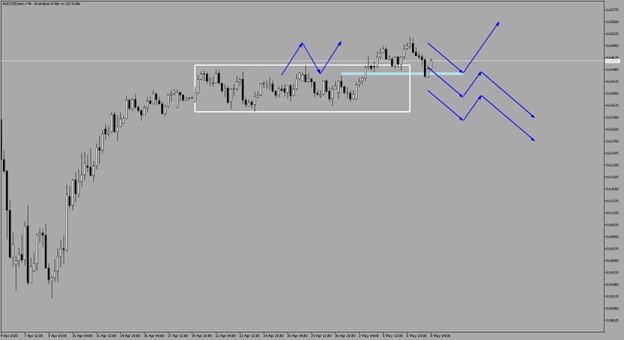
If we don’t see a bullish sequence, price creating new higher highs and higher lows, we might see a continued downside for the Aussie.
📈 Bullish Scenario
📉 Bearish Scenario
➤ First: 0.63700
➤ Deeper pullback: 0.62800 and 0.62200
Daily
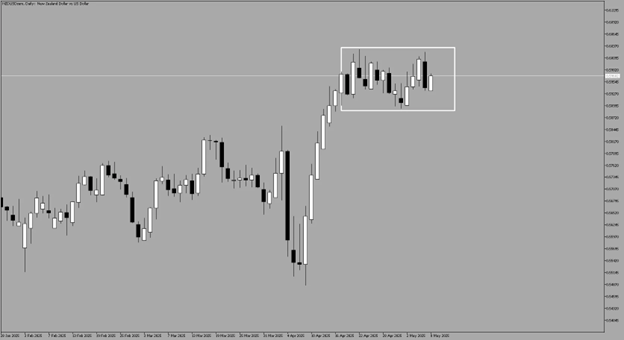
While the Australian Dollar has broken out of the range with potential new highs ahead, after a strong April rally, Kiwi has stalled into a consolidation phase. The pair is currently trapped between support and resistance, with neither side yet in control.
4-Hour
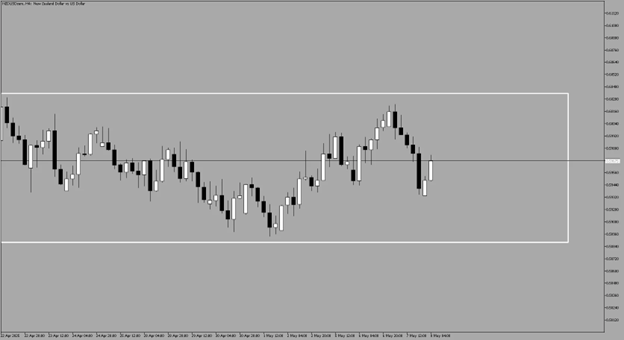
Still inside the broader consolidation but showing signs of temporary strength.
📈 Bullish Scenario
📉 Bearish Scenario
Daily
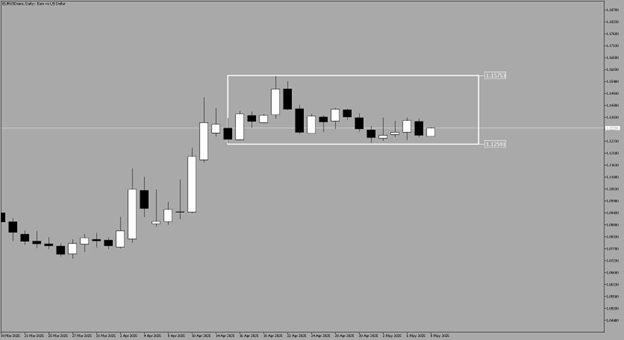
Euro has been on a range-bound market since mid-April and, so far, has not given traders a sustained directional bias either to the upside or downside—making this a “wait-for-confirmation” environment.
4-Hour
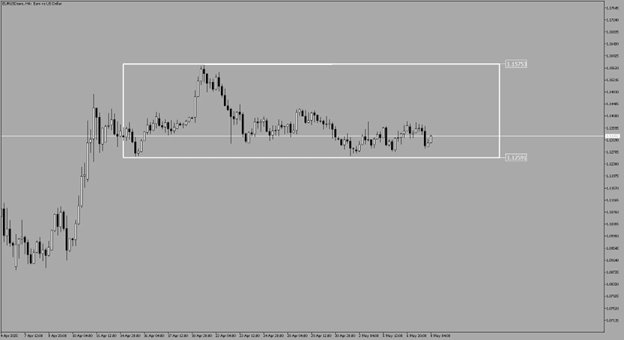
4-hour clearly shows that Euro is not gaining traction as it trades below equilibrium for quite sometime already.
Despite dollar weakness, Euro has not able to exhibit a bullish momentum.
📈 Bullish Scenario
📉 Bearish Scenario
Daily
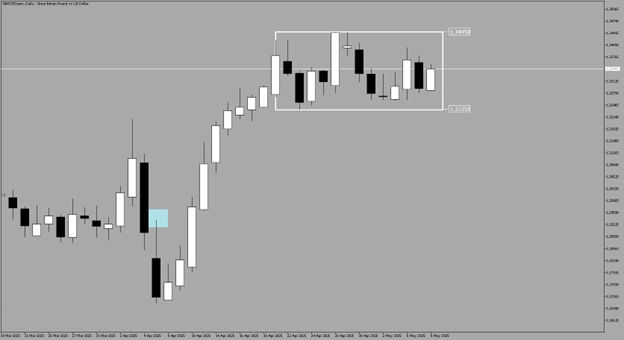
Cable is stuck inside a clean horizontal range between 1.32350 – 1.34450, following a strong upward impulse in early April. Price action is now coiling mid-range, waiting for a catalyst to break this compression.
4-Hour
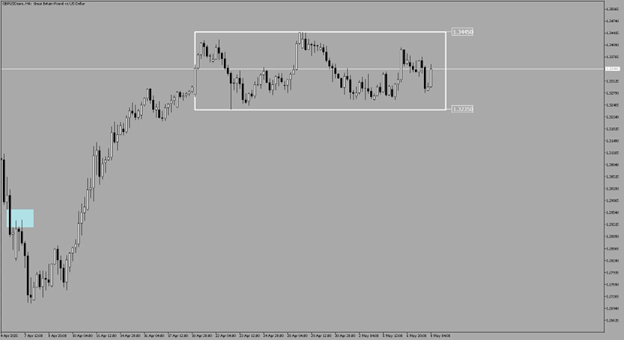
Unlike, Euro, Pound is trading nicely near equilibrium, displaying high volatility and momentum.
📈 Bullish Scenario
📉 Bearish Scenario
Daily
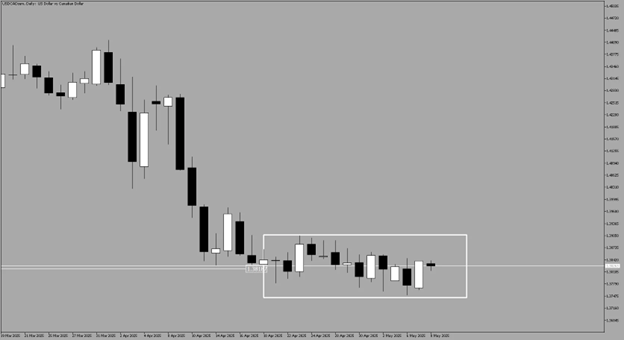
The pair remains firmly locked in a tight consolidation range after a sustained sell-off in early April. Bulls have failed to reclaim directional control, while bears are yet to push below key support. Momentum is clearly muted—and traders are waiting for a decisive breakout.
4-Hour
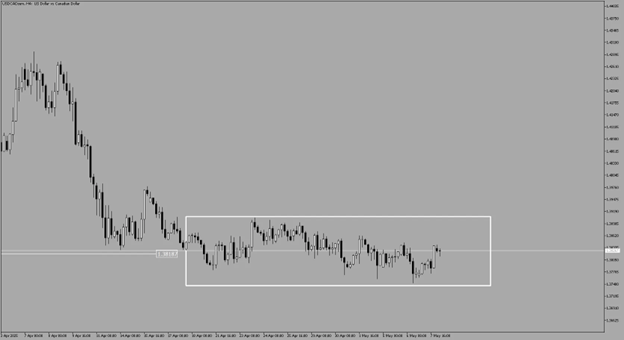
Several up and down ticks are obvious at both ends, hinting traps or failed break attempts. This also shows a sign of low liquidity and momentum.
📈 Bullish Scenario
📉 Bearish Scenario
Daily
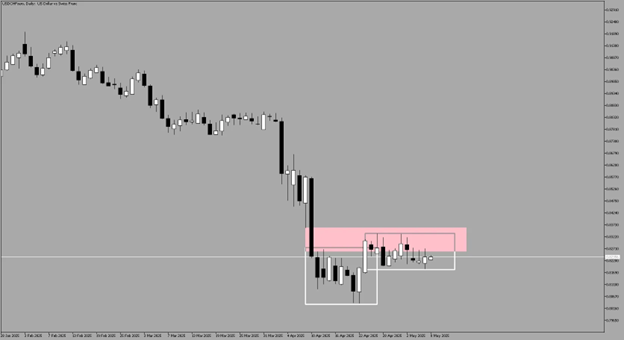
After a sharp drop in early April, USDCHF is currently stalling with signs of slowing down as ranges are developing with a bullish sequence pattern.
Price remains stuck in a sideways grind, hinting at potential distribution unless bulls can reclaim the upper region.
The daily FVG is also holding at 0.82582-0.83594 for a bearish bias.
4-Hour
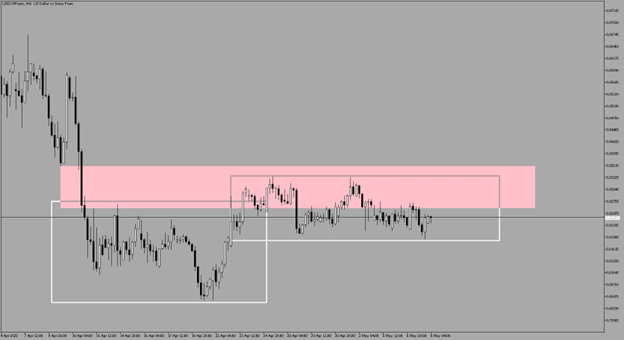
On the 4-hour, USDCHF is in a tight spot with no clear signs of momentum trading between the 0.81817-0.83363 range.
📈 Bullish Scenario
📉 Bearish Scenario

While the Fed has paused, the market hasn't. From this point forward, price is the driver—and structure will define the opportunity.
Across major pairs, we're seeing a common theme: range-bound markets, key retests, and decision zones. This isn't the time to anchor bias. It's a time to stay flexible, read the levels, and let price confirm the next directional leg.
Universal Action Plan for Any Strategy:
Don't marry a bias. Marry your process.
Even the cleanest setup can flip if macro catalysts or liquidity flows shift. Ranges can expand, and false breakouts can trap the best plans. Patience and adaptability are the edge now.
This content may have been written by a third party. ACY makes no representation or warranty and assumes no liability as to the accuracy or completeness of the information provided, nor any loss arising from any investment based on a recommendation, forecast or other information supplies by any third-party. This content is information only, and does not constitute financial, investment or other advice on which you can rely.
ACY Securities is one of Australia's fastest growing multi-asset online trading providers, offering ultra-low-cost trading, rock-solid execution, technologically superior account management and premium market analysis.
Select the categories and companies you wish to follow directly to your person rss feed.
Create Custom RSS FeedSign up and join over 5,000 professional members who receive personalized news alerts, curated professional connections, and more for free!
Sterling steadies after political uncertainty rattled gilt markets, while EUR/USD and EUR/GBP approach key technical levels ahead of today's European session.
GBP/AUD remains trapped in a well-defined bearish trend on both the weekly and daily timeframes.
Discover the key drivers, technical levels, and central bank expectations shaping the EUR/USD trend as the ECB prepares to hold rates and markets watch for a potential breakout.
Sydney-based multi-asset broker ACY Securities has introduced PAXGUSD, a new CFD instrument that allows clients to trade tokenised gold against the US Dollar 24 hours a day, seven days a week. The instrument is available across MetaTrader 4, MetaTrader 5, and the ACY Trading Platform.
Binance has lowered its VIP 3 Wallet Assets threshold from $3 million to $1 million and will now count OTC Spot Trading Volume at a 4x multiplier toward VIP qualification, removing the previous VIP 4 cap and allowing eligible users to progress through the full tier framework up to VIP 9.
Retail futures trading leader NinjaTrader Group has appointed Mark Omens as Senior Vice President, Commercial Strategy, bringing a 25-year veteran of derivatives marketplace CME Group into a newly created role focused on exchange partnerships and enterprise growth.
Gold Price Action Forecast: Will XAU/USD Drop to $3930? Meta Description: Read our Gold price action forecast to see if XAU/USD will drop to $3930.
BitDelta Securities Financial Services LLC (“BitDelta Securities”) today announced that it has received full regulatory approval from the Capital Market Authority (“CMA”) of the United Arab Emirates under the Category 5 — Arrangement and Advice license framework (License No. 20200000439). The approval follows the firm's receipt of In-Principal Approval earlier this year and represents the successful conclusion of the CMA's full licensing process, including the satisfaction of capital requirements, governance appointments, and operational setup.
Crypto.com has received a $400 million strategic investment from Citadel Securities, valuing the firm at $20 billion. It marks the first institutional funding round in the company's history, aimed at accelerating its expansion into tokenised securities, derivatives and other asset classes.
WTI’s pullback into $79–82 is the first major test of the bullish Elliott Wave count, with buyers targeting a renewed break above $85.


