
Revenue Per Million – Understanding And Optimising Brokerage Profitability
June 06, 2022 - The following is a guest article written by Stavros Economides, Chief Operating Officer of CySec regulated Match Prime Liquidity:
Every broker’s revenues depend on B-Book and A-Book profitability models. The ability to understand, calculate, and optimise those concepts enables brokers to have a good idea of existing and potential earnings given the volume, especially if the broker has been operating for years and historical volumes and statistics are available. Unfortunately, many brokers still do not understand where these numbers derive from. As a result, they start operations by spending more than needed on marketing, bonuses, technology and other brokerage operations. It is not surprising then that they fail in the short or medium-term as they cannot generate more than what they spend.
What is RPM, and how to calculate it?
The primary metric to monitor brokerage profitability is Revenue per million (RPM), which tells us how much profit the broker generates with one million USD volume traded.
What is needed to calculate RPM correctly? First, it is ideal if the brokerage can run its data warehouse, as it gives more flexibility and direct access to raw data. However, for many brokers, especially smaller ones, such a solution is not available. They are left with manual exporting data to Excel, which is time-consuming, exposed to human errors, and not the most efficient way of preparing such statistics. Alternatively, brokers can use data calculated by reporting modules. Those are usually available in the bridge solutions created by technology providers.
Let’s assume a broker already has a solution to collect data. Now he needs to ensure that it is correct. In the past, we have seen brokers using data from test accounts on live servers or double calculating volumes and profits from PAMM account managers and their followers. Using custom plugins also needs to be taken into consideration in situations when brokers book rollover value as an independent ledger, give automatic cashback or book swaps for Islamic accounts in some specific way. All such corner cases need to be foreseen and included in a calculation to avoid blurring the real picture of profitability, especially for startup companies.
“Lots”, commonly used in MT4, are the most popular and basic measure of traded volume. Usually, brokers give their IBs agent commissions per lot traded or cashback for reaching some threshold in the number of traded lots. Unfortunately, every lot can have a different value in USD. Due to different underlying instruments or contract sizes, these measures are useless for comparing volumes between brokers or as a reference for profitability calculation.
Fortunately, in recent years thanks to the institutionalisation of the CFD industry, many liquidity providers and bridges have been calculating volumes in a million USD traded. At Match-Prime, we calculate every transaction value in USD. As a result, the account’s base currency or underlying instrument doesn’t affect the outcomes. This approach allows filtering and grouping volumes as needed. Ideally, we recommend implementing the same methodology instead of using only general data provided by some solution providers.
As soon as we have all the necessary data, we are ready to calculate Revenue Per Million. B-Book flow’s RPM is relatively easy to calculate as we need to divide overall B-Book profit from closed positions by volume in USD related to those transactions. Some brokers calculate RPM by also including the delta of open P&L but based on our experience, this is not recommended.
The situation looks a bit more complicated when it comes to A-Book RPM calculation, as we explained in our previous article about the FIFO rule. Comparing only closed profits between hedge accounts and clients’ accounts will not give correct results. One solution is to include the delta of open P&L into the calculation (it must be calculated based on EOD or EOM Statements from all LPs and traders). The second option, preferred by Match-Prime’s clients, is using A-Book Profitability Report generated from Match-Trade Bridge. In this report, brokers get the value in USD (of profits generated on A-Book flow), which can be divided by volume in the same way as in the B-Book RPM calculation.
Brokers must remember that the sample they want to employ needs to be big enough to make RPM useful and interpretable. A diversified and extensive flow is necessary; otherwise, one more significant client can cloud the entire picture. In such cases, we can remove long tails from our calculation and monitor them separately. Still, there is no point in calculating RPM for just a few clients.
How to interpret RPM?
Like with every statistic, it is good to have a benchmark we can compare RPM with. Suppose you are an existing broker who has been collecting statistics from previous years. In that case, it is worth comparing the results with the past to see if you are in line with your business’s average profitability and if there is any explanation for deviations from historical averages.
Also, it is imperative to check where our brokerage profitability stands compared to industry averages. The question is where we should look for such benchmarks as there are no industry reports with such statistics. Fortunately, more and more CFD brokers go public and are obligated to publish quarterly reports. In some quarterly summaries, RPM is shown directly, and in others, we need to do some calculations on our own. The recommended benchmark is the report from XTB, the biggest Polish brokerage. Below you can find some example statistics from the said report.
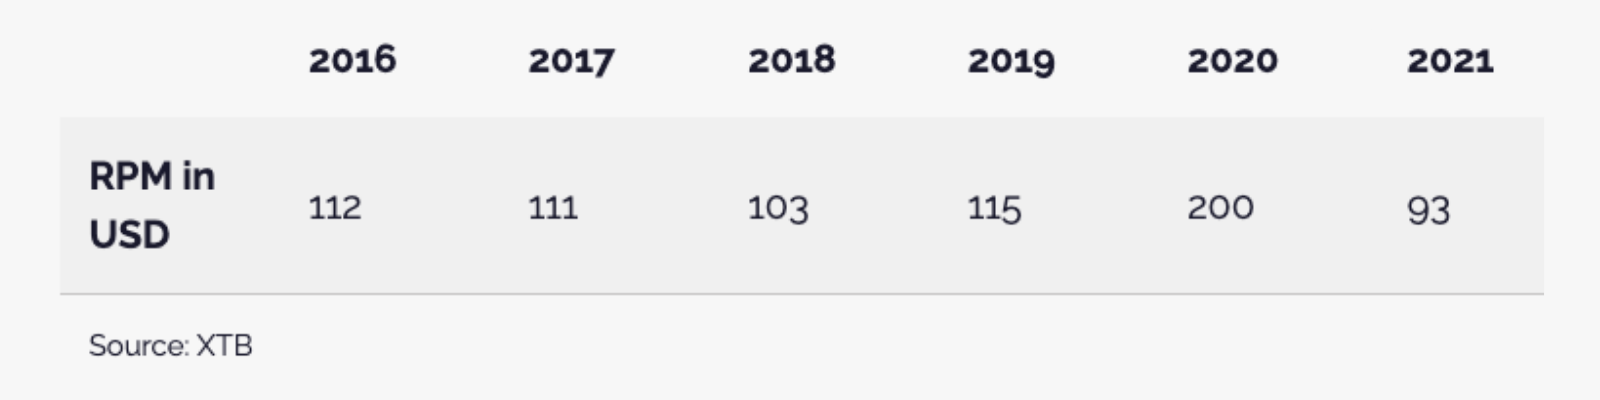
Based on the above data, we can see that RPM should be around $110/million up to $200/million in a good year.
However, RPM depends on many factors. In the above example, most of the XTB’s clients are from Europe, where traders are more experienced and ESMA regulations regarding leverage are in place. If we compare those numbers with brokers focused only on the MENA region or South-East Asia, where traders are used to very aggressive trading, they might seem lower than average.
RPM numbers also vary according to the trading conditions, such as how aggressive the broker is with spreads, commissions, and swaps.
Going deeper into RPM
What is behind RPM? Where do brokerage revenues come from? Understanding this part will allow brokers to monitor, react and adjust particular trading conditions to maintain RPM at optimal levels. Revenues of brokerages are generated by spread, commissions, swaps, and results on transactions (Market Making). How much share does each type of revenue source have in overall income? Let’s go back to the example of XTB, which prepared useful statistics in their yearly financial statements.
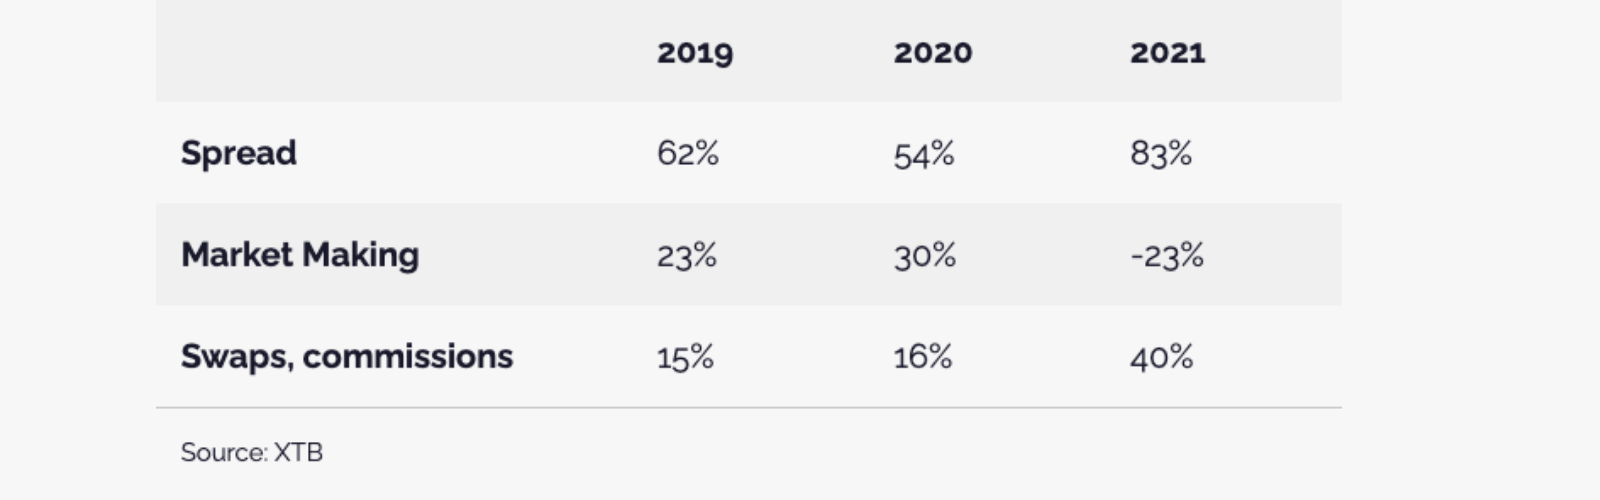
Let’s first focus on how the above statistics were calculated. For every transaction, we can calculate the spread cost in USD as the difference between the execution price and mid price and then multiply it by the point value for that specific transaction. Value of commission and swaps is easy to find as in almost every trading system, they are automatically assigned to particular transactions. When we have both values, we can compare them with overall revenue. Let’s assume a broker generated $1mln revenue, while from the spread, swaps and commissions, only $700k was charged. This means that the rest of the 300 thousand was earned on internalising risk (“Market Making” in the above table). Based on historical data, we can see that between 65% and 75% of brokerage’s revenues depend on transaction costs, and only 25%-35% is the result of being a counterparty for the trade. As we can observe in the example provided by XTB, in 2021, the result from Market Making was negative. This was also a result of lower RPM that year.
Having the right data, we can go even further with our analysis by comparing RPM per asset class or even per single instrument. For example, many brokers, especially in Asia, focus on offering FX and precious metals.
Meanwhile, RPMs for indices are usually much higher than those for FX. From a business perspective, then, brokers should start promoting CFD for indices more actively, as this is what data shows us.
The same analysis can be done based on geographic regions to see which countries generate higher RPM. If a particular country generates significantly higher RPMs, brokers should consider establishing branches there or increasing marketing budgets due to good ROI.
How to optimise RPM and the importance of the Liquidity Provider
To start with, we need to monitor the long tails of RPM’s calculations (for example, if one client significantly changed yearly RPM). If some instruments have continuously very low RPMs, we need to consider increasing trading costs unless they are mainly used for promotion and cross-selling. Similar to the highest RPMs, we should check if we should promote more particular instruments as this will increase revenues for the company.
Secondly, the most effective way of growing RPMs is to consider hedging some group of traders with LP.
There are a few types of clients a broker should focus on while doing that. They are:
• Clients that trade continuously, thus making volumes and profiting systematically; • Clients or flow that impairs desired risk appetite of a broker and can damage company financials and yearly RPM. For example, internalising the flow of a client with a 500 thousand deposit is not worth it if a broker has a 500 thousand balance sheet, as this can easily damage financials; • Clients that abuse market conditions or try to abuse system deficiencies of a broker using advanced automated strategies instead of trading.
For all 3 of the above, brokers do not generate satisfactory RPM on these specific clients to keep this flow in their books. With that, there is an opportunity to route the flow out and increase profitability on the selected trading flow. In such cases, brokers can decide to hedge such clients either:
• fully, • automatically (hedge % of a flow), or • manually.
A manual hedge can be very useful when trading is one-directional, and the client is out of money. Brokers can engage by opening the same direction trades with LP to lock profits and, in some cases, when these profits are significant, ensure the good end of year financials.
Last but not least, it is crucial to have a liquidity provider with sufficient trading experience and knowledge to discuss and elaborate ways to optimise profitability. The flexibility of liquidity providers to discuss trading conditions, including spreads, swaps, leverages, and market depths, can play an essential role in broker profitability and risk optimisation. In scenarios where the broker doesn’t want to absorb all the risk (as market conditions are dynamic), it is vital that he can switch flow in real-time and make money.
Typically, each broker has internal risk limits according to risk appetite and regulatory capital requirements.
Conclusion
Numbers don’t lie. Being able to calculate how much your broker is earning on B-Book based on current volume is very important. That allows for making the right risk, marketing and operating decisions. Expected earnings can be easily calculated on the A-Book model by comparing LP trading conditions with Broker trading conditions. With the ability to know and understand these numbers, brokers can operate more efficiently in terms of costs and know where to allocate resources to improve revenue generation. They can forecast their revenues, plan budgets efficiently, and run effective financial stress tests. If your brokerage’s data analysis is not satisfactory or you would like to consult your brokerage RPM statistics, you can take advantage of the Match-Prime team experience in that matter. Feel free to contact us directly at info@match-prime.com or use the links below to contact the sales team directly.
LiquidityFinder
LiquidityFinder was created to take the friction out of the process of sourcing Business to Business (B2B) liquidity; to become the central reference point for liquidity in OTC electronic markets, and the means to access them. Our mission is to provide streamlined modern solutions and share valuable insight and knowledge that benefit our users.
If you would like to contribute to our website or wish to contact us, please click here or you can email us directly at press@liquidityfinder.com.