just now

Liquidity Finder Ltd is incorporated in England and Wales, company number 10610740, registered address 167-169 Great Portland Street, Fifth Floor, London W1W 5PF, United Kingdom.
Published: just now
The S&P 500 index has gapped down by 71.95 in response to Trump’s tariff announcements.
Although the administration painted the tariffs as comparatively modest—alleging they’re half of what the U.S. faces abroad—markets interpreted the move as a provocative escalation. Traders priced in the risk of retaliatory measures and broader disruption, leading to a sharp selloff on the S&P 500 along with the broader market.
This forms a technical gap that traders must watch closely — either for a clear sign of rejection, or the potential formation of an exhaustion gap that could flip into support, much like the price action seen in August 2024.
A new market gap just formed between $5,499.53—$5,571.48, which will act as a key level of resistance if revisited. The resistance is also strengthened by a freshly broken, significant trendline support, formed since April of last year.
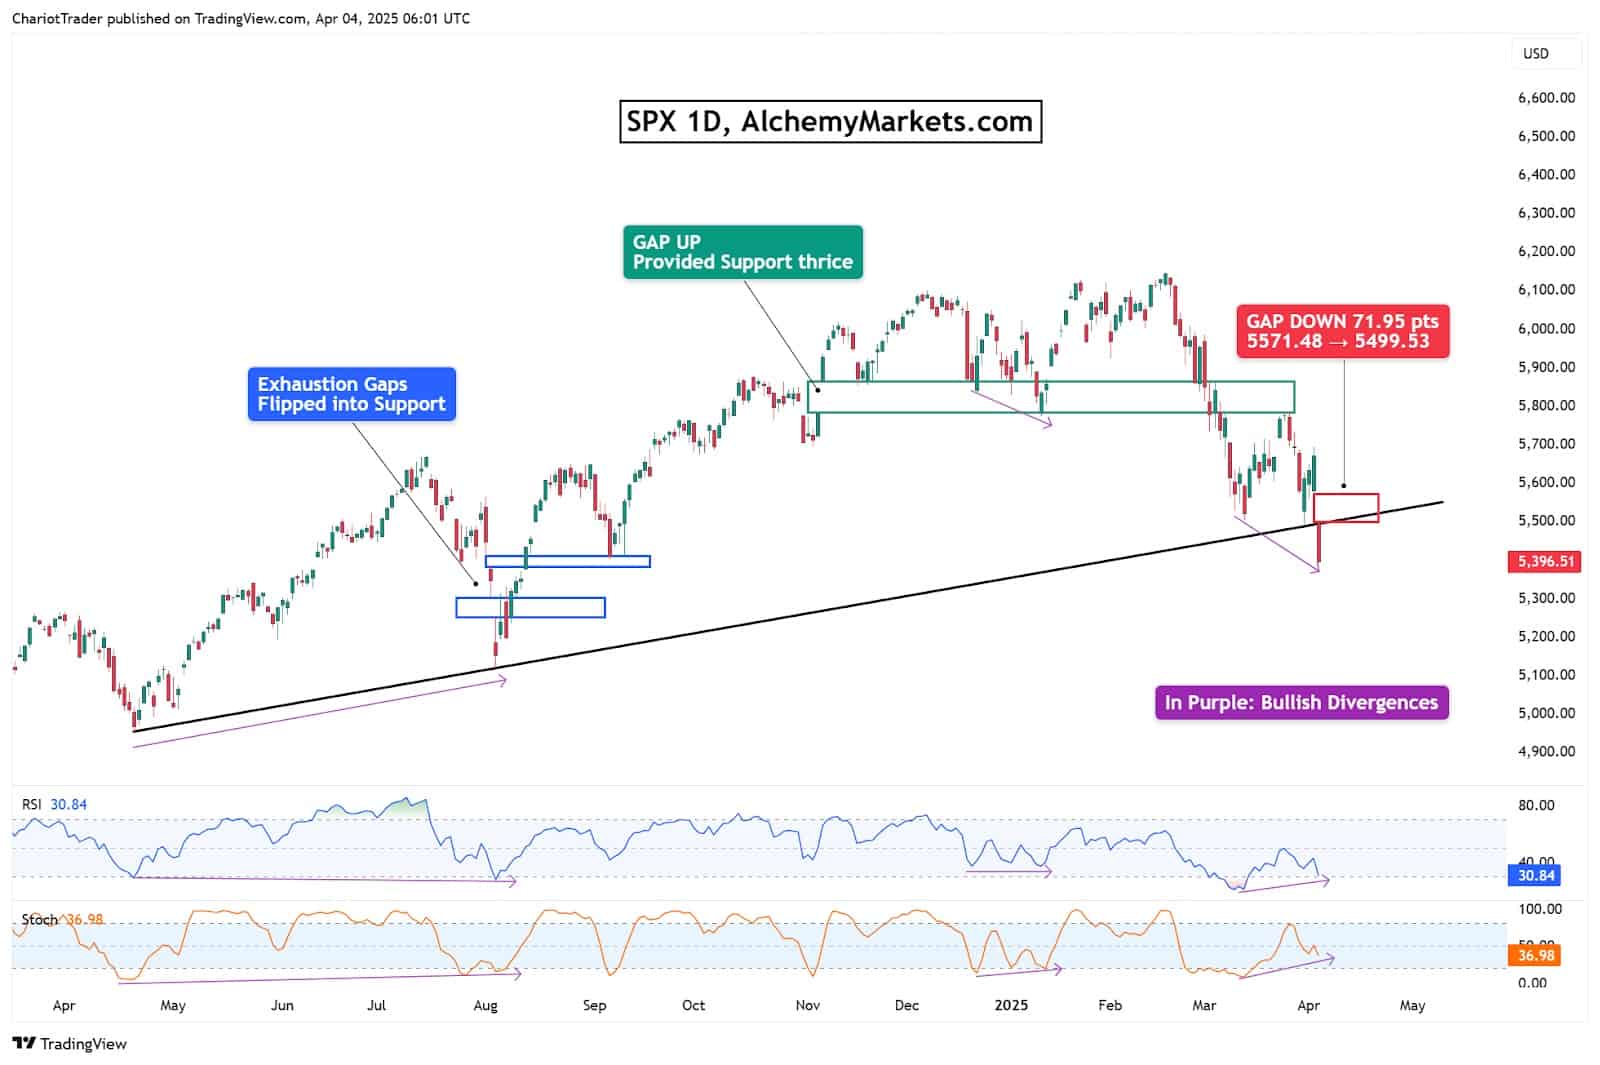
Looking back, we’ll notice that gaps in the chart, in conjunction with the trendline, and divergences on the RSI (in blue) and Stochastics (in orange) have always told an interesting tale on the S&P 500.
What we’ve found is that when a gap occurs, it tends to act as a key zone. The trendline has proven its key role as a bias filter (when price is above, shoot for longs, and when below, shoot for shorts), and the divergence helps anticipate a continuation or reversal:
August 2024 Gap Down Analysis
November 2024 Gap Up Analysis
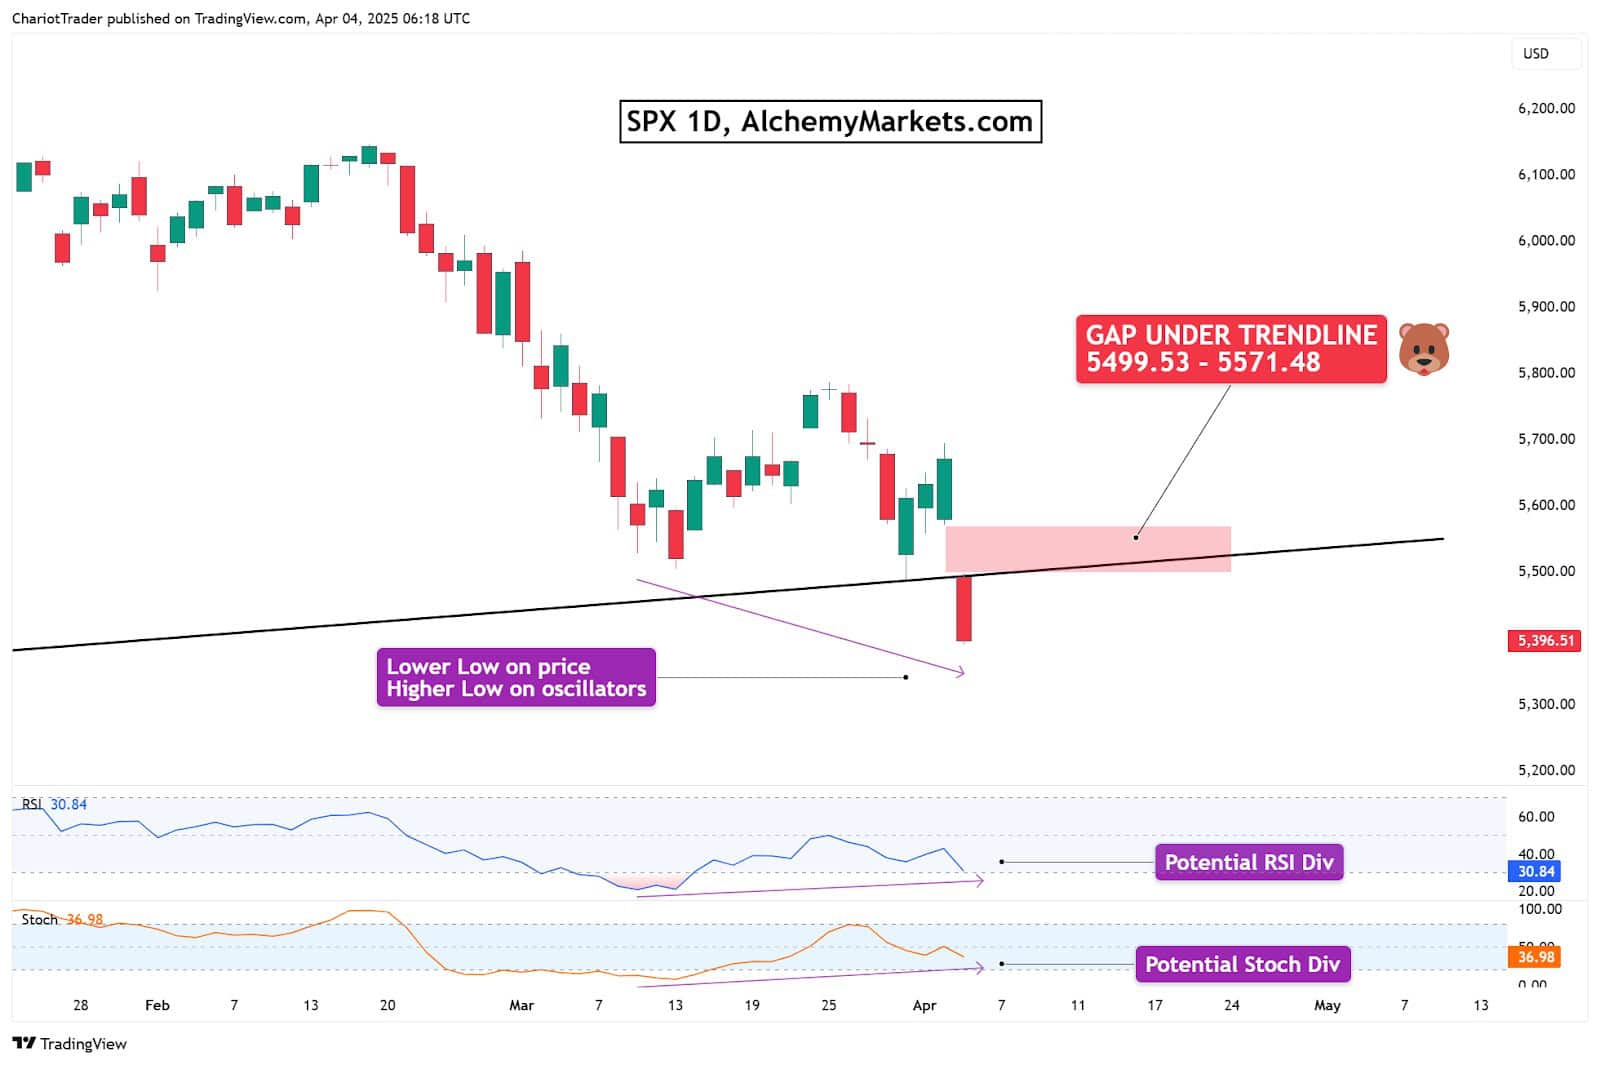
With the recent gap down, here’s the story unfolding:
How to approach this from a technical angle:
All in all, patience is key. Right now, the break below the trendline flips our bias bearish. Bullish traders should stay alert and maybe think in terms of: “Good news is just a retrace, bad news means bearish continuation.”
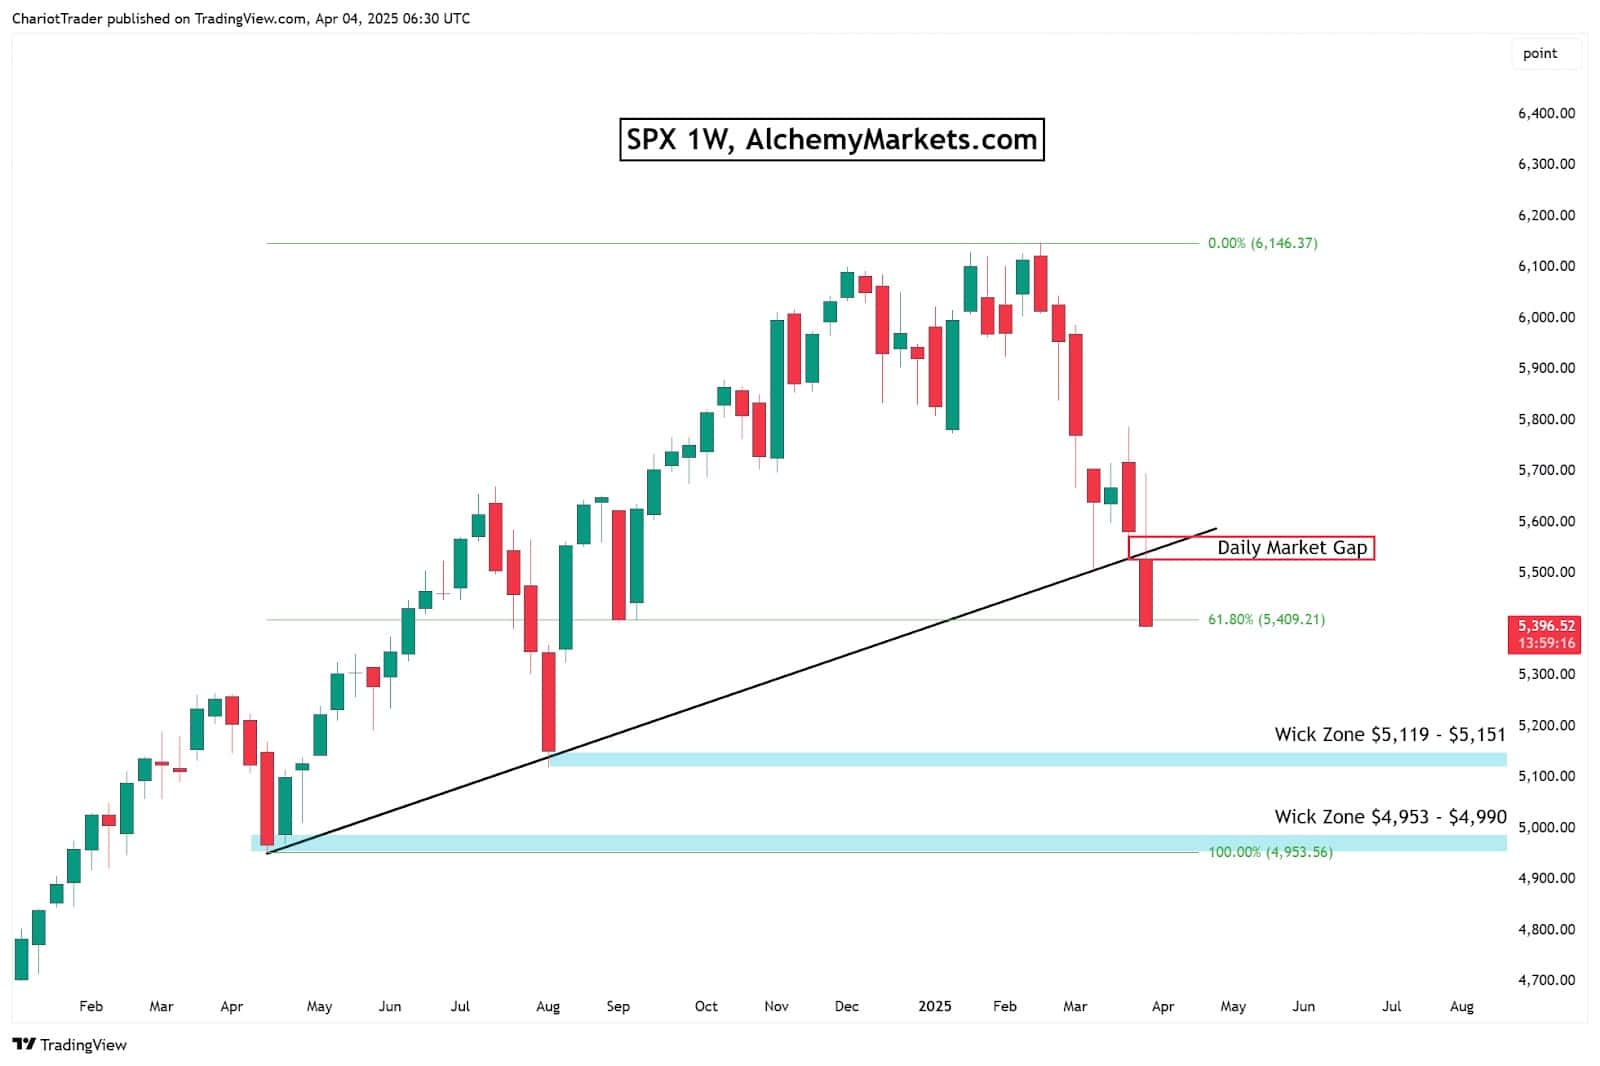
Key Levels to watch:
We're sitting at the bullish 61.8% Fibonacci retracement, but if the weekly candle closes below it, that’s a red flag. Even with a close above, the nearby market gap and trendline could act as strong resistance—so bullish traders should stay cautious.
You may also be interested in:
Shock Tariffs Spark Market Turbulence as Gold Rises, Dollar Sinks, and Stocks Slip
*Trading leveraged products carries a high level of risk and may result in losses exceeding your initial investment; ensure you fully understand the risks involved.
Alchemy Markets is a multi-asset brokerage providing retail traders with the same elite trading conditions, tools, and transparency typically reserved for institutions.
Select the categories and companies you wish to follow directly to your person rss feed.
Create Custom RSS FeedSign up and join over 5,000 professional members who receive personalized news alerts, curated professional connections, and more for free!
Sterling steadies after political uncertainty rattled gilt markets, while EUR/USD and EUR/GBP approach key technical levels ahead of today's European session.
GBP/AUD remains trapped in a well-defined bearish trend on both the weekly and daily timeframes.
Discover the key drivers, technical levels, and central bank expectations shaping the EUR/USD trend as the ECB prepares to hold rates and markets watch for a potential breakout.
Sydney-based multi-asset broker ACY Securities has introduced PAXGUSD, a new CFD instrument that allows clients to trade tokenised gold against the US Dollar 24 hours a day, seven days a week. The instrument is available across MetaTrader 4, MetaTrader 5, and the ACY Trading Platform.
Binance has lowered its VIP 3 Wallet Assets threshold from $3 million to $1 million and will now count OTC Spot Trading Volume at a 4x multiplier toward VIP qualification, removing the previous VIP 4 cap and allowing eligible users to progress through the full tier framework up to VIP 9.
Retail futures trading leader NinjaTrader Group has appointed Mark Omens as Senior Vice President, Commercial Strategy, bringing a 25-year veteran of derivatives marketplace CME Group into a newly created role focused on exchange partnerships and enterprise growth.
Gold Price Action Forecast: Will XAU/USD Drop to $3930? Meta Description: Read our Gold price action forecast to see if XAU/USD will drop to $3930.
BitDelta Securities Financial Services LLC (“BitDelta Securities”) today announced that it has received full regulatory approval from the Capital Market Authority (“CMA”) of the United Arab Emirates under the Category 5 — Arrangement and Advice license framework (License No. 20200000439). The approval follows the firm's receipt of In-Principal Approval earlier this year and represents the successful conclusion of the CMA's full licensing process, including the satisfaction of capital requirements, governance appointments, and operational setup.
Crypto.com has received a $400 million strategic investment from Citadel Securities, valuing the firm at $20 billion. It marks the first institutional funding round in the company's history, aimed at accelerating its expansion into tokenised securities, derivatives and other asset classes.
WTI’s pullback into $79–82 is the first major test of the bullish Elliott Wave count, with buyers targeting a renewed break above $85.


