just now

Liquidity Finder Ltd is incorporated in England and Wales, company number 10610740, registered address 167-169 Great Portland Street, Fifth Floor, London W1W 5PF, United Kingdom.
Published: just now
If you’ve ever found yourself staring at your charts, trying to understand why the market moved the way it did even when the data "looked good" you’re not alone. Every trader has hit that wall. It’s one of those moments where you realize there’s more to this game than just following economic releases or chasing price patterns.
The truth is, behind every big move in the market, there’s usually a deeper story. And often, that story is being written through a mix of soft data and hard data. If you’re not familiar with what those mean or even if your kind of is, but don’t really use them daily this piece is for you.
I want to break this down in a way that sticks. Because once you understand how to read both kinds of data and more importantly, when to pay attention to one over the other your view of the market starts to shift. It’s not just noise anymore. You start to see the rhythm behind the movement.
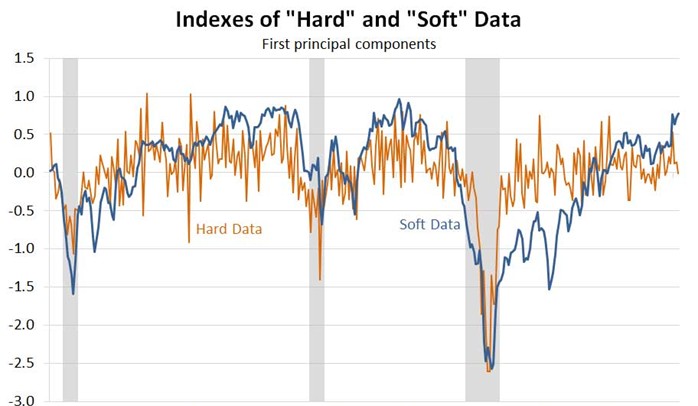
Hard data is what most traders are familiar with when they first get into macroeconomic analysis. It’s the “measurable stuff.” Numbers that come from actual activity. Think:
These are lagging or coincident indicators meaning, they reflect what has already happened (or what’s happening now), not what’s coming next. They are collected by government agencies or private institutions using real transactions, actual payroll numbers, sales receipts, etc.
They’re grounded and because of that, many investors consider hard data to be more “reliable.” You’ll hear a lot of institutional traders say things like “wait for confirmation in the hard data.”
But here’s the catch…
By the time hard data confirms a trend, it’s often too late for the best trade entry. The market is already pricing it in.
Soft data, on the other hand, is a lot more about how people feel their sentiment, their expectations, their outlook on what might happen in the future. It’s based on surveys and opinion-based indexes, such as:
These don’t measure actions they measure intentions. What businesses say they plan to do. What consumers think about their financial future.
Now you might be thinking, “Well, why should I care what people feel? Isn’t that too subjective?”
Not at all.
In fact, markets are driven by expectations long before the numbers confirm the reality. Soft data often acts as a leading indicator especially in transitions between economic cycles. You can’t forget that the context can change everything, and people are context…
Here’s the honest answer neither is better, and both are necessary.
Hard data gives you confirmation.
Soft data gives you anticipation.
If you’re a trader, you don’t want to live in the past. You want to catch the moves early. That’s where soft data can be a game changer.
But if you’re only trading based on sentiment, you might get caught on the wrong side of a false narrative. That’s why hard data is your grounding point. It tells you whether those expectations are coming to life.
Let me give you an example that’ll make this clearer.
Back in early 2023, inflation was still a hot topic. Central banks were trying to slow things down, and the market was hanging on every CPI print.
Around that time, soft data like consumer confidence and PMI surveys started to suggest that businesses and households were feeling squeezed. Surveys showed expectations of weaker growth ahead. The narrative became “inflation is cooling, recession is coming.”
And what did markets do? Yields dropped, stocks wobbled, and traders began pricing in rate cuts before any hard data confirmed it.
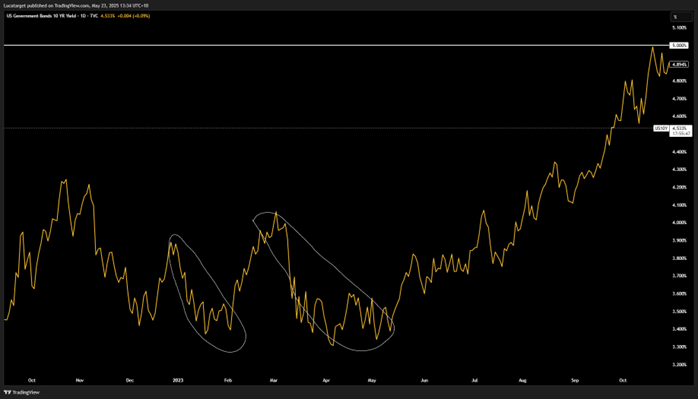
Then a few months later hard data like actual CPI and PCE inflation prints started catching up with what soft data had already hinted at. This confirmed the sentiment, and markets kept moving in the same direction.
But guess who caught the trade early? The ones watching the soft data.
Let’s be practical now. You’re likely not running a billion-dollar fund. But you’re watching the calendar, checking news, and trying to get an edge. So, here’s how you can make use of this stuff day to day.
Soft data moves first; hard data follows. When soft data starts changing direction especially after a strong trend that’s your early signal to dig deeper. Is sentiment shifting? Is the market about to pivot?
You can build trade ideas around these inflection points.
Sometimes, soft data and hard data disagree. That’s where the best trades can come from.
For example: If PMIs are falling but industrial production is still strong, you’re in a transition zone. The market might not be pricing in the weakness yet. That’s your window.
Soft data gives you context. If consumer confidence is plunging, retail sales may soon follow. If business optimism is rising, capex and hiring might pick up in the coming quarters.
That forward-looking edge matters, especially in FX and commodities where positioning moves fast.
The average retail trader barely looks beyond NFP or CPI. And when they do, they usually don’t know how to interpret what it means for market direction.
By understanding how soft and hard data relate, you’re stepping into the shoes of institutional thinkers. You’re thinking like a macro trader not just reacting to charts but anticipating what’s behind them.
And that gives you a massive edge.
Because this isn’t just about knowing what PMI stands for. It’s about understanding what the market is starting to believe and positioning ahead of the crowd.
Here’s something I remind myself constantly: Markets are emotional. But money follows structure.
Soft data is about emotion. Hard data is about structure. You need both.
When I wake up and check my calendar, I’m not just looking at what numbers will drop. I’m asking:
Sometimes the best trades are when everyone expects doom, but hard data says, “Not yet.” Or when everything looks stable but soft data shows that confidence is cracking underneath.
Read the sentiment. Watch the confirmation. Trade the shift.
This content may have been written by a third party. ACY makes no representation or warranty and assumes no liability as to the accuracy or completeness of the information provided, nor any loss arising from any investment based on a recommendation, forecast or other information supplies by any third-party. This content is information only, and does not constitute financial, investment or other advice on which you can rely.
ACY Securities is one of Australia's fastest growing multi-asset online trading providers, offering ultra-low-cost trading, rock-solid execution, technologically superior account management and premium market analysis.
Select the categories and companies you wish to follow directly to your person rss feed.
Create Custom RSS FeedSign up and join over 5,000 professional members who receive personalized news alerts, curated professional connections, and more for free!
cBridge, by Spotware, has launched Markout Report, a risk intelligence module that lets brokers detect toxic flow, rank accounts by financial impact and act before losses accumulate, all within the bridge.
Sterling steadies after political uncertainty rattled gilt markets, while EUR/USD and EUR/GBP approach key technical levels ahead of today's European session.
GBP/AUD remains trapped in a well-defined bearish trend on both the weekly and daily timeframes.
Discover the key drivers, technical levels, and central bank expectations shaping the EUR/USD trend as the ECB prepares to hold rates and markets watch for a potential breakout.
Sydney-based multi-asset broker ACY Securities has introduced PAXGUSD, a new CFD instrument that allows clients to trade tokenised gold against the US Dollar 24 hours a day, seven days a week. The instrument is available across MetaTrader 4, MetaTrader 5, and the ACY Trading Platform.
Binance has lowered its VIP 3 Wallet Assets threshold from $3 million to $1 million and will now count OTC Spot Trading Volume at a 4x multiplier toward VIP qualification, removing the previous VIP 4 cap and allowing eligible users to progress through the full tier framework up to VIP 9.
Retail futures trading leader NinjaTrader Group has appointed Mark Omens as Senior Vice President, Commercial Strategy, bringing a 25-year veteran of derivatives marketplace CME Group into a newly created role focused on exchange partnerships and enterprise growth.
Gold Price Action Forecast: Will XAU/USD Drop to $3930? Meta Description: Read our Gold price action forecast to see if XAU/USD will drop to $3930.
BitDelta Securities Financial Services LLC (“BitDelta Securities”) today announced that it has received full regulatory approval from the Capital Market Authority (“CMA”) of the United Arab Emirates under the Category 5 — Arrangement and Advice license framework (License No. 20200000439). The approval follows the firm's receipt of In-Principal Approval earlier this year and represents the successful conclusion of the CMA's full licensing process, including the satisfaction of capital requirements, governance appointments, and operational setup.
Crypto.com has received a $400 million strategic investment from Citadel Securities, valuing the firm at $20 billion. It marks the first institutional funding round in the company's history, aimed at accelerating its expansion into tokenised securities, derivatives and other asset classes.