just now

Liquidity Finder Ltd is incorporated in England and Wales, company number 10610740, registered address 167-169 Great Portland Street, Fifth Floor, London W1W 5PF, United Kingdom.
Published: just now


“Momentum doesn’t just fade, it resets. And when it resets near the right price levels, that’s your signal to strike.”
To help you understand what Stochastics actually shows, how to use it correctly in trending markets, and how to combine it with price action across multiple timeframes to identify trade-worthy setups.
The Stochastic Oscillator is a momentum indicator but not one that predicts or forecasts direction.
“How strong is the current move compared to the recent highs and lows?”
It looks at where price is closing relative to its recent high-low range over a set number of periods (usually 14).
It gives you two lines:
This is the main line-it measures the current closing price in relation to the recent high-low range.
Analogy: %K is like the actual speed your car is going right now, updated second by second.
This is a moving average of the %K line, usually a 3-period simple moving average of %K.
Analogy: %D is like the average speed over the last few seconds. It doesn’t change as fast, but helps you spot direction and turning points more clearly.
In Practice:
But remember, in trending markets, you don’t use these blindly. You wait for confirmation from price action.

He explodes off the starting line - legs pumping, speed building, the crowd on their feet.
That’s %K-the fast line in the Stochastic Oscillator - raw, real-time momentum.
But off to the side, his coach is watching carefully with a stopwatch.
He isn’t just watching the burst… he’s measuring pacing over time, noting when fatigue creeps in, or when it’s time for a final push.
That’s %D - the smoothed signal line.
This is how the Stochastic Oscillator works in your trading.
%K shows the immediate pace. %D tracks the overall shift.
And when they cross or diverge-momentum is likely shifting. That’s when smart traders lean in.
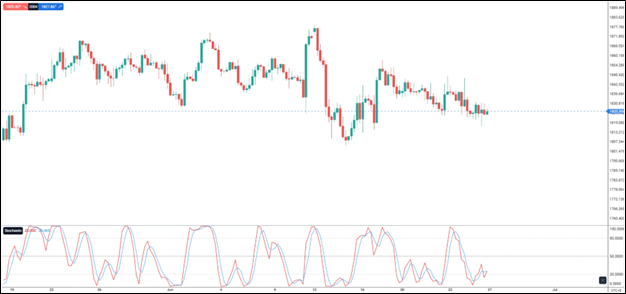
George Lane created Stochastics to help spot reversals inside ranges:
But that logic breaks down in strong trends.
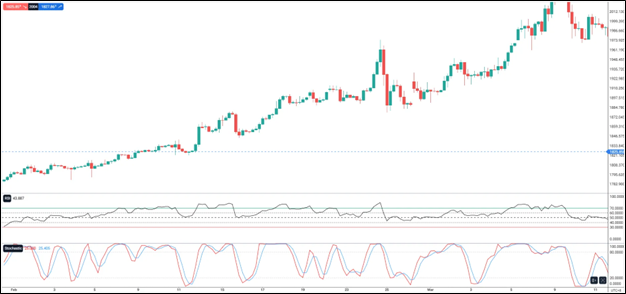
| Indicator | Stochastics | RSI |
| Measures | Close vs high-low range | Avg gains vs avg losses |
| Sensitivity | Faster, better for short-term momentum | Smoother, better for divergence |
| Use in Trends | Pullback timing tool | Reversal exhaustion + divergence |
| Best Combo | With price zones + lower-timeframe entry + pullback levels | With divergence and trend strength confirmation + trend riding tool |
Simple Summary:
When to Use Each:
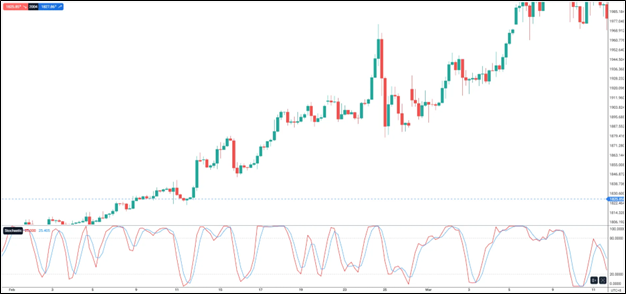
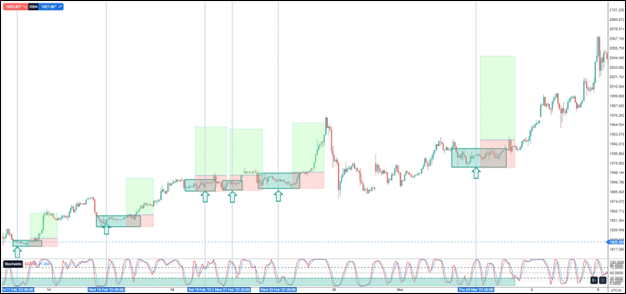
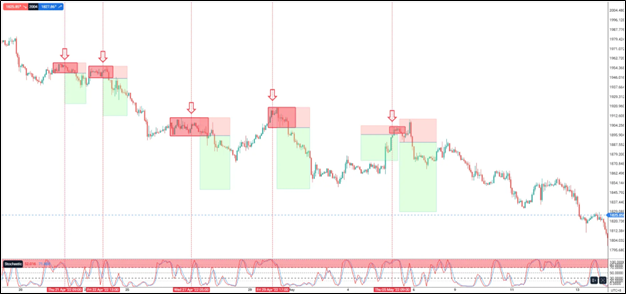
How to Use Stochastics in a Trending Market
Use Stochastics not as a reversal tool, but as a pullback timer.
Trade Management:
Stop Loss: Beyond the Range
Take Profit: 2x - 3x
Aiming for 2R-3R (risk-to-reward ratio) is generally smart when using Stochastics-based setups as we are also applying the rubber-band effect in trading Stochasatics.
Check also these contents:
How to Trade Breakouts Effectively in Day Trading with Smart Money Concepts
Mastering Risk Management: Stop Loss, Take Profit, and Position Sizing
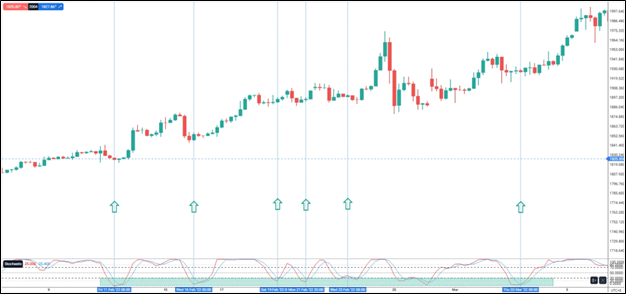
Multi-Timeframe Setup (Stoch + Price Action)
Here’s your full blueprint:
For other combinations, check this out: The Power of Multi-Timeframe Analysis in Smart Money Concepts (SMC)

Stochastics gives you the “when.”
Price action gives you the “where” and “how.”
Using Stochastics without price confirmation is like seeing your car slow down and hitting the gas without checking the road ahead.
The Winning Formula:
Stochastics + Price Action Confirmation = Trade Opportunity
So before you enter based on momentum alone, make sure price tells the same story. Wait for the key Stochastics zones for pullbacks and rebounds. Look for precision at the Lower Timeframes. Wait for a break. Let price confirm you the trade not just the indicator.
Strategies That You Can Use:
How To Trade & Scalp Indices at the Open Using Smart Money Concepts (SMC)
How to Trade Breakouts Effectively in Day Trading with Smart Money Concepts
Complete Step-by-Step Guide to Day Trading Gold (XAU/USD) with Smart Money Concepts (SMC)
The Power of Multi-Timeframe Analysis in Smart Money Concepts (SMC)
Forex Trading Strategy for Beginners
The Ultimate Guide to Understanding Market Trends and Price Action
Mastering Candlestick Pattern Analysis with the SMC Strategy for Day Trading
Mastering Risk Management: Stop Loss, Take Profit, and Position Sizing
How To Trade News:
Why Smart Money Concepts Work in News-Driven Markets - CPI, NFP, and More
How to Trade NFP Using Smart Money Concepts (SMC)-A Proven Strategy for Forex Traders
How to Trade CPI Like Smart Money - A Step-by-Step Guide Using SMC
Learn How to Trade US Indices:
How to Start Trading Indices and Get into the Stock Market with Low Capital (2025 Guide)
Best Indices to Trade for Day Traders | NASDAQ, S&P 500, DAX + Best Times to Trade Them
How To Trade & Scalp Indices at the Open Using Smart Money Concepts (SMC)
NAS100 - How to Trade the Nasdaq Like a Pro (Smart Money Edition)
How to Trade CPI Like Smart Money - A Step-by-Step Guide Using SMC
Why Smart Money Concepts Work in News-Driven Markets - CPI, NFP, and More
How to Start Trading Gold:
How to Swing Trade Gold (XAU/USD) Using Smart Money Concepts: A Simple Guide for Traders
Complete Step-by-Step Guide to Day Trading Gold (XAU/USD) with Smart Money Concepts (SMC)
The Ultimate Guide to Backtesting and Trading Gold (XAU/USD) Using Smart Money Concepts (SMC)
Why Gold Remains the Ultimate Security in a Shifting World
How to Start Day Trading:
5 Steps to Start Day Trading: A Strategic Guide for Beginners
8 Steps How to Start Forex Day Trading in 2025: A Beginner’s Step-by-Step Guide
3 Steps to Build a Trading Routine for Consistency and Discipline - Day Trading Edition
Learn how to navigate yourself in times of turmoil:
How to Identify Risk-On and Risk-Off Market Sentiment: A Complete Trader’s Guide
How to Trade Risk-On and Risk-Off Sentiment - With Technical Confirmation
The Ultimate Guide to Understanding Market Trends and Price Action
Want to learn how to trade like the Smart Money?
Mastering the Market with Smart Money Concepts: 5 Strategic Approaches
Mastering Candlestick Pattern Analysis with the SMC Strategy for Day Trading
Understanding Liquidity Sweep: How Smart Money Trades Liquidity Zones in Forex, Gold, US Indices
The SMC Playbook Series Part 4: How to Confirm Trend Reversal & Direction using SMC
The SMC Playbook Series Part 5: The Power of Multi-Timeframe Analysis in Smart Money Concepts (SMC)
Fair Value Gaps Explained: How Smart Money Leaves Footprints in the Market
Trading Psychology and Continuous Improvement Contents:
The Mental Game of Execution - Debunking the Common Trading Psychology
5 Steps to Backtest a Trading Strategy with AI: A Step-by-Step Guide
Managing Trading Losses: Why You Can Be Wrong and Still Win Big in Trading
The Hidden Threat in Trading: How Performance Anxiety Sabotages Your Edge
Why You Fail in Trading: You Don’t Have Enough Capital to Survive
Why 90% of Retail Traders Fail Even with Profitable Trading Strategies
Follow me for more daily market insights!
Jasper Osita - LinkedIn - FXStreet - YouTube
This content may have been written by a third party. ACY makes no representation or warranty and assumes no liability as to the accuracy or completeness of the information provided, nor any loss arising from any investment based on a recommendation, forecast or other information supplies by any third-party. This content is information only, and does not constitute financial, investment or other advice on which you can rely.
ACY Securities is one of Australia's fastest growing multi-asset online trading providers, offering ultra-low-cost trading, rock-solid execution, technologically superior account management and premium market analysis.
Select the categories and companies you wish to follow directly to your person rss feed.
Create Custom RSS FeedSign up and join over 5,000 professional members who receive personalized news alerts, curated professional connections, and more for free!
Retail futures trading leader NinjaTrader Group has appointed Mark Omens as Senior Vice President, Commercial Strategy, bringing a 25-year veteran of derivatives marketplace CME Group into a newly created role focused on exchange partnerships and enterprise growth.
Gold Price Action Forecast: Will XAU/USD Drop to $3930? Meta Description: Read our Gold price action forecast to see if XAU/USD will drop to $3930.
BitDelta Securities Financial Services LLC (“BitDelta Securities”) today announced that it has received full regulatory approval from the Capital Market Authority (“CMA”) of the United Arab Emirates under the Category 5 — Arrangement and Advice license framework (License No. 20200000439). The approval follows the firm's receipt of In-Principal Approval earlier this year and represents the successful conclusion of the CMA's full licensing process, including the satisfaction of capital requirements, governance appointments, and operational setup.
Crypto.com has received a $400 million strategic investment from Citadel Securities, valuing the firm at $20 billion. It marks the first institutional funding round in the company's history, aimed at accelerating its expansion into tokenised securities, derivatives and other asset classes.
WTI’s pullback into $79–82 is the first major test of the bullish Elliott Wave count, with buyers targeting a renewed break above $85.

BitDelta Securities has secured a full CMA Category 5 licence in the UAE and opened a regulated office in Business Bay, Dubai. The firm operates as an introducing broker, connecting investors with licensed international brokers across multiple asset classes, with CEO Dr. Demetrios Zamboglou commenting on the milestone.
Index volatility is asleep while single stocks fight it out underneath, credit refuses to confirm the equity rally, and a bare macro calendar hands next week to oil.
Digital assets and FX brokerage GC Exchange FZE (GCEX) has appointed Mohammed A. Mulla as a Board Member of its Dubai-based entity, part of the wider GCEX Group.
Learn what Blockchain-as-a-Service is, how it works, and why businesses are using BaaS to build blockchain applications without managing infrastructure.
CFDs vs stocks compared on leverage, ownership, costs, dividends, taxes, and risk. Learn the differences between stocks and CFDs and discover which suits your investing or trading goals.


