just now


Liquidity Finder Ltd is incorporated in England and Wales, company number 10610740, registered address 167-169 Great Portland Street, Fifth Floor, London W1W 5PF, United Kingdom.
Published: just now

If you’ve ever been stopped out of a trade just before price reverses in your original direction, you’ve likely experienced a stop hunt. It’s one of the most frustrating feelings for traders - but for institutions, it’s a necessary part of how markets move. To trade like smart money, you need to understand how swing highs and swing lows act as liquidity magnets and why they are prime hunting grounds.
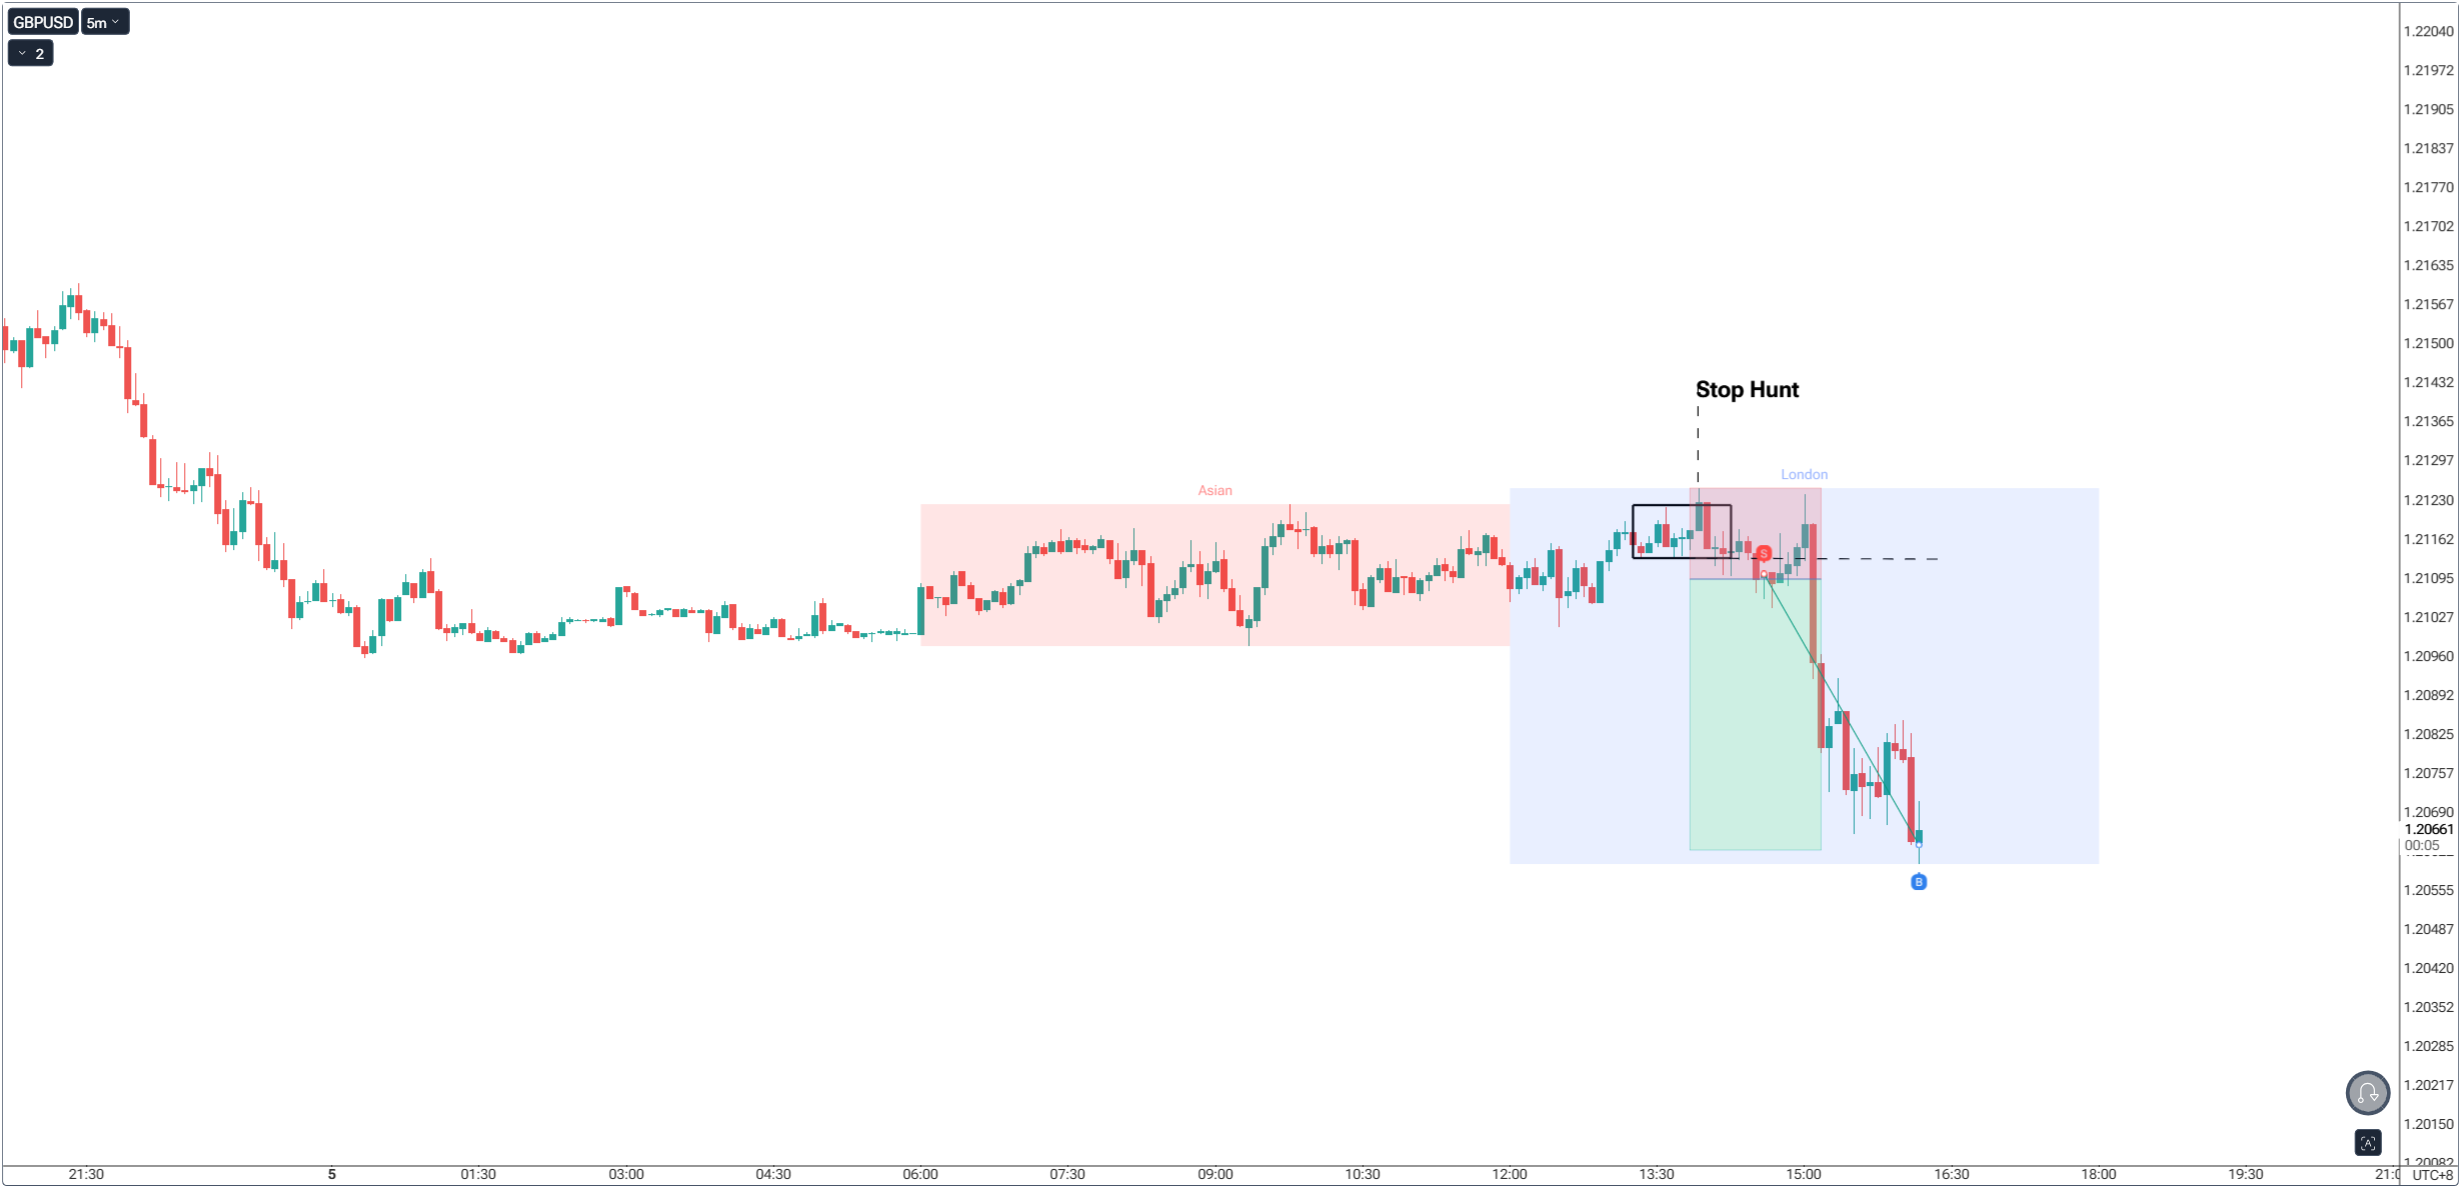
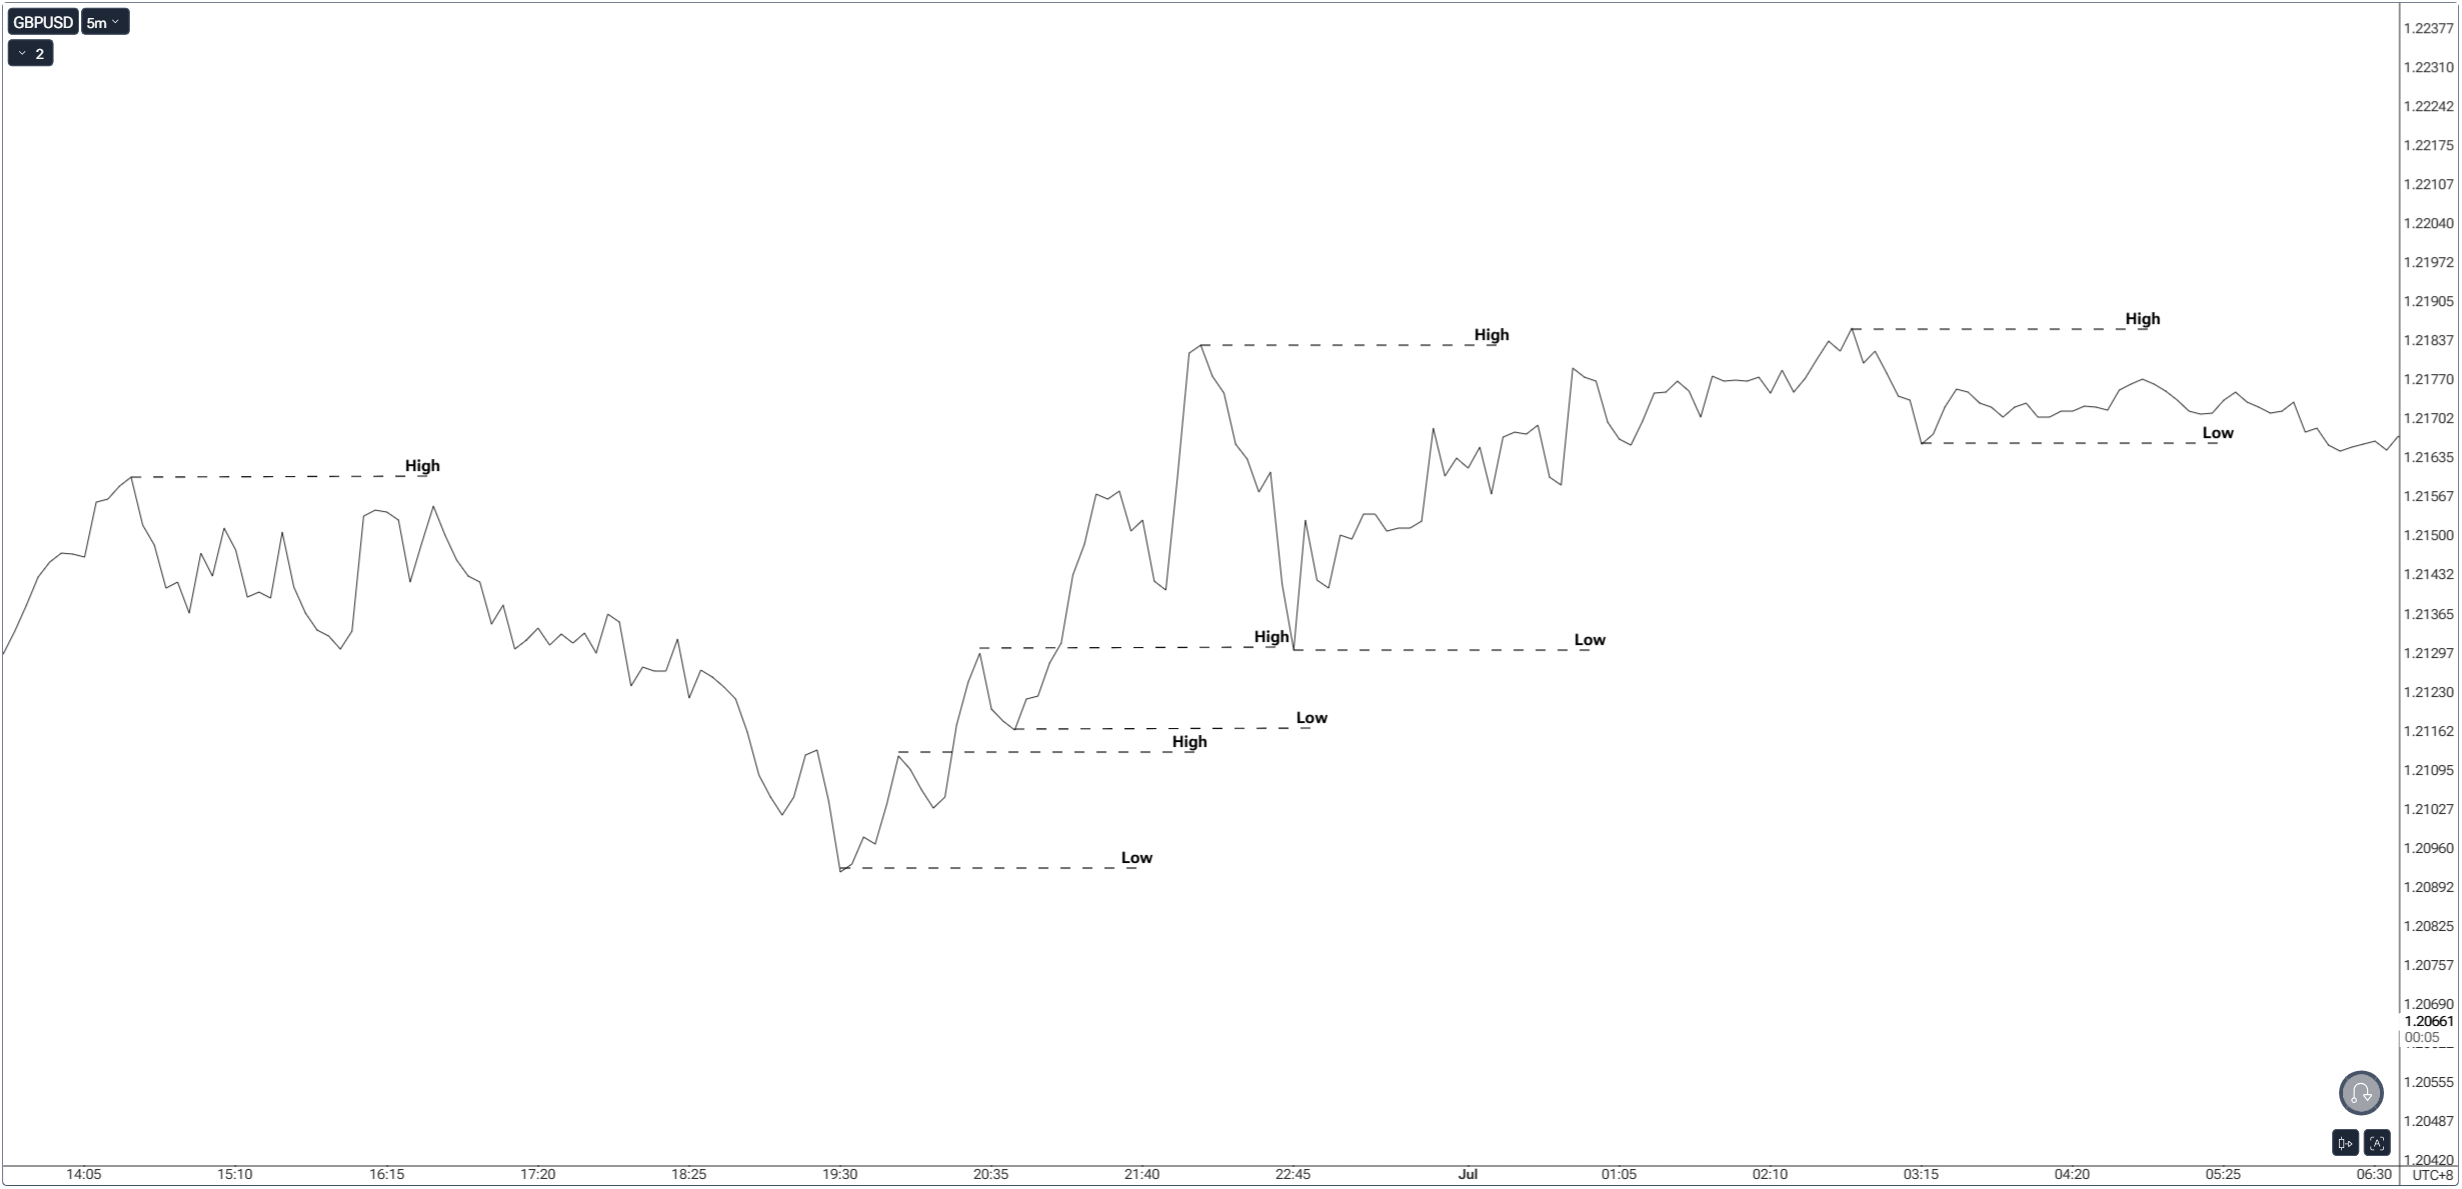
Swing highs and swing lows aren’t random - they’re the natural footprints of buyers and sellers competing for control.
In simple terms, swings represent the turning points of momentum. They’re where one side (buyers or sellers) temporarily wins, but the other side quickly fights back.
These turning points catch traders’ attention:
That’s why swings are so important - not just as structure markers, but as maps showing where money is parked in the market.

Imagine standing on the beach watching waves crash and retreat.
Just like the ocean, the market never moves in a straight line. It ebbs and flows, creating peaks and troughs that reveal where pressure builds and releases. Surfers wait for the best moment to ride the wave - not at the noisy crest where everyone’s crowded, but just after it breaks, when the true momentum carries them.
Institutions think the same way: they wait for traders to pile stops above the crest (swing high) or below the trough (swing low), then ride the momentum once liquidity is taken.

Markets move in swings - upswings and downswings. At the edges of these swings, traders naturally place their stops:
These areas are like signposts showing where money is sitting. Institutions know that clustered stop losses = ready-made liquidity. That’s why price often spikes just beyond a recent swing high or low before reversing in the opposite direction.

A stop hunt is not the market “out to get you.” It’s the market doing what it must: collecting orders. Large players can’t enter positions in thin liquidity - they need volume, and swing points provide exactly that.
Think of it like a whale feeding. The whale doesn’t waste time chasing single fish. Instead, it drives a school of fish into a corner and then takes one big gulp. The “gulp” in the market is the sweep of swing highs or swing lows.

Stop hunts often happen at key times:
The easiest way to anticipate stop hunts is to mark the most obvious swings:
Each of these levels is simply a swing high or swing low on a larger timeframe.
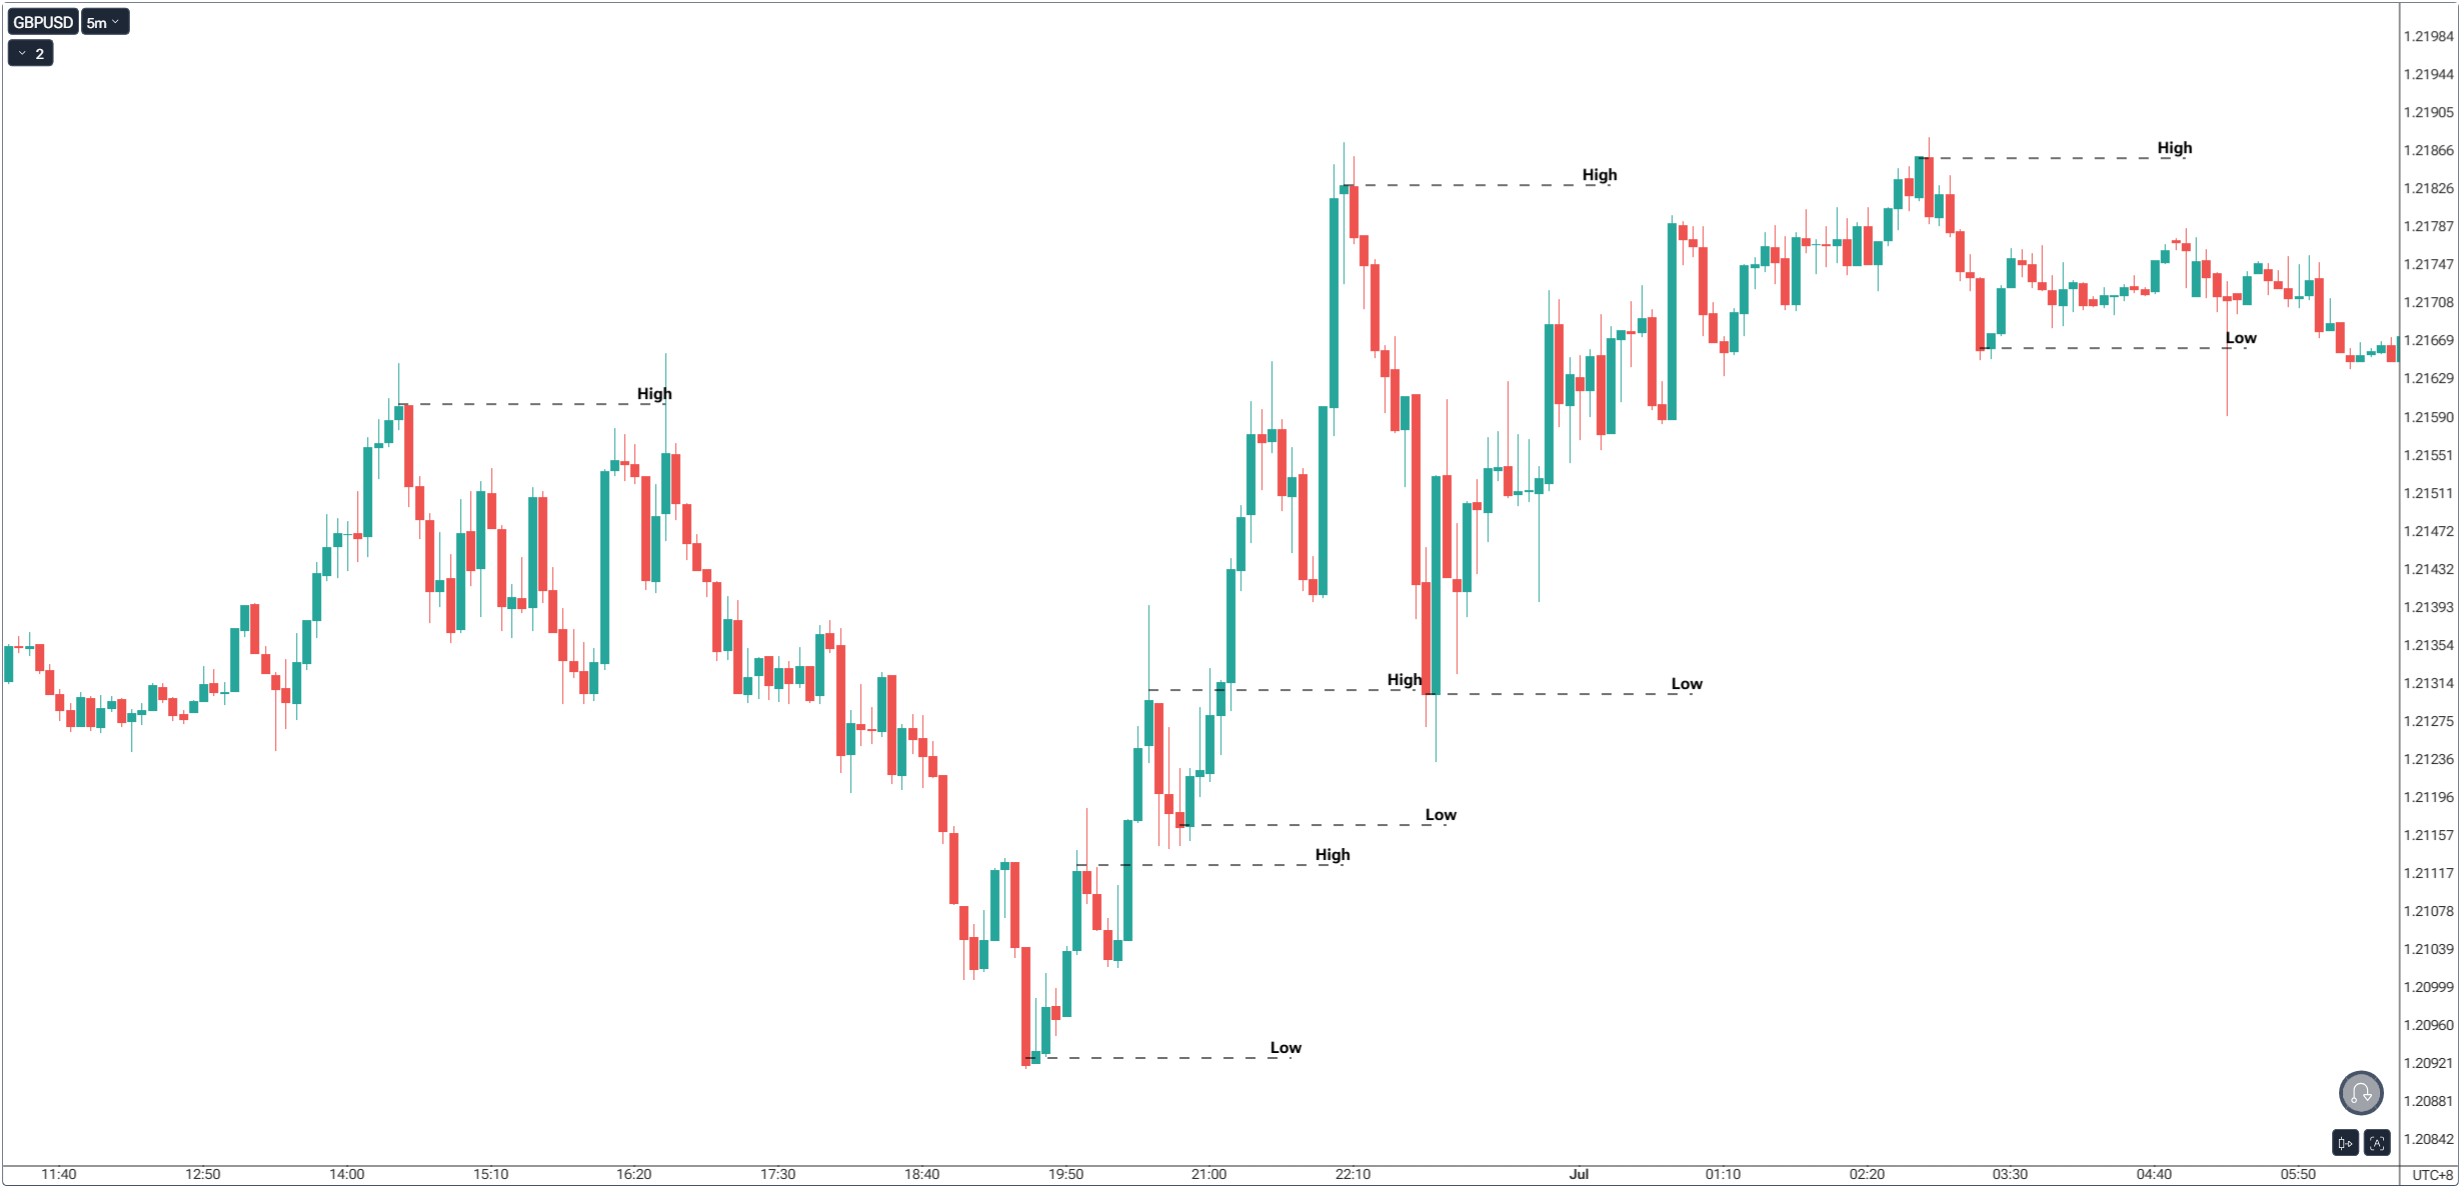
To avoid mistaking a stop hunt for a breakout, look for:
Instead of being the liquidity, wait for liquidity to be taken:
This way, you move from being the hunted to trading with the hunters.

Stop hunts succeed because retail traders:
By reframing swings as liquidity magnets, you can avoid being tricked into becoming part of the herd.

Think of a hunter tracking a deer. The hunter doesn’t charge straight at the deer from the front - that would scare it off instantly. Instead, the hunter circles, makes subtle movements, and sometimes even makes noise in one direction to lure the deer into exposing itself.
In the markets, the sweep of a swing high or low works the same way. Institutions engineer a false sense of direction, drawing retail traders in. Once the “deer” (liquidity) is flushed out of hiding, the real move begins in the opposite direction. Just as a skilled hunter knows where the deer will likely run, institutions know where liquidity sits - and they wait patiently to take it.
It’s important to remember that just because price takes a swing high or swing low, it doesn’t automatically mean the market will reverse. Many traders make the mistake of assuming “swing swept = reversal” and end up fading strong trends.
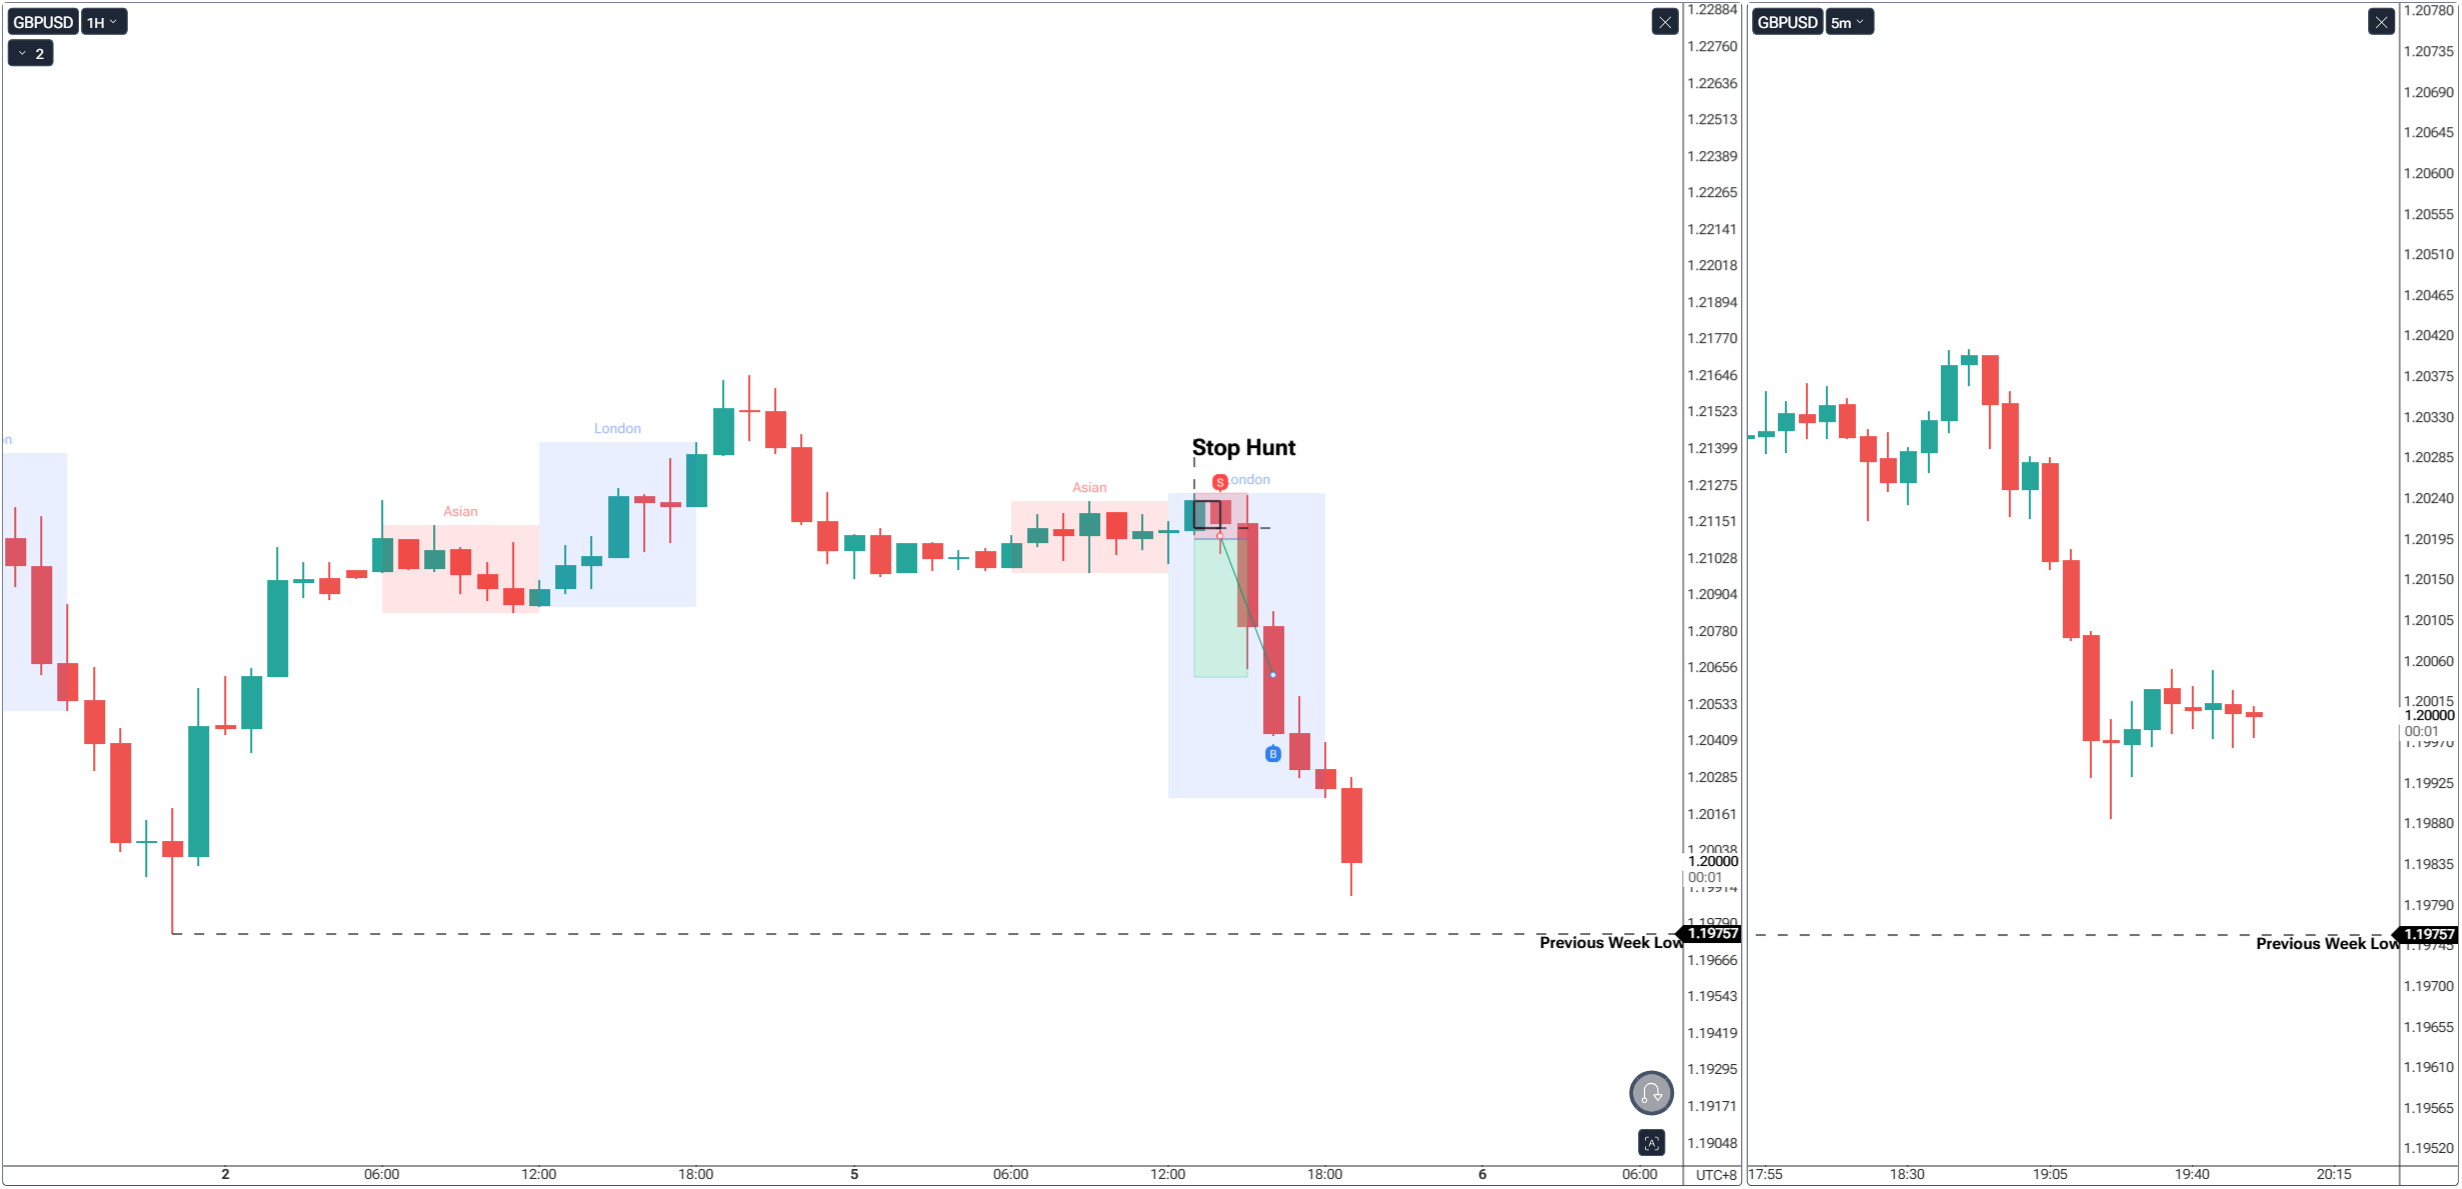
Here’s the reality:
This is why confirmation is everything. Before you jump in, wait for:
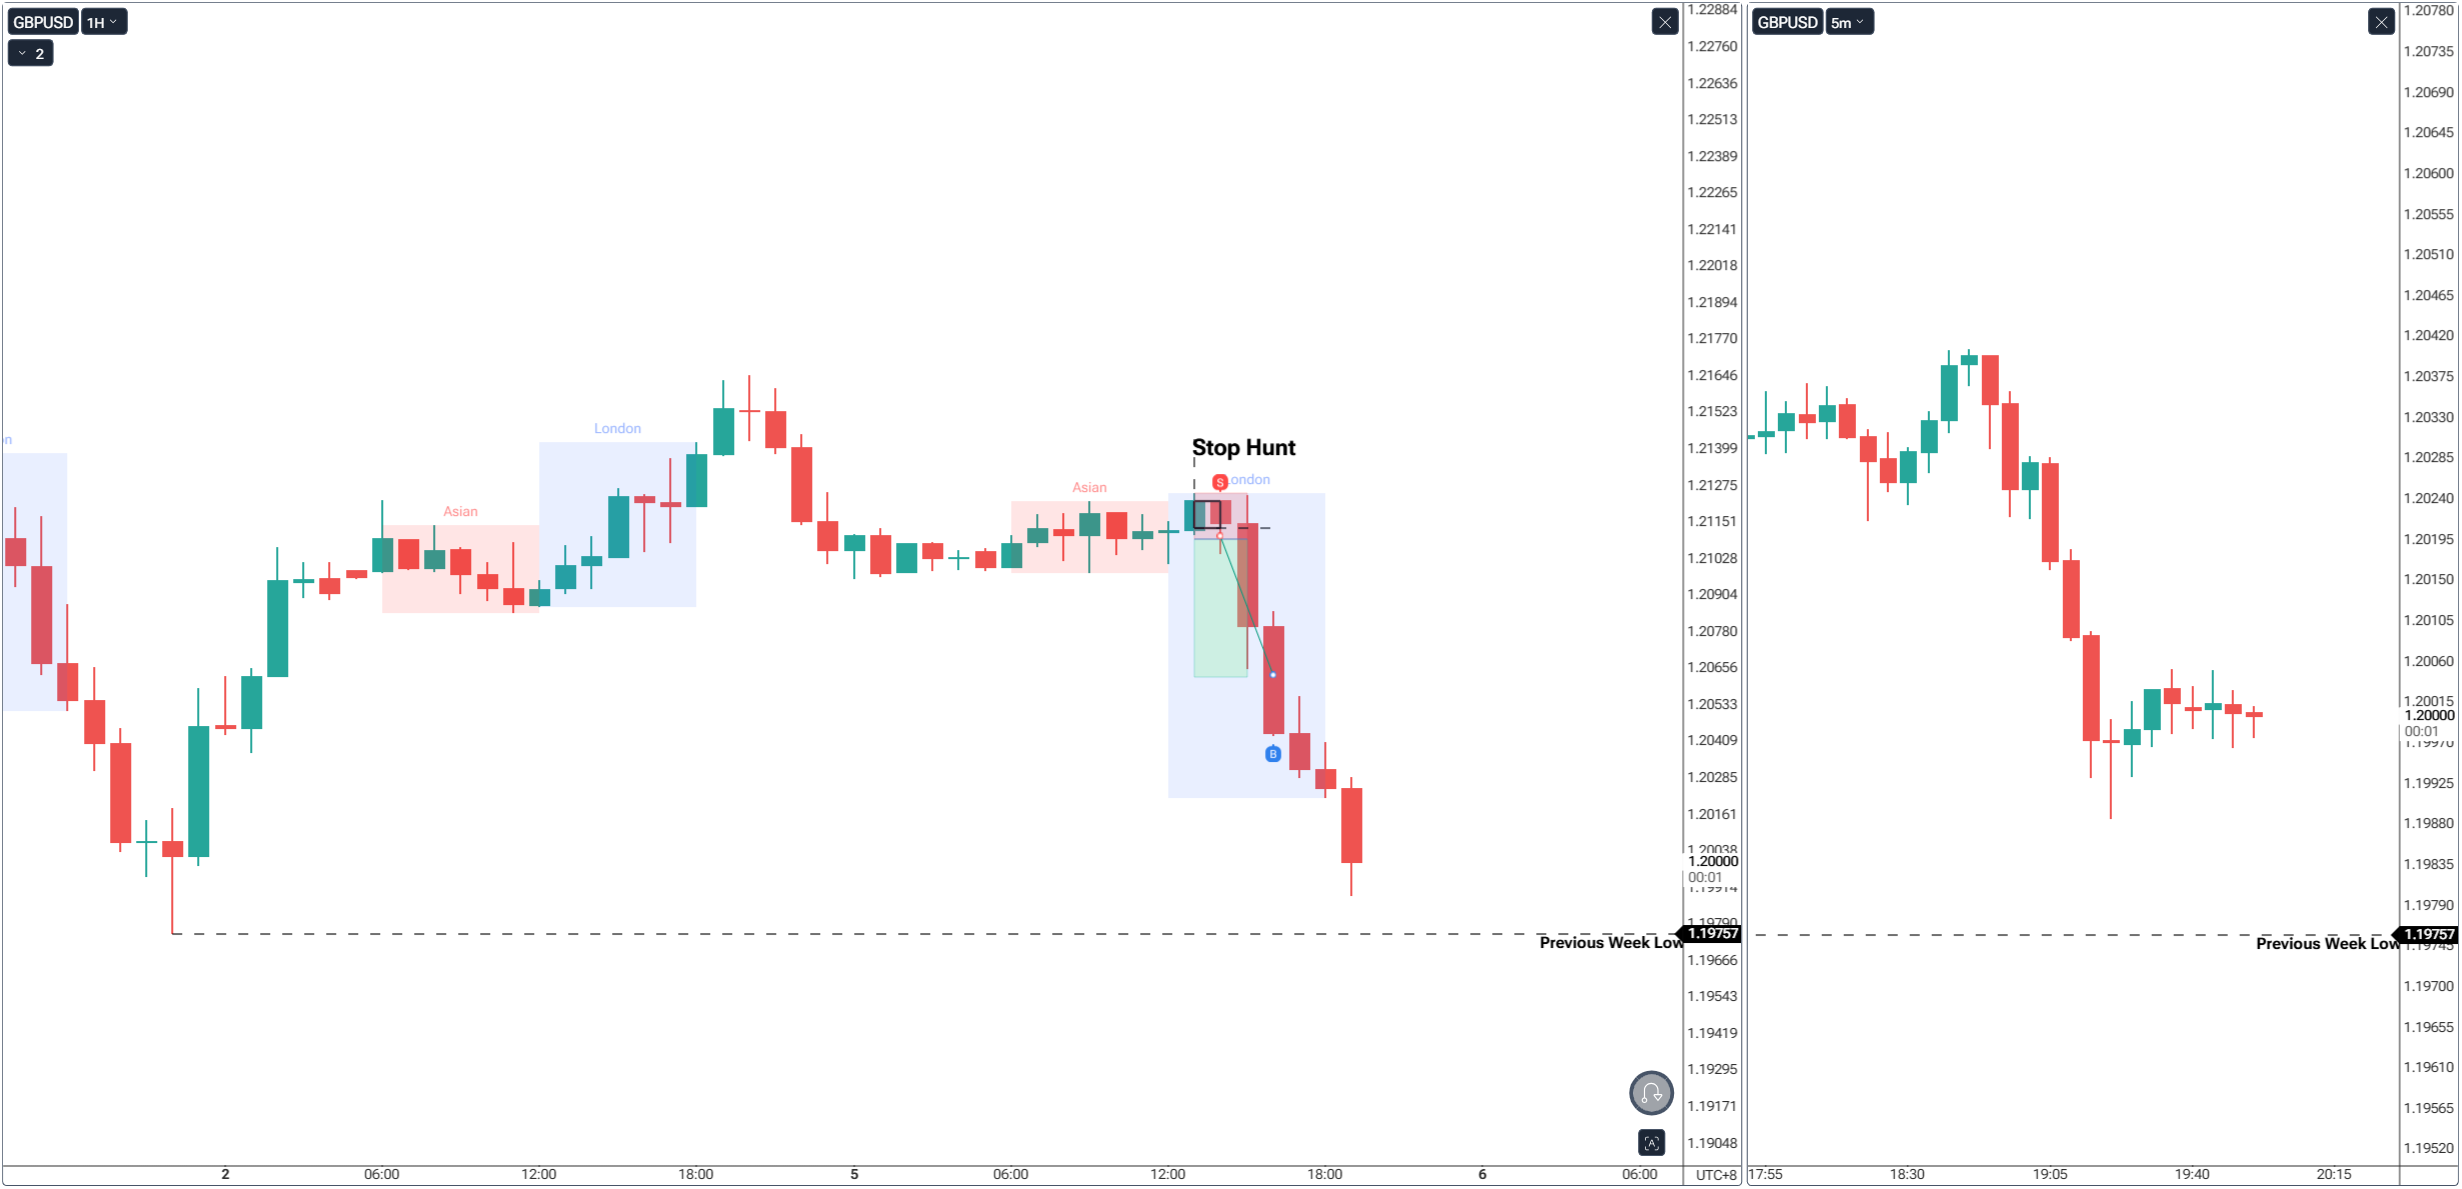
Swing highs and lows are liquidity markers, not trading signals on their own. Treat them as clues in the story - then let confirmation write the ending.
Mark yesterday’s swing high and swing low, plus the Asian session high and low. Watch how often price spikes these levels before reversing. Journal three examples this week, and you’ll start to see the stop hunt → reversal → real move sequence unfold in real time.
Open a free demo account today and experience institutional-grade spreads, lightning-fast execution, and all the tools you need to grow as a trader.
It’s time to go from theory to execution - risk-free.
Create an Account. Start Your Free Demo!
How To Trade & Scalp Indices at the Open Using Smart Money Concepts (SMC)
How to Trade Breakouts Effectively in Day Trading with Smart Money Concepts
Complete Step-by-Step Guide to Day Trading Gold (XAU/USD) with Smart Money Concepts (SMC)
The Power of Multi-Timeframe Analysis in Smart Money Concepts (SMC)
Forex Trading Strategy for Beginners
Mastering Candlestick Pattern Analysis with the SMC Strategy for Day Trading
Mastering Risk Management: Stop Loss, Take Profit, and Position Sizing
How to Use Fibonacci to Set Targets & Stops (Complete Guide)
RSI Divergence Trading Strategy for Gold: How to Identify and Trade Trend Reversals
Stochastics Trading Secrets: How to Time Entries in Trending Markets using Stochastics
Gold Trading Stochastics Strategy: How to Trade Gold with 2R–3R Targets
RSI Hidden Divergence Explained: How to Spot Trend Continuations Like a Pro
The Ultimate Guide to Risk Management in Trading - A Complete Compilation for 2025
Moving Averages Trading Strategy Playbook
How to Think Like a Price Action Trader
Mastering Fibonacci Trading Psychology - Trusting the Levels, Managing the Mind
Why Smart Money Concepts Work in News-Driven Markets - CPI, NFP, and More
How to Trade NFP Using Smart Money Concepts (SMC)-A Proven Strategy for Forex Traders
How to Trade CPI Like Smart Money - A Step-by-Step Guide Using SMC
How to Start Trading Indices and Get into the Stock Market with Low Capital (2025 Guide)
Best Indices to Trade for Day Traders | NASDAQ, S&P 500, DAX + Best Times to Trade Them
How To Trade & Scalp Indices at the Open Using Smart Money Concepts (SMC)
NAS100 - How to Trade the Nasdaq Like a Pro (Smart Money Edition)
How to Trade CPI Like Smart Money - A Step-by-Step Guide Using SMC
Why Smart Money Concepts Work in News-Driven Markets - CPI, NFP, and More
How to Swing Trade Gold (XAU/USD) Using Smart Money Concepts: A Simple Guide for Traders
Complete Step-by-Step Guide to Day Trading Gold (XAU/USD) with Smart Money Concepts (SMC)
The Ultimate Guide to Backtesting and Trading Gold (XAU/USD) Using Smart Money Concepts (SMC)
Why Gold Remains the Ultimate Security in a Shifting World
How to Trade Candlestick Patterns with High Probability: A Complete Guide for Beginners
The Top Japanese Candlestick Guide: What is an Engulfing Pattern and How to Trade It?
Piercing Pattern Candlestick Explained: How to Trade It - Step-By-Step Guide
Morning & Evening Star Candlestick Patterns - How to Trade Market Reversals with Confidence
5 Steps to Start Day Trading: A Strategic Guide for Beginners
8 Steps How to Start Forex Day Trading in 2025: A Beginner’s Step-by-Step Guide
3 Steps to Build a Trading Routine for Consistency and Discipline - Day Trading Edition
The Ultimate Guide to Understanding Market Trends and Price Action
Trading with Momentum: The Best Trading Session to Trade Forex, Gold and Indices
How to Identify Risk-On and Risk-Off Market Sentiment: A Complete Trader’s Guide
How to Trade Risk-On and Risk-Off Sentiment - With Technical Confirmation
The Ultimate Guide to Understanding Market Trends and Price Action
Why Smart Money Concepts Work: The Truth Behind Liquidity and Price Action
Mastering the Market with Smart Money Concepts: 5 Strategic Approaches
Mastering Candlestick Pattern Analysis with the SMC Strategy for Day Trading
Understanding Liquidity Sweep: How Smart Money Trades Liquidity Zones in Forex, Gold, US Indices
The SMC Playbook Series Part 4: How to Confirm Trend Reversal & Direction using SMC
The SMC Playbook Series Part 5: The Power of Multi-Timeframe Analysis in Smart Money Concepts (SMC)
Fair Value Gaps Explained: How Smart Money Leaves Footprints in the Market
The Best Time to Use Smart Money Concepts (SMC): Why Timing Is Everything in Trading SMC
How to Trade the London Session Using Smart Money Concepts (SMC)
The Mental Game of Execution - Debunking the Common Trading Psychology
5 Steps to Backtest a Trading Strategy with AI: A Step-by-Step Guide
Managing Trading Losses: Why You Can Be Wrong and Still Win Big in Trading
The Hidden Threat in Trading: How Performance Anxiety Sabotages Your Edge
Why You Fail in Trading: You Don’t Have Enough Capital to Survive
Why 90% of Retail Traders Fail Even with Profitable Trading Strategies
The Top 10 Best Trading Books That Changed My Mindset, Strategy & Performance
Discovering Your Trader Profile: What Kind of Trader Are You?
Follow me for more daily market insights!
Jasper Osita - LinkedIn - FXStreet - YouTube
This content may have been written by a third party. ACY makes no representation or warranty and assumes no liability as to the accuracy or completeness of the information provided, nor any loss arising from any investment based on a recommendation, forecast or other information supplies by any third-party. This content is information only, and does not constitute financial, investment or other advice on which you can rely.
ACY Securities is one of Australia's fastest growing multi-asset online trading providers, offering ultra-low-cost trading, rock-solid execution, technologically superior account management and premium market analysis.

Select the categories and companies you wish to follow directly to your person rss feed.
Create Custom RSS FeedSign up and join over 5,000 professional members who receive personalized news alerts, curated professional connections, and more for free!
Bybit has launched Perp Options, described as the first options contracts built on TradFi perpetuals, giving traders round-the-clock access to US equity options. SpaceX and Nvidia are the first underlying assets, with USDT settlement and integration into Bybit's Unified Trading Account.
Use this trading preparation checklist to plan your session, define entry rules, manage risk, and build a disciplined trading routine in seven steps.
Your Bourse expands its crypto liquidity ecosystem with Caladan, giving brokers access to broader market coverage, institutional execution capacity and streamlined settlement.
Scope Markets, the retail brokerage part of Rostro Group, has appointed Ibrahim Hossny as Head of Research and Marketing for the Middle East and North Africa.
Hantec Prime, the institutional division of Hantec Markets, has reported trading volume up more than 300% year-to-date, alongside the addition of 42 new institutional clients since December, capping one of its strongest years of growth to date.
Learn how to refine XAUUSD support and resistance on the daily chart using candle bodies, market structure and weekly gold levels for swing trading. A slug alone cannot guarantee a top Google ranking. Keep it focused rather than adding every supporting keyword.
The week in Dubai will be focused on connecting directly with the industry and discussing how technology can help modern brokerages simplify operations, automate workflows, strengthen operational control, and scale efficiently.
Devexperts has launched a turnkey solution giving brokers in South Korea access to US equity markets, combining its DXtrade trading platform, dxFeed market data, and execution services. The offering targets South Korea's growing retail demand for US stocks, worth several billion USD monthly.
Assess why WTI crude oil surged past $105 per barrel amid Saudi pipeline disruptions, record tanker charter rates, and escalating geopolitical tensions.
Bitcoin price forecast: BTC/USD retests $78,460–$80,215 resistance. Watch bearish confirmation toward $72,480 or a bullish breakout toward $86,150.