just now

Liquidity Finder Ltd is incorporated in England and Wales, company number 10610740, registered address 167-169 Great Portland Street, Fifth Floor, London W1W 5PF, United Kingdom.
Published: just now


Overview
The first week of April 2025 opened with a bang as U.S. reciprocal tariffs went live. This triggered volatility across all major asset classes — particularly the U.S. Dollar and U.S. indices. While the USD battled with stagflation fears and range-bound indecision, equity markets became a case study in divergence: Dow Jones showed weakness due to global exposure, Nasdaq 100 showed resilience thanks to tech strength, and the S&P 500 hovered in between, reflecting mixed sentiment and sector rotation.
After briefly rising on risk-off flows, the dollar stalled as growth concerns mounted. The market remains cautious, waiting for clarity on inflation, jobs, and the Fed.
2. Dow Jones – Under Pressure from Trade Fallout
The Dow is taking the brunt of the tariff impact due to its heavy exposure to manufacturing and global exporters. Sentiment remains fragile amid fears of foreign retaliation.
3. NASDAQ 100 – Tech Resilience Despite Macro Jitters
Despite being hit early in March, the Nasdaq is bouncing back. Lower yields and investor rotation into tech are helping it stay afloat even as tariffs shake global sentiment.
4. S&P 500 – Caught in the Middle of Sector Rotation
The S&P is reflecting a sector tug-of-war. Defensive names and tech are offsetting declines in cyclicals and trade-sensitive stocks. The index is currently navigating a fair value gap zone.
5. Key Data to Watch This Week
→ A weak NFP could trigger USD downside and bullish equity momentum.

The USD post-tariff price action suggests a cautious tone. The dollar initially caught a safe-haven bid on trade uncertainty, but its gains are capped by concerns that U.S. tariffs will hurt domestic growth
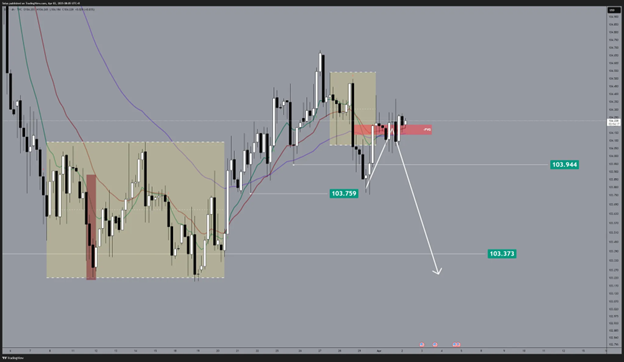
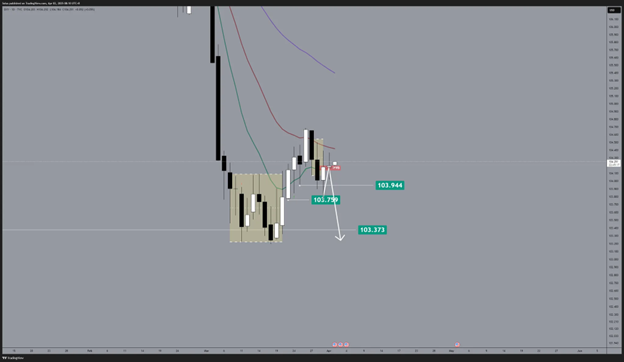
Traders are torn between the greenback’s typical haven status and the fact that this tariff shock originates in the U.S. economy. As a result, sentiment on the Dollar Index is mixed: it’s holding in a range as markets await clarity on how severe the economic fallout from the tariffs will be. As of now, Dollar is still in a range-bound stance since Friday, trading between 104.40 - 103.75.
Key Fundamentals
Daily
The greenback has not recovered since then and is trading in a broad consolidation.
4-Hour
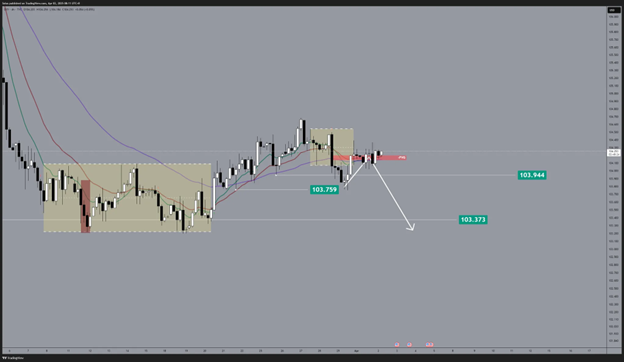
The bias is neutral-to-bullish: the dollar may grind higher on global risk aversion, but significant gains are less likely if U.S. economic data continues to deteriorate (which would fuel Fed rate-cut bets). Unless we break the 103.759 level for downside continuation or create new highs at the break of 104.70, uncertainty on its trajectory is still certain.
How the U.S. Dollar Affects U.S. Indices
1. ⬆️ Stronger Dollar = Headwind for Stocks (Mostly)
Most affected:
2. ⬇️ Weaker Dollar = Boost for Equities
Especially helps:
3. USD & Interest Rates Correlation
Most rate-sensitive:
4. Dollar Sentiment Signals Global Risk Appetite
As we move deeper into April, expect headline-driven volatility to remain high. The USD’s direction will continue to influence equity flows, and sector rotation will shape index performance. For traders, this environment favors relative strength plays, short-term setups, and macro-awareness over blind trend-following.
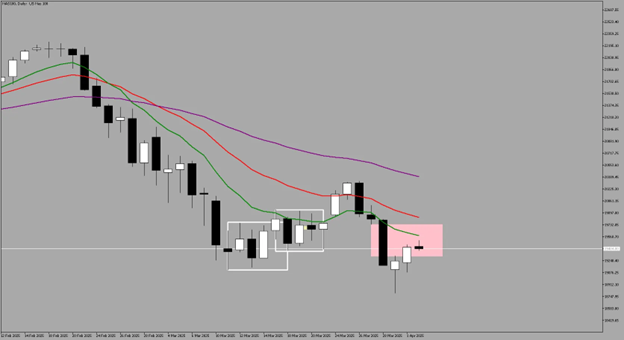
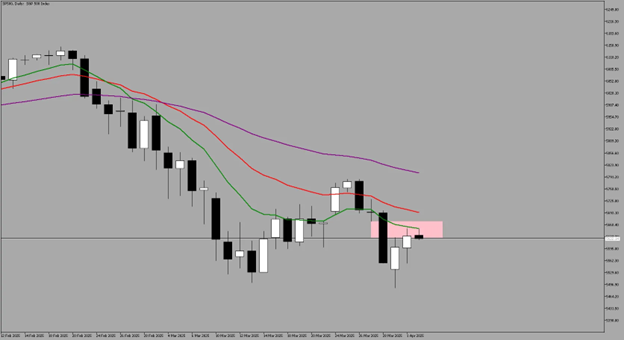
Dow Jones Industrial Average

The Dow Jones index, laden with industrial giants and exporters, sits at the epicenter of tariff fallout fears.
After the April 1 tariff implementation, Dow sentiment is skittish – the index has seesawed as investors weigh tariff costs against any potential benefits from domestic protectionism. So far, the damage seems to outweigh the good: the Dow struggled in late March and remains under pressure relative to tech-heavy indexes.

Daily
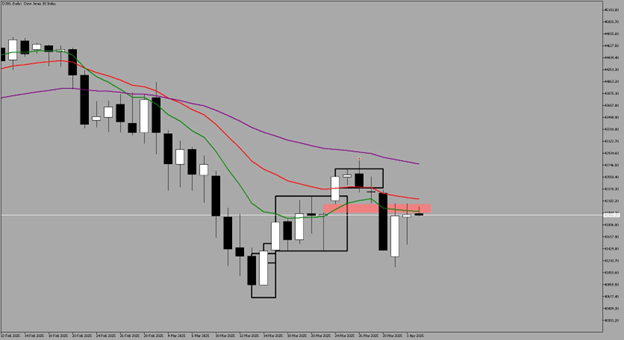
The Dow had a quick rebound after the week started with price action hovering at the 41996.70 - 42127.41 levels.
4-Hour
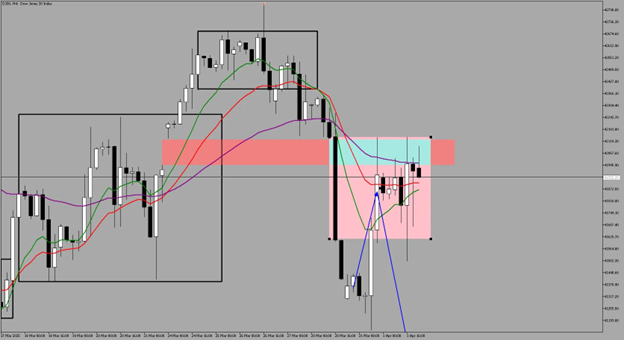
On the 4-Hour timeframe, we are also seeing the fair value gap at 42139.50 - 41614.14 level is currently being tested with potential downside if invalidated by trading through it and closing above it.
Trade Approach:
NASDAQ Performance Amidst Tariffs Concerns - Volatile
The Nasdaq has shown resilience in the face of the trade war news: after being among the hardest hit in early March, it led a late-month short rebound.
Daily
After taking out the liquidity at the most recent low price at 19110.35, NASDAQ took a 2-day rebound.
4-Hour
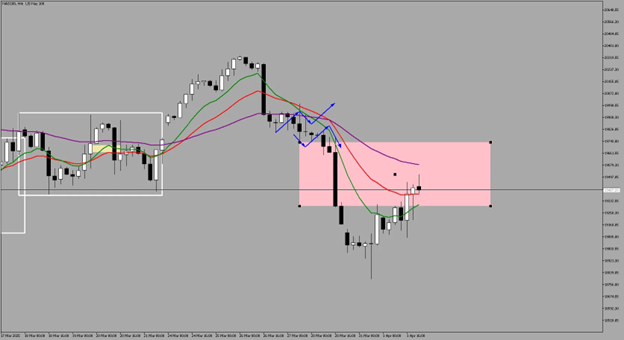
Currently its testing the equilibrium level at the 19296.70 - 19737.00 level. If the rejection is sustained, we could see further downside for the US tech stocks.
1-Hour
If we see a breakdown of a range for a downside move, we can look for short opportunities, focusing on range breakdowns with stops behind the range.
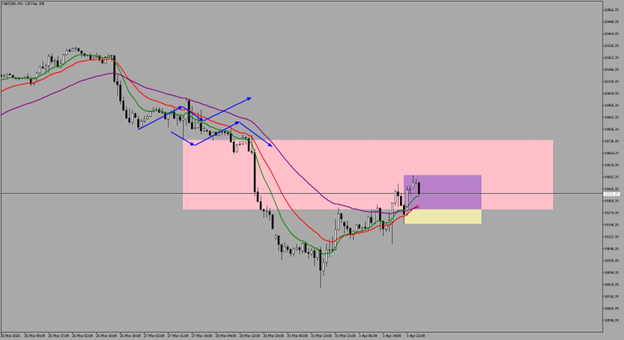
S&P 500 Uneven Performance

As the benchmark for U.S. equities, the S&P 500 is reflecting the tug-of-war between sectors: trade-sensitive industries are lagging, while defensive and some tech names are cushioning the index. The S&P 500 tariff impact has been evident in the market’s uneven performance – one day risk-off selloffs on tariff headlines, the next day dip-buying in oversold names.
Daily
With the same correlation with NASDAQ, after bouncing from the previous support priced at 5502 level, S&P is now testing the bearish fair value gap at the 5624.37 - 5669.79 level.
4-Hour
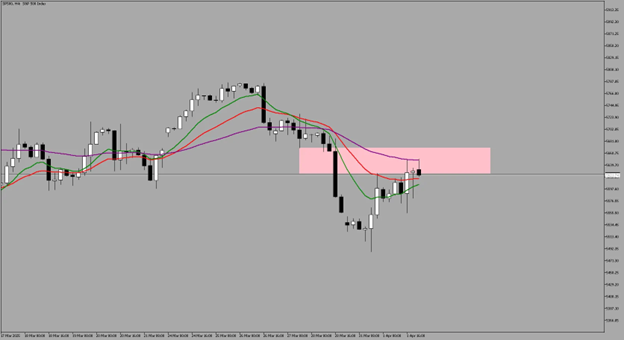
On the 4-Hour chart, S&P is still on a rebound with no signs, yet, of downside continuation.
Trade Approach:
Incoming Red Folders this Week
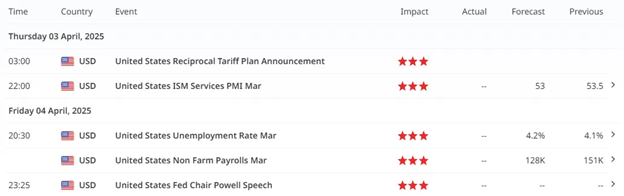
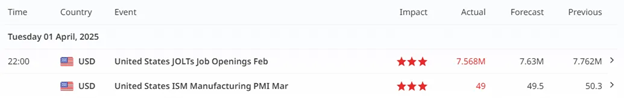
Keep watch on the Services PMI and primarily, the Non-Farm Payroll print for a momentum kick this week. With forecasts lower than the previous, this could be a hint of a weaker USD and can be a bullish potential for US stocks.
This content may have been written by a third party. ACY makes no representation or warranty and assumes no liability as to the accuracy or completeness of the information provided, nor any loss arising from any investment based on a recommendation, forecast or other information supplies by any third-party. This content is information only, and does not constitute financial, investment or other advice on which you can rely.
ACY Securities is one of Australia's fastest growing multi-asset online trading providers, offering ultra-low-cost trading, rock-solid execution, technologically superior account management and premium market analysis.
Select the categories and companies you wish to follow directly to your person rss feed.
Create Custom RSS Feed
just now
Sign up and join over 5,000 professional members who receive personalized news alerts, curated professional connections, and more for free!
Discover the key drivers, technical levels, and central bank expectations shaping the EUR/USD trend as the ECB prepares to hold rates and markets watch for a potential breakout.
Sydney-based multi-asset broker ACY Securities has introduced PAXGUSD, a new CFD instrument that allows clients to trade tokenised gold against the US Dollar 24 hours a day, seven days a week. The instrument is available across MetaTrader 4, MetaTrader 5, and the ACY Trading Platform.
Binance has lowered its VIP 3 Wallet Assets threshold from $3 million to $1 million and will now count OTC Spot Trading Volume at a 4x multiplier toward VIP qualification, removing the previous VIP 4 cap and allowing eligible users to progress through the full tier framework up to VIP 9.
Retail futures trading leader NinjaTrader Group has appointed Mark Omens as Senior Vice President, Commercial Strategy, bringing a 25-year veteran of derivatives marketplace CME Group into a newly created role focused on exchange partnerships and enterprise growth.
Gold Price Action Forecast: Will XAU/USD Drop to $3930? Meta Description: Read our Gold price action forecast to see if XAU/USD will drop to $3930.
BitDelta Securities Financial Services LLC (“BitDelta Securities”) today announced that it has received full regulatory approval from the Capital Market Authority (“CMA”) of the United Arab Emirates under the Category 5 — Arrangement and Advice license framework (License No. 20200000439). The approval follows the firm's receipt of In-Principal Approval earlier this year and represents the successful conclusion of the CMA's full licensing process, including the satisfaction of capital requirements, governance appointments, and operational setup.
Crypto.com has received a $400 million strategic investment from Citadel Securities, valuing the firm at $20 billion. It marks the first institutional funding round in the company's history, aimed at accelerating its expansion into tokenised securities, derivatives and other asset classes.
WTI’s pullback into $79–82 is the first major test of the bullish Elliott Wave count, with buyers targeting a renewed break above $85.

BitDelta Securities has secured a full CMA Category 5 licence in the UAE and opened a regulated office in Business Bay, Dubai. The firm operates as an introducing broker, connecting investors with licensed international brokers across multiple asset classes, with CEO Dr. Demetrios Zamboglou commenting on the milestone.
Index volatility is asleep while single stocks fight it out underneath, credit refuses to confirm the equity rally, and a bare macro calendar hands next week to oil.