just now

Liquidity Finder Ltd is incorporated in England and Wales, company number 10610740, registered address 167-169 Great Portland Street, Fifth Floor, London W1W 5PF, United Kingdom.
Published: just now


If you've been trading for a while, you've probably heard the idea that "the big players control the market." It’s one of those truths that sits quietly behind every price movement on your chart. Whether you’re trading XAUUSD, EURUSD, or commodities like oil, institutional capital moves the needle, and the retail crowd often follows. The question is, how do you see what these big institutions are doing? How can you tell if hedge funds are buying gold or if dealers are hedging a move in the euro?
The answer is the Commitment of Traders (COT) report a piece of publicly available data that almost feels like a cheat code when you learn how to read it right. In this article, I’m going to walk you through exactly what the COT report is, how it’s collected, what kind of information it shows, and most importantly how to use it in real trading, starting today.
Whether your brand new to futures data or already dabbling in macro sentiment, this will give you both the depth and the clarity you need to start using the COT report like a tool, not just a curiosity.
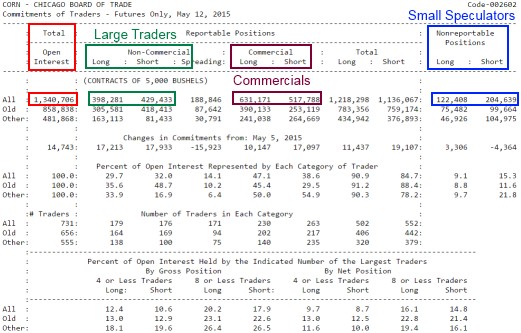
At its core, the Commitment of Traders report is a breakdown of open interest positions held by different types of traders in futures markets. It’s published every week by the Commodity Futures Trading Commission (CFTC) the regulatory body for U.S. futures and options markets. The goal of the report is to bring transparency to the market by showing where major categories of traders are positioned long, short, or flat.
The data comes directly from reporting firms and clearing members who are required to submit detailed position breakdowns to the CFTC. These reports are typically based on positions as of Tuesday's close, and the report is published on Friday at 3:30 p.m. Eastern Time.
So yes, there’s a built-in delay. That’s one of the trade-offs, and we’ll talk more about that soon. But even with that delay, the data is incredibly useful because it tells you what the biggest money in the market was doing just a few days ago and big money tends to move slowly. That means the footprints are still fresh when the report comes out.
One of the reasons traders get overwhelmed by the COT report is because of the terminology. It can feel like reading legal code at first. But once you break it down into who the players are, the picture becomes a lot clearer.
The report divides traders into a few key categories:
So, when you pull up a COT report especially in the "Disaggregated" format you’re seeing what real money and fast money are doing. That’s valuable context, especially when you want to figure out if a move is supported by institutional conviction or just noise.
When you first look at the COT data, the table format can feel intimidating. Lots of numbers. Longs here, shorts there, changes week over week. But all you really need to do is this:
Look at the net positioning for a particular group. That means subtracting the number of short contracts from the number of long contracts. Are asset managers long 200,000 contracts on gold futures and short 50,000? Then they’re net long 150,000. That gives you an idea of their bias.
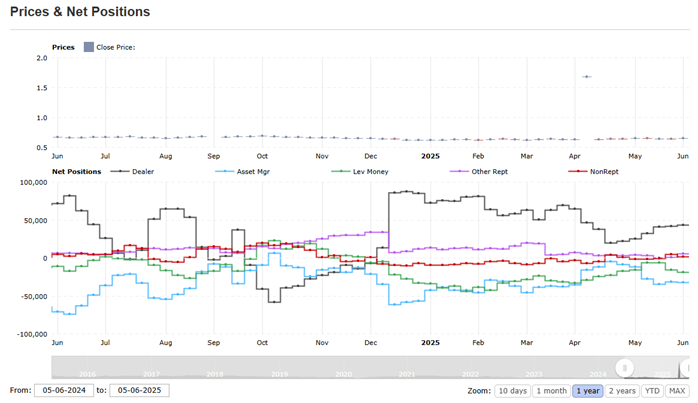
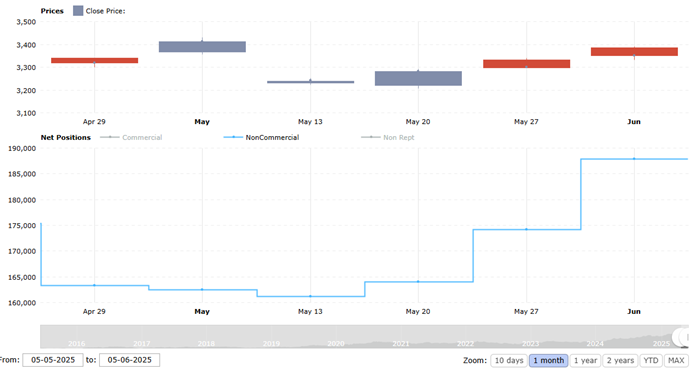
The second step is to track changes over time. The real signal in the COT report isn’t the static number it’s the shift. Did hedge funds just cut their euro longs by half? Did gold specs add 30,000 contracts in one week? These changes often lead price, or at the very least confirm the strength of a trend.
Some traders like to chart this data using tools like Tradingster, Barchart, which all convert the raw numbers into historical charts. This can make it easier to see reversals or extreme positioning that might suggest a turning point.
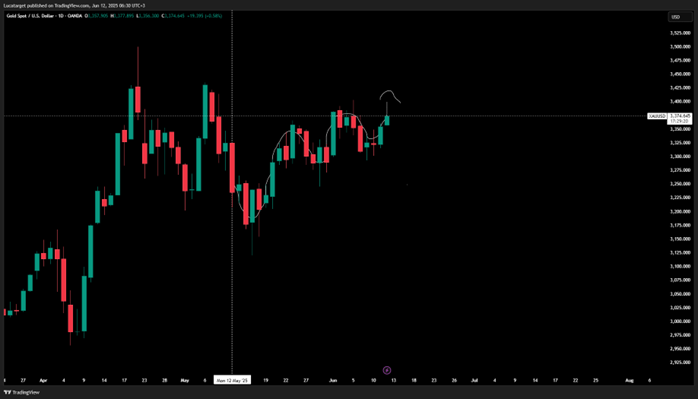
Let’s bring this into the real world. Suppose you’re trading gold, and price is hovering near a multi-month resistance. Your chart says maybe this is a top. But you check the COT data, and you see that leveraged funds have just added aggressively to their long positions for three weeks in a row. Meanwhile, asset managers are holding near-record longs.
Now you have a different story. Instead of fading the high, you might wait because the big players are still pushing in that direction. Or at the very least, you’ll reduce your position size or wait for confirmation before going against that weight of money.
On the other hand, if you see that leveraged funds have suddenly flipped from net long to net short, that’s a warning sign that momentum might be turning. Combine that with a weak technical structure, and now you’ve got a high-probability setup in the opposite direction.
Let’s be honest the COT report is not perfect. Like any tool, it has limitations. But it also has strengths that, when understood properly, make it one of the most underrated data points in trading.
The Good:
The Bad:
If you’re just starting out, don’t worry about mastering the full report overnight. Instead, start simple:
Pick one instrument like gold, oil, or EURUSD and check the COT data once a week. Focus on leveraged funds and asset managers. Are they building or reducing exposure? Are they net long or net short? Then look at what price has done over that time.
If positioning and price are moving in the same direction, that’s confirmation. If they diverge, something’s up and that’s where your opportunity may lie.
Make it part of your routine. Every Friday (or over the weekend), spend 15 minutes reading the update. Over time, you’ll start seeing the patterns and when you see a price move that aligns with a fresh shift in institutional positioning, you’ll feel a whole lot more confident pulling the trigger.
The Commitment of Traders report is not a crystal ball. It won’t tell you where price is going tomorrow. But it will show you where the serious money is betting, and that’s a powerful edge if you know how to use it. Trading is a game of probabilities, and when you’re lined up on the same side as the funds and institutions who move the market, your odds improve dramatically.
So, if you’ve been relying purely on price action, or if you’ve always wondered how to “trade like the big guys,” the COT report is your starting point. Learn the language. Follow the flow. And remember the clues are always there. You just need to know how to read them.
This content may have been written by a third party. ACY makes no representation or warranty and assumes no liability as to the accuracy or completeness of the information provided, nor any loss arising from any investment based on a recommendation, forecast or other information supplies by any third-party. This content is information only, and does not constitute financial, investment or other advice on which you can rely.
ACY Securities is one of Australia's fastest growing multi-asset online trading providers, offering ultra-low-cost trading, rock-solid execution, technologically superior account management and premium market analysis.
Select the categories and companies you wish to follow directly to your person rss feed.
Create Custom RSS FeedSign up and join over 5,000 professional members who receive personalized news alerts, curated professional connections, and more for free!
Sydney-based multi-asset broker ACY Securities has introduced PAXGUSD, a new CFD instrument that allows clients to trade tokenised gold against the US Dollar 24 hours a day, seven days a week. The instrument is available across MetaTrader 4, MetaTrader 5, and the ACY Trading Platform.
Binance has lowered its VIP 3 Wallet Assets threshold from $3 million to $1 million and will now count OTC Spot Trading Volume at a 4x multiplier toward VIP qualification, removing the previous VIP 4 cap and allowing eligible users to progress through the full tier framework up to VIP 9.
Retail futures trading leader NinjaTrader Group has appointed Mark Omens as Senior Vice President, Commercial Strategy, bringing a 25-year veteran of derivatives marketplace CME Group into a newly created role focused on exchange partnerships and enterprise growth.
Gold Price Action Forecast: Will XAU/USD Drop to $3930? Meta Description: Read our Gold price action forecast to see if XAU/USD will drop to $3930.
BitDelta Securities Financial Services LLC (“BitDelta Securities”) today announced that it has received full regulatory approval from the Capital Market Authority (“CMA”) of the United Arab Emirates under the Category 5 — Arrangement and Advice license framework (License No. 20200000439). The approval follows the firm's receipt of In-Principal Approval earlier this year and represents the successful conclusion of the CMA's full licensing process, including the satisfaction of capital requirements, governance appointments, and operational setup.
Crypto.com has received a $400 million strategic investment from Citadel Securities, valuing the firm at $20 billion. It marks the first institutional funding round in the company's history, aimed at accelerating its expansion into tokenised securities, derivatives and other asset classes.
WTI’s pullback into $79–82 is the first major test of the bullish Elliott Wave count, with buyers targeting a renewed break above $85.

BitDelta Securities has secured a full CMA Category 5 licence in the UAE and opened a regulated office in Business Bay, Dubai. The firm operates as an introducing broker, connecting investors with licensed international brokers across multiple asset classes, with CEO Dr. Demetrios Zamboglou commenting on the milestone.
Index volatility is asleep while single stocks fight it out underneath, credit refuses to confirm the equity rally, and a bare macro calendar hands next week to oil.
Digital assets and FX brokerage GC Exchange FZE (GCEX) has appointed Mohammed A. Mulla as a Board Member of its Dubai-based entity, part of the wider GCEX Group.