just now

Liquidity Finder Ltd is incorporated in England and Wales, company number 10610740, registered address 167-169 Great Portland Street, Fifth Floor, London W1W 5PF, United Kingdom.
Published: just now


To show you how to analyze the market from the top-down, align multiple timeframes for a single trade setup, and stack smart money confluences for maximum confidence and precision.
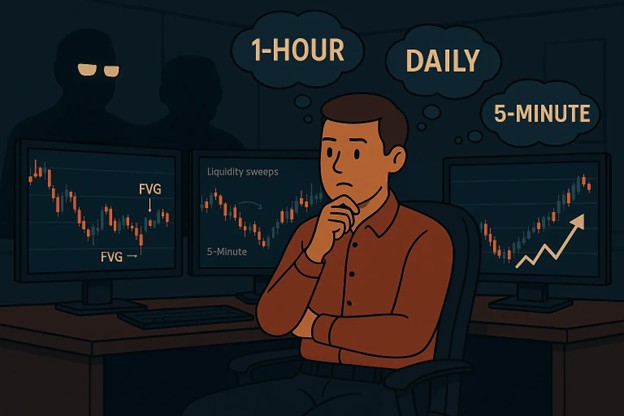
Smart money isn’t just reacting to what’s happening on M5 or M15—they’re operating from H1, H4, and Daily bias zones, while executing with surgical precision on the lower timeframes.
If you're only trading M5 setups in isolation, you're trading inside someone else's trap.
But when you align timeframes, you move in sync with the trap-setters.
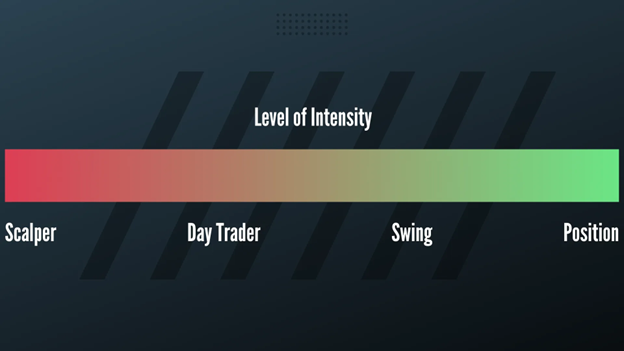
Below are the suggested timeframe combinations based on trader’s profile:
2.Day Trader - H1, M15, M5
3. Swing Trader - Daily, H4, H1
4. Position Trader - Monthly, Weekly, Daily
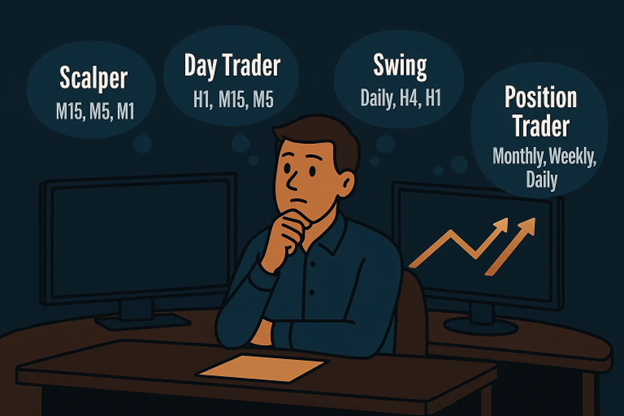
The timeframe that you will trade will depend on your profile. The profile includes your availability, personality, and strengths. If you can hold a position in a longer period, you might be a swing trader or a trend follower.
If your profile tells you that you like to be in action most of the time and you have a strong emotional resilience, you might be a day trader or scalper.
If your personality doesn't match your way of trading, your equity curve will reveal it to you.
Want to understand your profile and take the quiz? Check out this blog:
We’re not looking to trade every chart. We’re looking for:
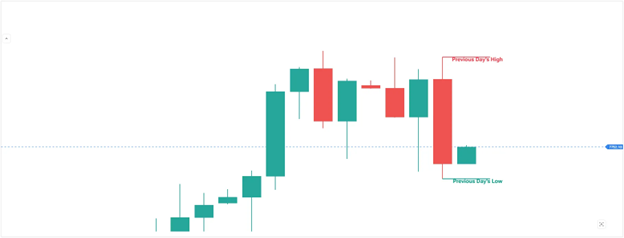
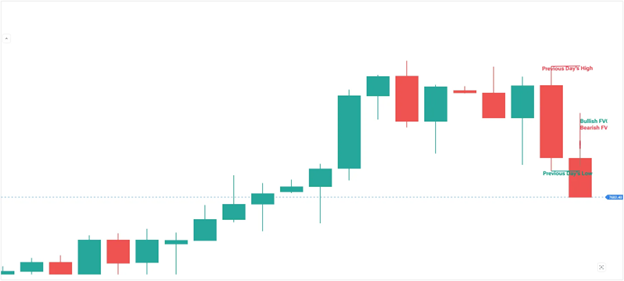
Basing on the Previous Daily Candle, we have a potential of breaking down from the Previous Day’s Low.
| Objective | Action |
|---|---|
| Find Key Liquidity | Mark PDH/PDL major swing highs/lows |
| Bias Clues | Is price approaching or reacting from HTF liquidity? |
| Anticipate Key Level Reactions | Frame where price will draw to either the previous day’s high or low |
You’re not trading D1—you’re framing the environment.
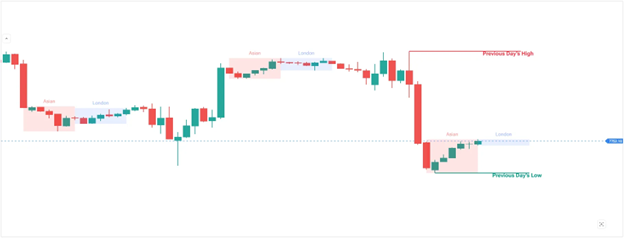
With the premise that we might go bearish based on the Previous Daily Candle, we are looking for shorts at Asian Highs or London Highs.
Note: Though our initial bias is bearish, we still need to look for validation at LTF. We either reverse at LTF for downside move or we might continue to rebound to the upside.
| Objective | Action |
|---|---|
| Mark Key Levels | Mark Asian and London Highs & Low |
| Wait for Key Levels | Don’t do anything unless a key level has been hit |
| Look for Sweeps | Has price swept a previous high or low? |
This is your HTF bias confirmation zone. If HTF hasn’t shifted, LTF trades are high risk.
| Objective | Action |
|---|---|
| Look for Key Level Reaction | Is there price strength at the level? Is price not having a follow through? |
| Look for IRL | Look for FVGs, iFVGs. Wait for candle confirmation if the IRLs are getting respected. |
| Enter Once Confirmed | Entry at Key Levels during Kill Zones ONLY (EU/NY sessions) |
| Use the SSS method for confirmation. | Wait for the Sweep. Execute at the Surge. Anticipate the Shift. |
You’re executing in sync with HTF direction, not against it.
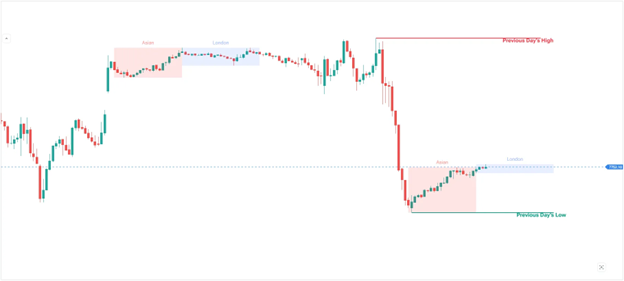
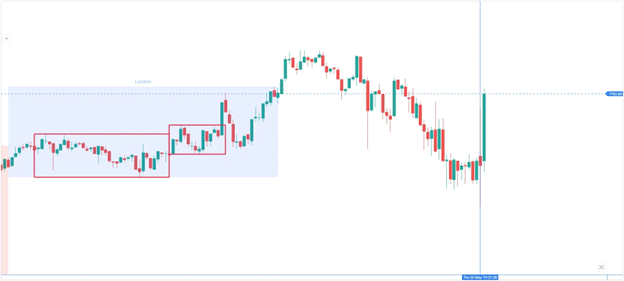
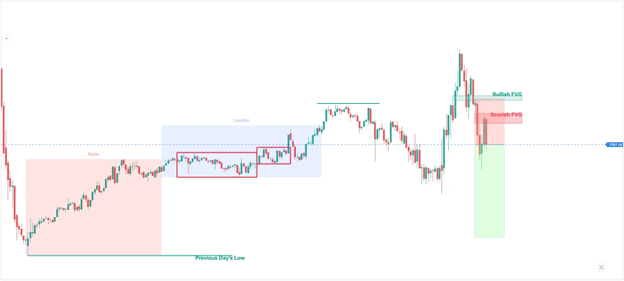
Looking at the LTF, it appears that the Asian high is holding its ground and there’s no obvious sweep of the Asian high.
Note: The key here is patience. If there’s no obvious Sweep at the London session. We anticipate the opportunity at the New York session.
We can wait for the 930AM EST New York Open for a potential sweep of London High or Low.
Right after the New York Open, after price flirting at the London Low, it managed to get support and went into momentum.
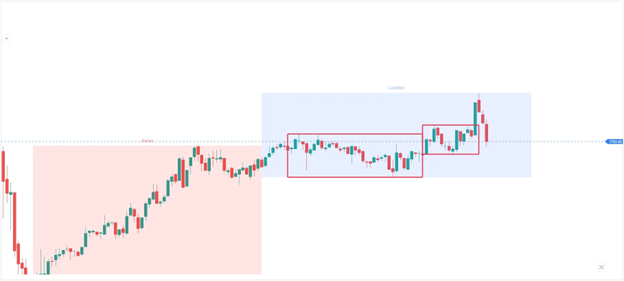
Looking back on our original bearish bias, we now have to shift to a bullish bias since:
Note: Bias must be flexible where price is reacting.
We just need now an FVG for entry.
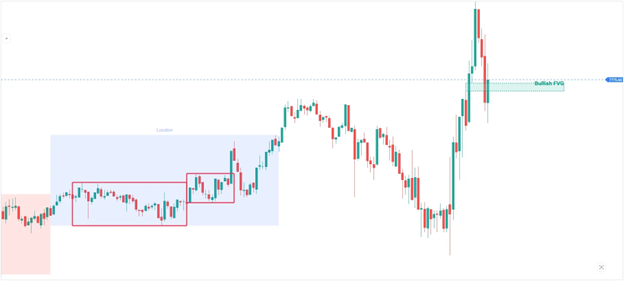
We had an FVG for opportunity but the probability of this holding decreased since price traded through it not respecting the bullish FVG.
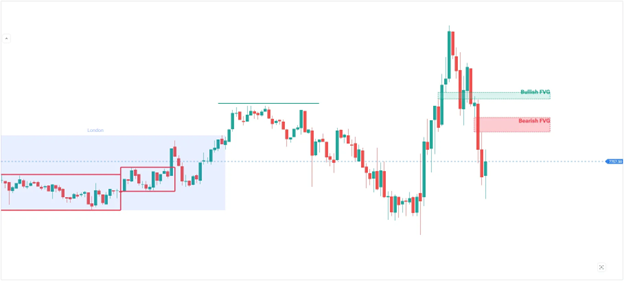
The Bullish FVG did not manage to hold. After dropping, price created a bearish FVG.
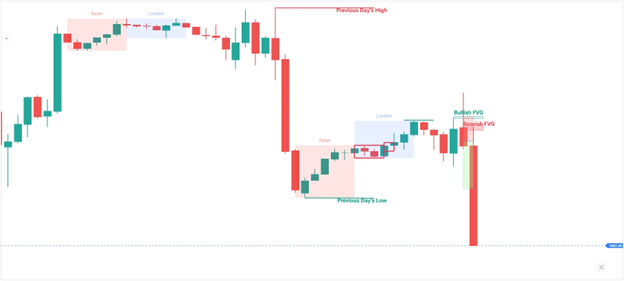
For context, let’s check the higher timeframe how it looks so we are still framing the trade.
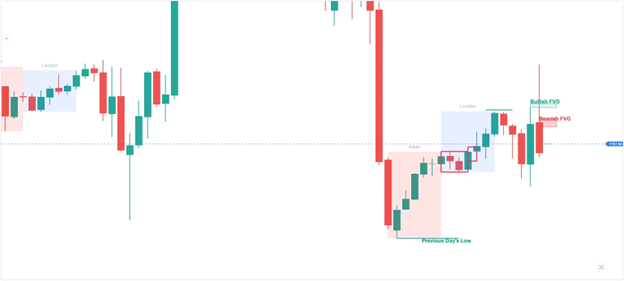
Looking at the H1 Higher Timeframe, apparently, price swept the London high during the New York session. After shifting from bearish to bullish and now to bearish again after the higher timeframe confirmed the sweep, we will now adjust.
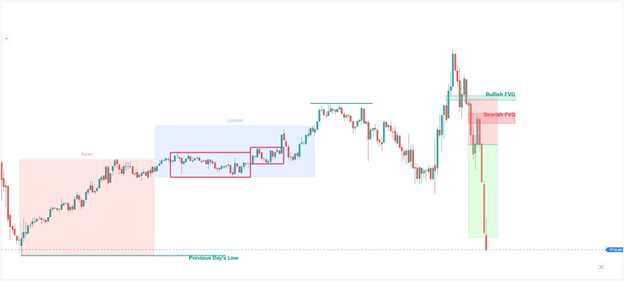
We now wait if the bearish FVG will hold for downside potential.
Looking at the bearish FVG, we had a bearish reaction. We can now enter here with stops just behind the 1st candle of the 3 candle FVG pattern.
We can set our TP either we reach 2-3R or the Asian Low together with the Previous Day’s Low.
Trade Flow:
You just executed a 3-timeframe aligned, institutional-grade setup.
| Layer | ERL | Sweep | Surge | Shift | Time Bias |
|---|---|---|---|---|---|
| D1 | ✅ (PDH / PDL) | Optional | Optional | Optional | Anchor bias zone |
| H1/M15 | ✅ (PSH / PSL) | Optional | Optional | Optional | Confirm shift |
| M5/M1 | ✅ (PSH / PSL) | ✅ | ✅ (Entry) | ✅ | Entry precision |
The more boxes you check across multiple frames, the stronger the trade.
Don’t chase setups. Instead, build layers of logic:
HTF Liquidity → MSS → FVG → LTF MSS → FVG Entry
This is how institutions stack confluences before deploying size. You’ll do the same, just on a smaller scale.
This content may have been written by a third party. ACY makes no representation or warranty and assumes no liability as to the accuracy or completeness of the information provided, nor any loss arising from any investment based on a recommendation, forecast or other information supplies by any third-party. This content is information only, and does not constitute financial, investment or other advice on which you can rely.
ACY Securities is one of Australia's fastest growing multi-asset online trading providers, offering ultra-low-cost trading, rock-solid execution, technologically superior account management and premium market analysis.
Select the categories and companies you wish to follow directly to your person rss feed.
Create Custom RSS FeedSign up and join over 5,000 professional members who receive personalized news alerts, curated professional connections, and more for free!
USD/CAD cools inside a tight bull flag as CPI, the BoC and a little-known tariff deadline all land in the same week.
Former TradingView CEO Oleg Mukhanov joins GoCharting as President and COO, with ex-TradeStation chief Salomon Sredni as Chairman, alongside Long Ridge investment.
Databento, the market data platform for modern finance, has raised a $97 million Series B led by NEA, with participation from DRW Venture Capital, Redpoint Ventures and Tribe Capital. The oversubscribed round drew over $300 million in demand and will fund global infrastructure and data centre expansion.
CME Group has announced Treasury Link, an industry-first functionality connecting CBOT Treasury futures and BrokerTec cash Treasuries via CME Globex. Leveraging FX Link technology, the service enables single-submission spread trading, eliminating legging risk, and is expected to launch in Q4 2026, pending regulatory review.
Marex Group has agreed to acquire Singapore-based Bright Point International, adding roughly $800m in client balances and over 70 staff across Asia and Europe. The deal expands Marex's clearing footprint in Asia Pacific and improves client access to Chinese markets, pending regulatory approval, expected to close by late 2026 or early 2027.
Read our latest Gold XAU/USD forecast update. See exactly how the $4,200 resistance triggered a massive selloff using proven Gold price action strategies.
Exness has welcomed Arab trader, educator and author Hussain Almatrouk to Exness Team Pro, its global network of elite traders and mentors. Active since 2009, Almatrouk brings a background in educational technology and a following of over 45,000 on Instagram, strengthening the broker's presence across the GCC.
Vantage Markets has secured a Capital Market Authority (CMA) Category 5 licence in the UAE, strengthening its regional presence across MENA. CEO Marc Despallieres said the licence underscores the firm's long-term commitment to the region as traders demand greater transparency and operational confidence.
XS.com has appointed Emily A. Aghajanyan as Regional Director for Emerging Markets, tasking her with leading the broker's growth strategy across high-growth regions. She joins from Alpari, bringing over a decade of leadership experience across the Middle East, North Africa, and other emerging financial markets.
Ondo Perps has launched a permissionless perpetual futures platform allowing tokenised equity holdings and stablecoins as collateral, offering 24/7 trading with up to 20x leverage on US stocks, ETFs, and commodities. Built on Ondo Finance's technology, it targets non-US investors seeking leveraged market access.