just now


Liquidity Finder Ltd is incorporated in England and Wales, company number 10610740, registered address 167-169 Great Portland Street, Fifth Floor, London W1W 5PF, United Kingdom.
Published: just now

To teach you how to:

Price action isn’t just candles and patterns.
It’s the language of money, and every candle reflects a human decision: to buy, sell, hesitate, or trap.
Most retail traders ask:
“Is that a bullish pattern?”
Professionals ask:
“Who’s being trapped here—and who’s in control?”

Most traders project their emotions onto the candle:
But here’s the truth:
A candle is neutral until placed in the right context.
The market is honest. It shows the footprints of money.
Traders lie to themselves through bias, hope, and fear.
You’ll often hear traders say:
“The rate hike was already priced in.”
“Even though earnings were great, the stock dropped. That was priced in.”
“Priced in” refers to the market anticipating an outcome and positioning ahead of it.
By the time the event happens:
This is the key idea behind:
Price leads anticipated fundamentals.
Yes — but it depends and only in context.
Let’s break it down:
Markets are forward-looking.
Traders and institutions don’t always wait for the news — they anticipate it.
Expectations are built in advance.
Smart money positions itself before data releases, earnings, rate decisions, etc.
Fundamentals don’t instantly move price — positioning does.
If a CPI report is “bad,” but price rallies, it could be that the bad news was already priced in or that expectations were worse.
So: Price often moves ahead of the news because the market is reacting to what it expects, not what just happened.
In these cases, the fundamentals shock the market → and price reacts.

Price leads anticipated fundamentals.
Fundamentals lead price when the market is caught off guard.
They coexist, but price often reveals sentiment and expectation before the event, and that’s why traders using price action often say:
“The chart knew before the news.”
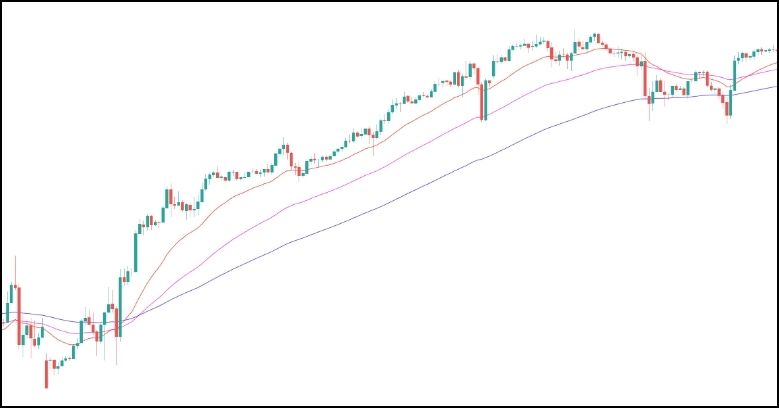
Never trade a candle in isolation.
Ask:
Context = Confirmation.
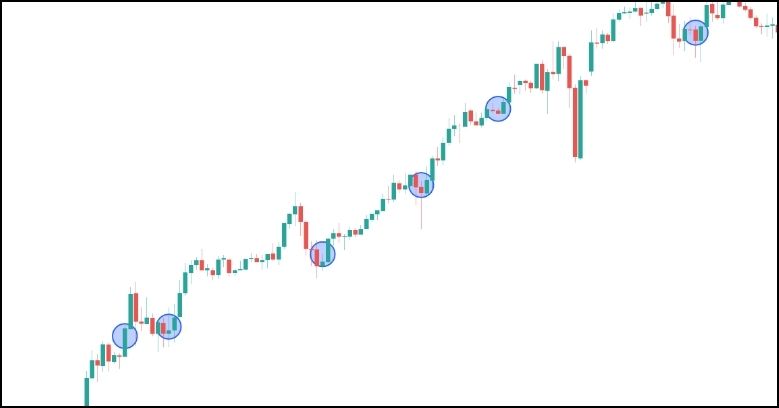
| Setup Type | Psychology | Entry Tip |
|---|---|---|
| Engulfing Candles at FVG or key level (support or resistance) | Bears trapped, bulls reclaim control | Wait for next candle to hold above midpoint |
| Rejection wick at Equal Highs / Lows | Stop-hunt of breakout traders | Enter on MSS or return to imbalance |
| Liquidity Sweep + Strong Close (Morning / Evening Star, Pin bars) | Trap, reversal, institutional interest | Confirmation via AMD or MSS |
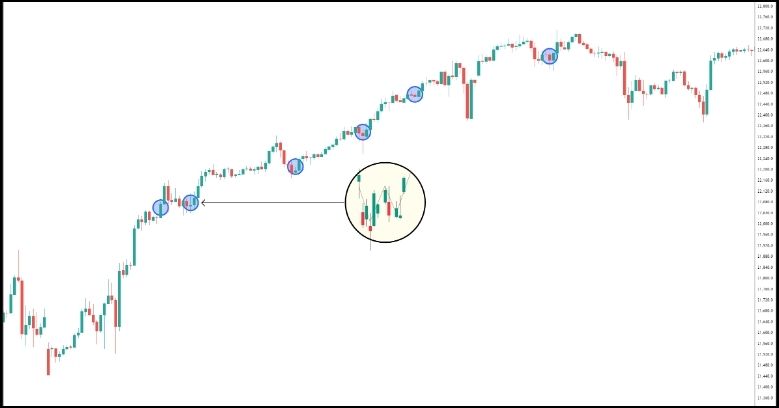
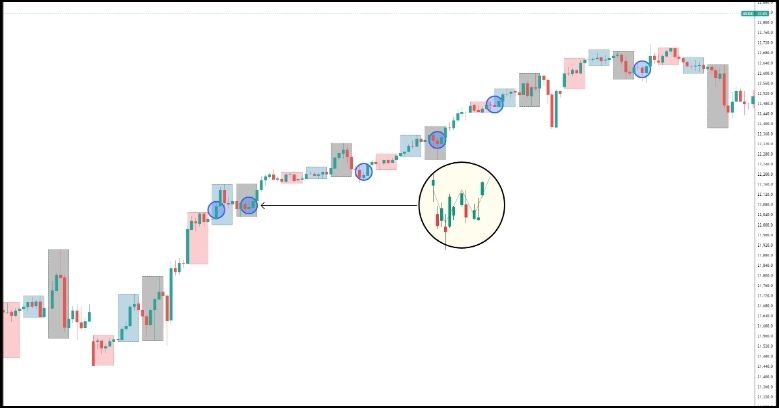
Price action works best when:
To learn more about multi-timeframe analysis and trader profiling, read these:
The Power of Multi-Timeframe Analysis in Smart Money Concepts (SMC)
Discovering Your Trader Profile: What Kind of Trader Are You?
| Mistake | Why It Fails |
|---|---|
| Trading random candles | No context = no edge |
| Overloading with indicators | Dilutes price clarity |
| Ignoring structure | Patterns fail without alignment |
| Reacting emotionally | Candles don’t lie—you do if you chase them |

Candlesticks are like body language in negotiation.
Without the full conversation (context), body language is misread.
Same with candles. Don’t read the face. Read the story.
| Step | Task |
|---|---|
| 1 | Define HTF bias and trend direction |
| 2 | Mark liquidity zones (PDH/PDL, FVGs, EQH/EQL) |
| 3 | Watch for candle behavior near key zones |
| 4 | Wait for confirmation (MSS, structure shift, AMD) |
| 5 | Log trade entry/exit and emotional state in journal |

“You can’t lie to the market. But the market will show you every lie you believe about yourself.”
Candlesticks are the truth of trader behavior.
Master them—not by memorizing shapes—but by reading their story.
How To Trade & Scalp Indices at the Open Using Smart Money Concepts (SMC)
How to Trade Breakouts Effectively in Day Trading with Smart Money Concepts
Complete Step-by-Step Guide to Day Trading Gold (XAU/USD) with Smart Money Concepts (SMC)
The Power of Multi-Timeframe Analysis in Smart Money Concepts (SMC)
Forex Trading Strategy for Beginners
Mastering Candlestick Pattern Analysis with the SMC Strategy for Day Trading
Mastering Risk Management: Stop Loss, Take Profit, and Position Sizing
RSI Divergence Trading Strategy for Gold: How to Identify and Trade Trend Reversals
Stochastics Trading Secrets: How to Time Entries in Trending Markets using Stochastics
Gold Trading Stochastics Strategy: How to Trade Gold with 2R–3R Targets
RSI Hidden Divergence Explained: How to Spot Trend Continuations Like a Pro
Why Smart Money Concepts Work in News-Driven Markets - CPI, NFP, and More
How to Trade NFP Using Smart Money Concepts (SMC)-A Proven Strategy for Forex Traders
How to Trade CPI Like Smart Money - A Step-by-Step Guide Using SMC
How to Start Trading Indices and Get into the Stock Market with Low Capital (2025 Guide)
Best Indices to Trade for Day Traders | NASDAQ, S&P 500, DAX + Best Times to Trade Them
How To Trade & Scalp Indices at the Open Using Smart Money Concepts (SMC)
NAS100 - How to Trade the Nasdaq Like a Pro (Smart Money Edition)
How to Trade CPI Like Smart Money - A Step-by-Step Guide Using SMC
Why Smart Money Concepts Work in News-Driven Markets - CPI, NFP, and More
How to Swing Trade Gold (XAU/USD) Using Smart Money Concepts: A Simple Guide for Traders
Complete Step-by-Step Guide to Day Trading Gold (XAU/USD) with Smart Money Concepts (SMC)
The Ultimate Guide to Backtesting and Trading Gold (XAU/USD) Using Smart Money Concepts (SMC)
Why Gold Remains the Ultimate Security in a Shifting World
How to Trade Candlestick Patterns with High Probability: A Complete Guide for Beginners
The Top Japanese Candlestick Guide: What is an Engulfing Pattern and How to Trade It?
Piercing Pattern Candlestick Explained: How to Trade It - Step-By-Step Guide
Morning & Evening Star Candlestick Patterns – How to Trade Market Reversals with Confidence
5 Steps to Start Day Trading: A Strategic Guide for Beginners
8 Steps How to Start Forex Day Trading in 2025: A Beginner’s Step-by-Step Guide
3 Steps to Build a Trading Routine for Consistency and Discipline - Day Trading Edition
The Ultimate Guide to Understanding Market Trends and Price Action
How to Identify Risk-On and Risk-Off Market Sentiment: A Complete Trader’s Guide
How to Trade Risk-On and Risk-Off Sentiment - With Technical Confirmation
The Ultimate Guide to Understanding Market Trends and Price Action
Why Smart Money Concepts Work: The Truth Behind Liquidity and Price Action
Mastering the Market with Smart Money Concepts: 5 Strategic Approaches
Mastering Candlestick Pattern Analysis with the SMC Strategy for Day Trading
Understanding Liquidity Sweep: How Smart Money Trades Liquidity Zones in Forex, Gold, US Indices
The SMC Playbook Series Part 4: How to Confirm Trend Reversal & Direction using SMC
The SMC Playbook Series Part 5: The Power of Multi-Timeframe Analysis in Smart Money Concepts (SMC)
Fair Value Gaps Explained: How Smart Money Leaves Footprints in the Market
The Best Time to Use Smart Money Concepts (SMC): Why Timing Is Everything in Trading SMC
How to Trade the London Session Using Smart Money Concepts (SMC)
The Mental Game of Execution - Debunking the Common Trading Psychology
5 Steps to Backtest a Trading Strategy with AI: A Step-by-Step Guide
Managing Trading Losses: Why You Can Be Wrong and Still Win Big in Trading
The Hidden Threat in Trading: How Performance Anxiety Sabotages Your Edge
Why You Fail in Trading: You Don’t Have Enough Capital to Survive
Why 90% of Retail Traders Fail Even with Profitable Trading Strategies
The Top 10 Best Trading Books That Changed My Mindset, Strategy & Performance
Discovering Your Trader Profile: What Kind of Trader Are You?
Follow me for more daily market insights!
Jasper Osita - LinkedIn - FXStreet - YouTube
This content may have been written by a third party. ACY makes no representation or warranty and assumes no liability as to the accuracy or completeness of the information provided, nor any loss arising from any investment based on a recommendation, forecast or other information supplies by any third-party. This content is information only, and does not constitute financial, investment or other advice on which you can rely.
ACY Securities is one of Australia's fastest growing multi-asset online trading providers, offering ultra-low-cost trading, rock-solid execution, technologically superior account management and premium market analysis.

Select the categories and companies you wish to follow directly to your person rss feed.
Create Custom RSS Feed
just now
Sign up and join over 5,000 professional members who receive personalized news alerts, curated professional connections, and more for free!
The SEC has approved Cboe's binary options tied to key performance indicators reported by 23 companies, covering more than 100 metrics such as iPhone revenue. The cash-settled contracts pay a fixed $1, Robinhood plans to be the first retail broker to offer them, and trading awaits clearing registration.
Gold is trading around $4,150, recovering sharply after falling to a recent low of $4,073.

Global semiconductor and technology stocks sold off sharply on Thursday, with South Korea’s SK Hynix plunging over 10% and Samsung Electronics falling more than 8%.
Learn gold market structure to identify bullish, bearish and ranging XAUUSD trends using higher highs, higher lows, lower highs and lower lows, support and resistance.
Axi has launched an MCP integration connecting eligible MT5 accounts to Claude, allowing clients to access live market data, track positions, execute trades and update risk parameters through the AI assistant developed by Anthropic. Available to eligible Axi clients with an active MT5 account. Setup runs via Claude.ai.
Movantis has selected Integral to extend its FX liquidity offering for institutional clients including banks, payment networks and digital asset operators, adding an institutional trading platform, direct-to-client API trading and API connectivity into a third-party multi-dealer venue, supporting regional expansion.
Running a venue around the clock is the easy part. Pricing risk when the market underneath it is shut is not. Lars Holst, CEO of GCEX explains how to manage risk in 24/7 markets.
ATFX has released its Q4 2026 Trader Magazine, offering a closer look at the macroeconomic and market forces that could shape trading conditions in the final quarter of the year.
LSEG has announced a collaboration with NVIDIA that lets financial institutions analyse years of LSEG Tick History data in seconds using NVIDIA cuDF on GPUs, without creating another full copy of the dataset. Tick History holds 110 trillion rows across 100 million instruments and more than 580 venues and contributors.
Standard Chartered has launched a cryptocurrency trading solution letting eligible affluent clients buy and sell Bitcoin and Ether through existing bank accounts. Built with Zodia Markets and regulated by VARA, it launches first for Professional Investor clients in the UAE, with other markets to follow over time.