just now

Liquidity Finder Ltd is incorporated in England and Wales, company number 10610740, registered address 167-169 Great Portland Street, Fifth Floor, London W1W 5PF, United Kingdom.
Published: just now


Welcome to our deep dive into Market Trends and Price Action, the blueprint of price movement that lays the foundation for every successful trading strategy.
In this blog, we'll explore how market structure represents the very framework of price swings, market trends, support and resistance levels, and distinct market phases, all of which come together to tell the story of where the market has been and where it might be headed.
In the sections that follow, we'll break down:
How it represents the dynamics of price movement.
Mastering this concept is key to interpreting market sentiment and making informed trading decisions.
Using patterns like Higher Highs, Lower Lows, and more to gauge market direction.
How these levels serve as the critical points for trade entries and exits.
A look at accumulation, manipulation, and distribution to reveal the narrative behind price movements.
By applying these concepts to your trading routine, you'll learn to map out the market’s structure, anticipate potential moves, and ride trends with confidence while effectively managing risk.
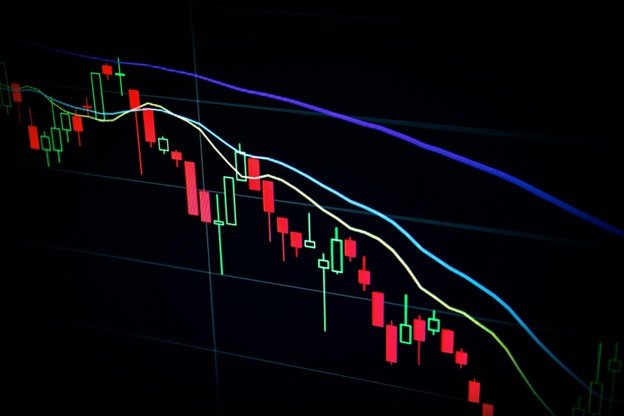
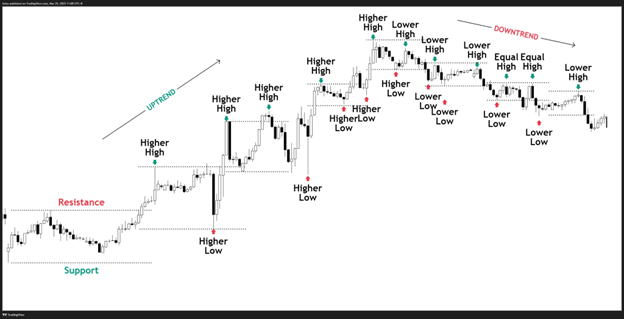
Imagine looking at a chart of EUR/USD or a stock like AAPL. Each peak and trough, each rejection at a support or resistance level, is a piece of the puzzle. When you see a series of higher highs and higher lows, it tells you that buyers are in control, signaling an uptrend. Conversely, lower highs and lower lows indicate a downtrend. And when prices settle into equal highs and lows, the market is likely range-bound, moving sideways without a clear direction.
Market structure represents the framework of price movement, including swings, support/resistance, and phases.
Understanding these elements isn’t just academic—it’s practical. Recognizing market phases like Accumulation, Manipulation, and Distribution enables you to identify when the market is quietly building positions, when it’s gearing up for a breakout, and when it's time to take profits before a reversal occurs.
A solid grasp of market structure allows you to make informed decisions, interpret market sentiment, and set up reliable trade entries and exits. It’s the foundation upon which all trading strategies are built.
Market structure represents the blueprint of how prices move over time, and mastering it is the foundation for all trading strategies. By recognizing key patterns—such as swings, support and resistance levels, and the phases of market behavior, you can better gauge where the market is heading and make more informed trading decisions.
Imagine you’re looking at a chart of EUR/USD or a stock like $AAPL. The chart is filled with peaks and troughs that tell a story:
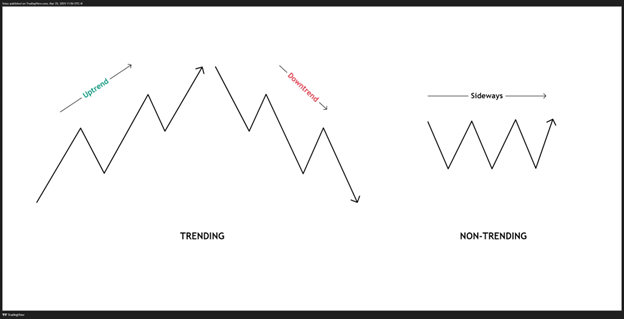
A trending market shows clear directional movement, which can be easier to trade as the trend provides guidance on potential entries and exits.
In a range-bound market, prices oscillate between fixed levels. Recognizing these conditions is key to applying breakout or reversal strategies effectively.
Identifying Swings and Trends
To further understand the market structure, we also need to understand how it is being built. As mentioned above, a market structure comprises of a combination of market swings, swings highs and swing lows.
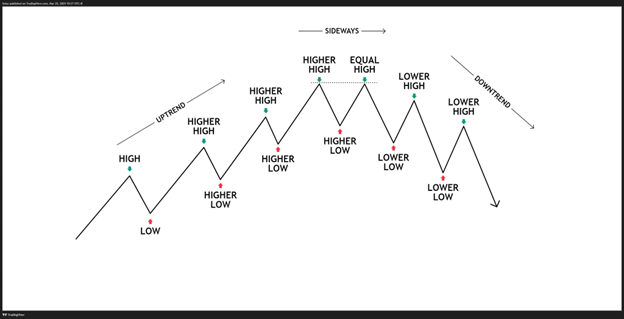
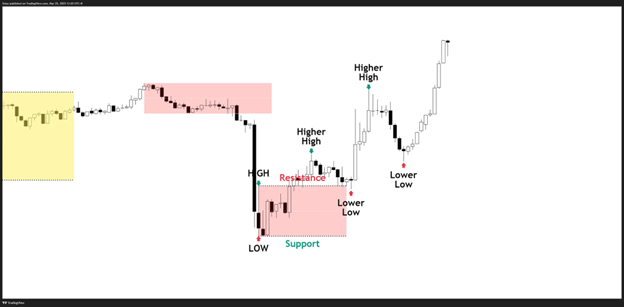
When you see a series of higher highs (HHs) and higher lows (HLs), you know buyers are in control, and the market is in an uptrend. Conversely, lower highs (LHs) and lower lows (LLs) indicate a downtrend. In a sideways or range-bound market, equal highs (EHs) and equal lows (ELs) are obvious, suggesting no clear direction.
Key Concepts:
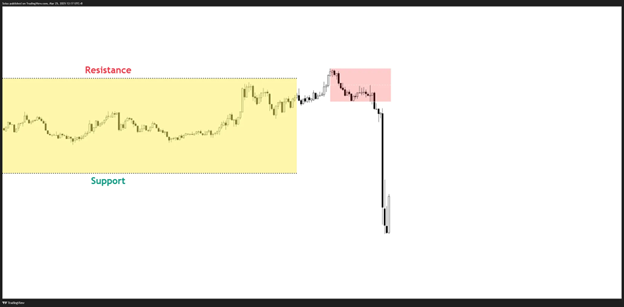
These are the levels where price has historically struggled to move past. Support acts as a floor when prices decline, and resistance serves as a ceiling when prices rise. By drawing these levels, you can pinpoint potential entry and exit points. For instance, once you identify that the price has been rejected at a specific resistance level several times, you might prepare for a breakout when that level is finally surpassed.
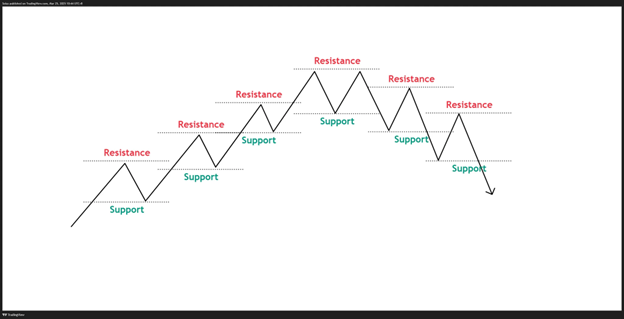
Swings cannot be created if there are no support or resistance levels being created.
Drawing Support and Resistance Levels

Step 1: Identify an Initial Move.
Step 2: Wait for price to reject.
Step 3: Wait for the price to find support.
Step 4: Wait for a breakout.
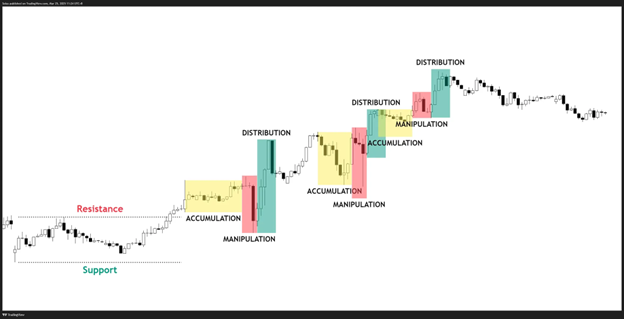
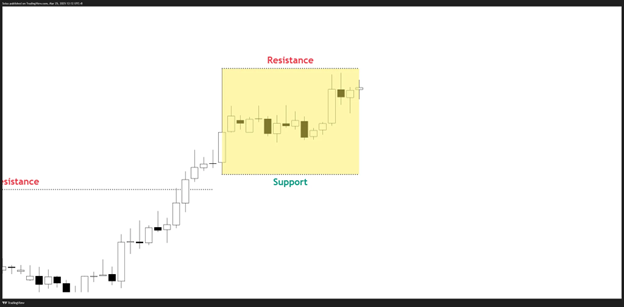
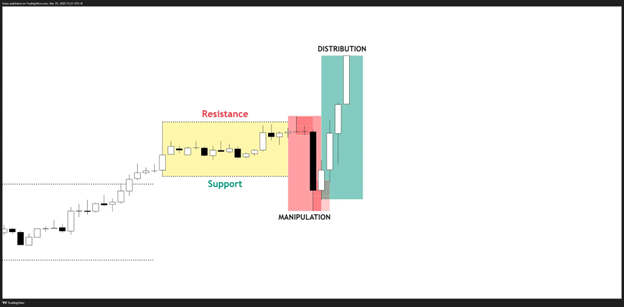
A market structure has phases. It’s not enough to follow price without understanding the narrative or the story behind its price movements.
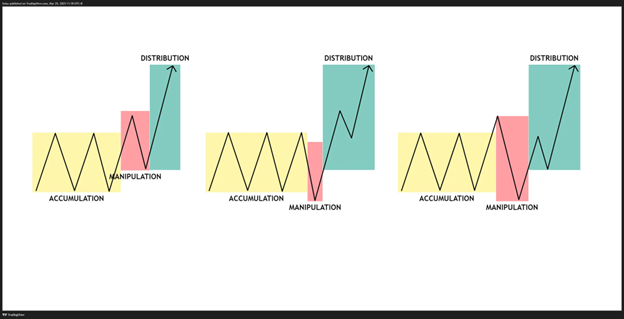
When examining the market behavior, you can see a classic example of the three primary market phases:
This is the phase where liquidity is being pooled as the market is going on sideways.
During the Accumulation phase, the market trades in a narrow range as buyers quietly build positions.
In the Manipulation phase, the market is engineered taking out either side of the market before going to the actual direction. Knowing the manipulation phase keeps you out of the market and waiting for the coast to be clear before you look for opportunities.
During the manipulation phase, price stages a breakout but pulls back inside the range, taking out the weak hands. Another scenario are price break down on the opposite side then quickly reverses to the upside, taking out stop loss orders on both sides.
Finally, in the Distribution phase, as the manipulation is already done, and the needed liquidity has already been gathered, this is where we’d want to ride where the price is now ready to go in a certain direction.
This is the phase after the manipulation, or the liquidity has already been taken out and its ready to go to the actual direction.
Once we understand how market structure works, how to plot levels, and its phases, the next step is to identify where price is going.
Understanding market structure is the essential first step—it equips you with the knowledge of how prices behave and forms trends.
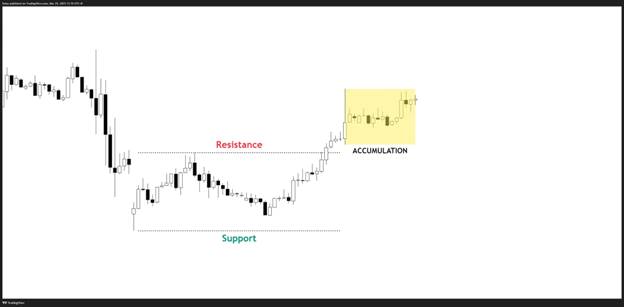
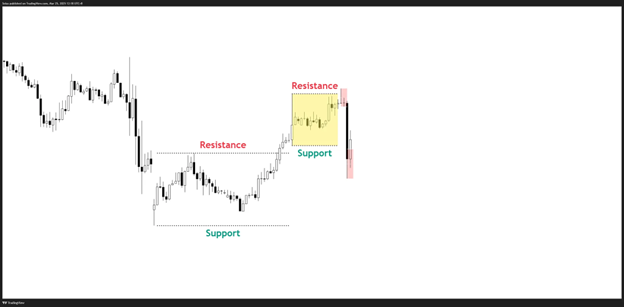
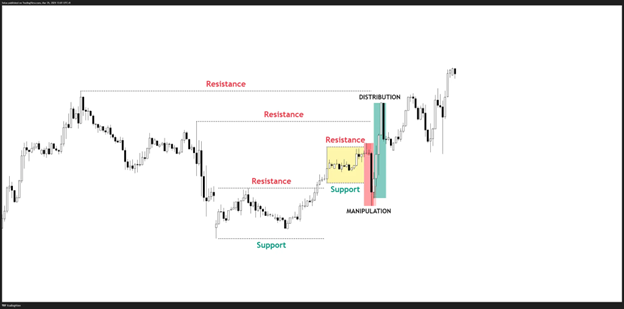
In this case, the price previously was on a downtrend market and paused by creating a sideways market.
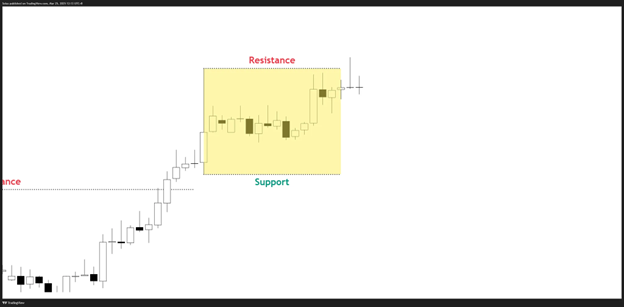
Currently, the price has already broken out of the range with a potential to go for another upside move.
Based on the structure, we are on an uptrend market coming from a sideways market and downtrend market.
2. Mark Support and Resistance Levels:
3. Determine the Market Phases:
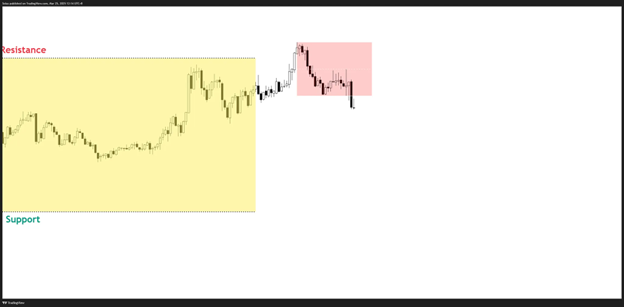
Wait for price to reveal its intent by waiting for price to break out or breakdown.
Price, if institutions are present, will stage a breakout that could be a fake out.
Price trade to break out but it did not close above the range, signaling a potential fake out.
We can check a much lower timeframe to confirm if it’s going to breakout or breakdown.
Going on the M5 Timeframe, we can see that price failed to break out and proceed to breakdown on the lower timeframe, signaling a reversal move.
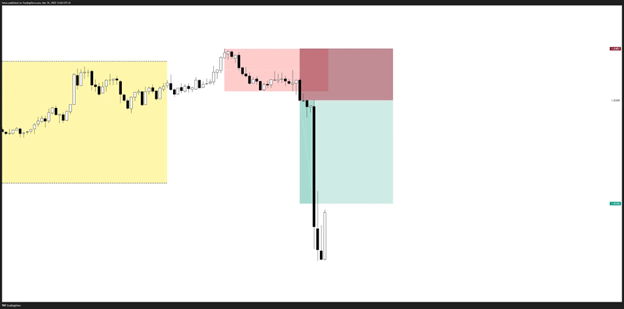
2. Manipulation Trade
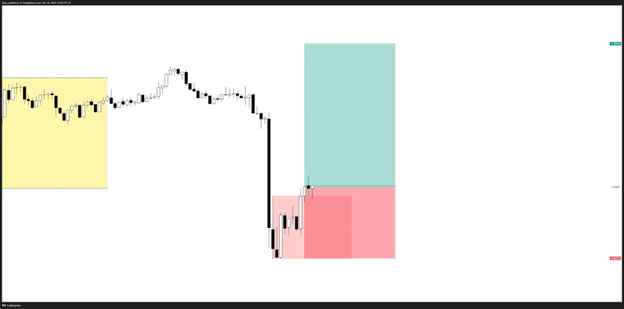
With this method, we can trade in favor of the trend.
Targets can be set at the previous resistance levels. You can also set targets at 2R to 3R.
If you are going to hold the position, be careful, as manipulations on previous lows can still occur along the way and could even proceed to a reversal.
By integrating these concepts into your trading routine, you can develop a more disciplined, informed approach that increases your chances of making the right moves in the market. This holistic view—from understanding market structure to executing precise trades—empowers you to ride trends confidently and manage risk effectively.
ACY Securities is one of Australia's fastest growing multi-asset online trading providers, offering ultra-low-cost trading, rock-solid execution, technologically superior account management and premium market analysis.
Select the categories and companies you wish to follow directly to your person rss feed.
Create Custom RSS FeedSign up and join over 5,000 professional members who receive personalized news alerts, curated professional connections, and more for free!
Webull Corporation has launched Webull Institutional, a platform offering brokerage infrastructure, clearing, APIs and embedded investing solutions for brokers, hedge funds, advisers and fintechs. The launch follows FINRA's April 2026 approval of Webull Securities (US) LLC as a clearing broker.
dxFeed has expanded its data offering on Overcharts, adding OPRA's consolidated US options feed and extending CME Group futures data to include futures options. Existing subscribers gain automatic access with no resubscription or pricing changes, bringing new options analytics to the retail trading platform.
Retail brokerage Robinhood Markets set out a wide-ranging expansion of its product range at a London keynote event last week, launching its own blockchain, extending tokenised equity trading to more than 120 countries, and rolling out perpetual futures on foreign exchange and commodities for the first time.
Broadridge's Distributed Ledger Repo platform processed a $357 billion daily average in June, up 68% year-on-year, with $7.5 trillion in total volume. The firm is also partnering with Kaiko to bring aggregated DLR market data to Bloomberg Terminal subscribers, expanding visibility into institutional onchain repo activity.
Broktinger has launched a unified Tool Suite, bringing its dealing, risk, back-office and reporting tools for MT4 and MT5 brokers into a single workspace, with no local installs required.
Trade Nation has launched its products and services in Europe via a new Portuguese regulated entity, authorised by the CMVM. The move follows the opening of its Lisbon office and allows the CFD provider to passport its offering across the EU, with onboarding and support delivered in native languages.
DIGITEC has promoted Darryl Hooker to Chief Sales Officer, tasking him with leading the firm's commercial growth. Hooker, who joined DIGITEC in April 2026, brings over 40 years of FX market experience from roles at EBS/NEX, 360T and Fenics FX, and will now drive global sales strategy across DIGITEC's multi-asset platform.
Your Bourse has integrated TradingView charts and the TradingView Trading Platform library with Trade Server, giving brokers a modern trading interface powered by an API-first, multi-asset backend with predictable flat monthly pricing.
Multi-asset CFD broker Vantage Markets has announced the launch of XAUUSD247, a new over-the-counter gold contract for difference that allows eligible clients to trade around the clock, including weekends.
cBridge, Spotware's liquidity bridge, has partnered with Tapaas, a real-time risk intelligence platform for FX and CFD brokers, connecting trading and execution data with live analytics on exposure, execution quality, client behaviour and profitability, with pricing models designed not to penalise broker growth.