just now
Liquidity Finder Ltd is incorporated in England and Wales, company number 10610740, registered address 167-169 Great Portland Street, Fifth Floor, London W1W 5PF, United Kingdom.
Published: just now

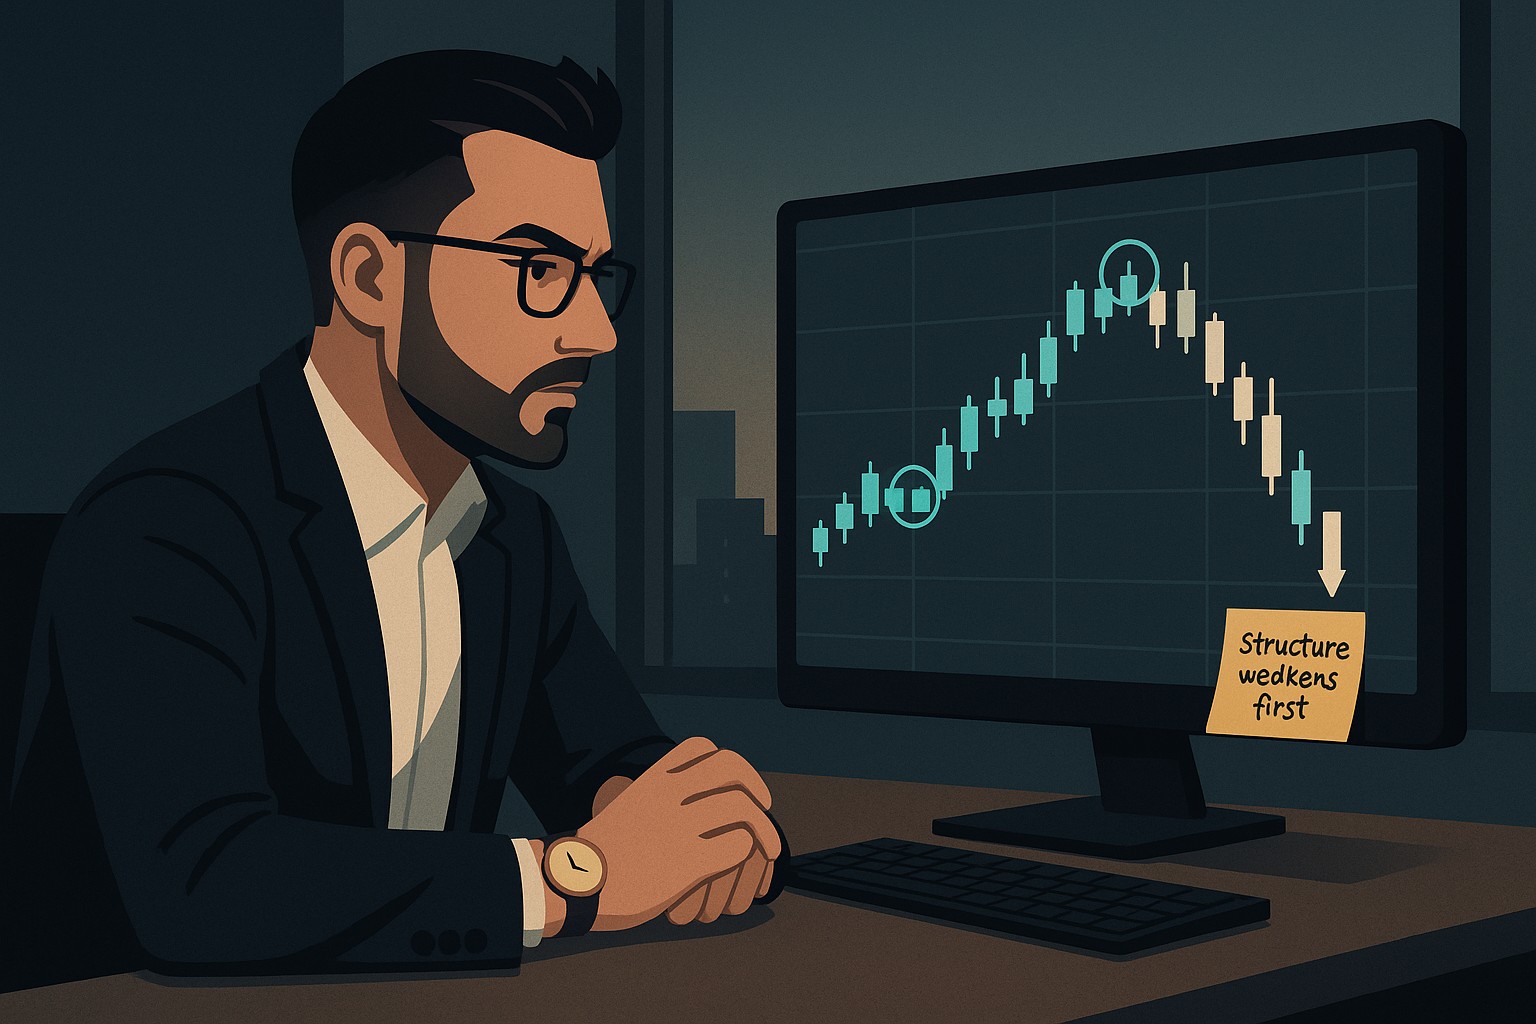
Market structure is the first real skill every trader must learn - not because it’s complicated, but because it changes everything once you finally see it.
Indicators can help. Tools can assist. Strategies can guide you.
A great complement to this is learning to think like a price action trader, where you focus on behavior, not just signals.
But nothing replaces the ability to open a chart, zoom out, and understand exactly:
This module isn’t about fancy concepts or hidden tricks.
It’s about learning to read the market in its purest form - the natural rise and fall of price that reveals the entire story.
Once you understand market structure, every other skill becomes easier.
Entries make sense.
Risk management becomes logical.
Timing becomes clearer.
Your confidence grows because you’re no longer reacting - you’re reading.
Let’s break it down piece by piece.
Market structure is simply the blueprint of how price moves.
Nothing more, nothing less.
Every chart - from Forex to gold to indices to crypto - is made of the same repeating patterns:
These cycles form the “grammar” of the market.
If price makes higher highs and higher lows, the story is bullish.
If it makes lower highs and lower lows, the story is bearish.
If it goes sideways, the story is undecided.
Market structure is the simplest form of technical analysis, but it is also the foundation of every advanced concept - trends, breakouts, liquidity, order blocks, reversals, and more.
Without structure, you are trading blind.
The Three Market Conditions
Every chart on every timeframe fits into one of these three categories.
An uptrend reflects strength.
Buyers dominate, and each pullback fails to break previous lows.
This is where trend followers and SMC traders often look for continuation setups at key zones, similar to how price action at key levels is used to frame high probability trades.
Characteristics:
When price respects higher lows repeatedly, the market is showing conviction.
A downtrend reflects weakness.
Sellers dominate, and each rally is swallowed by stronger bearish pressure.
Characteristics:
Downtrends often move faster because fear and forced liquidations accelerate selling, especially around major events like NFP or CPI that you might later trade using structured news strategies such as Smart Money Concepts in news-driven markets.
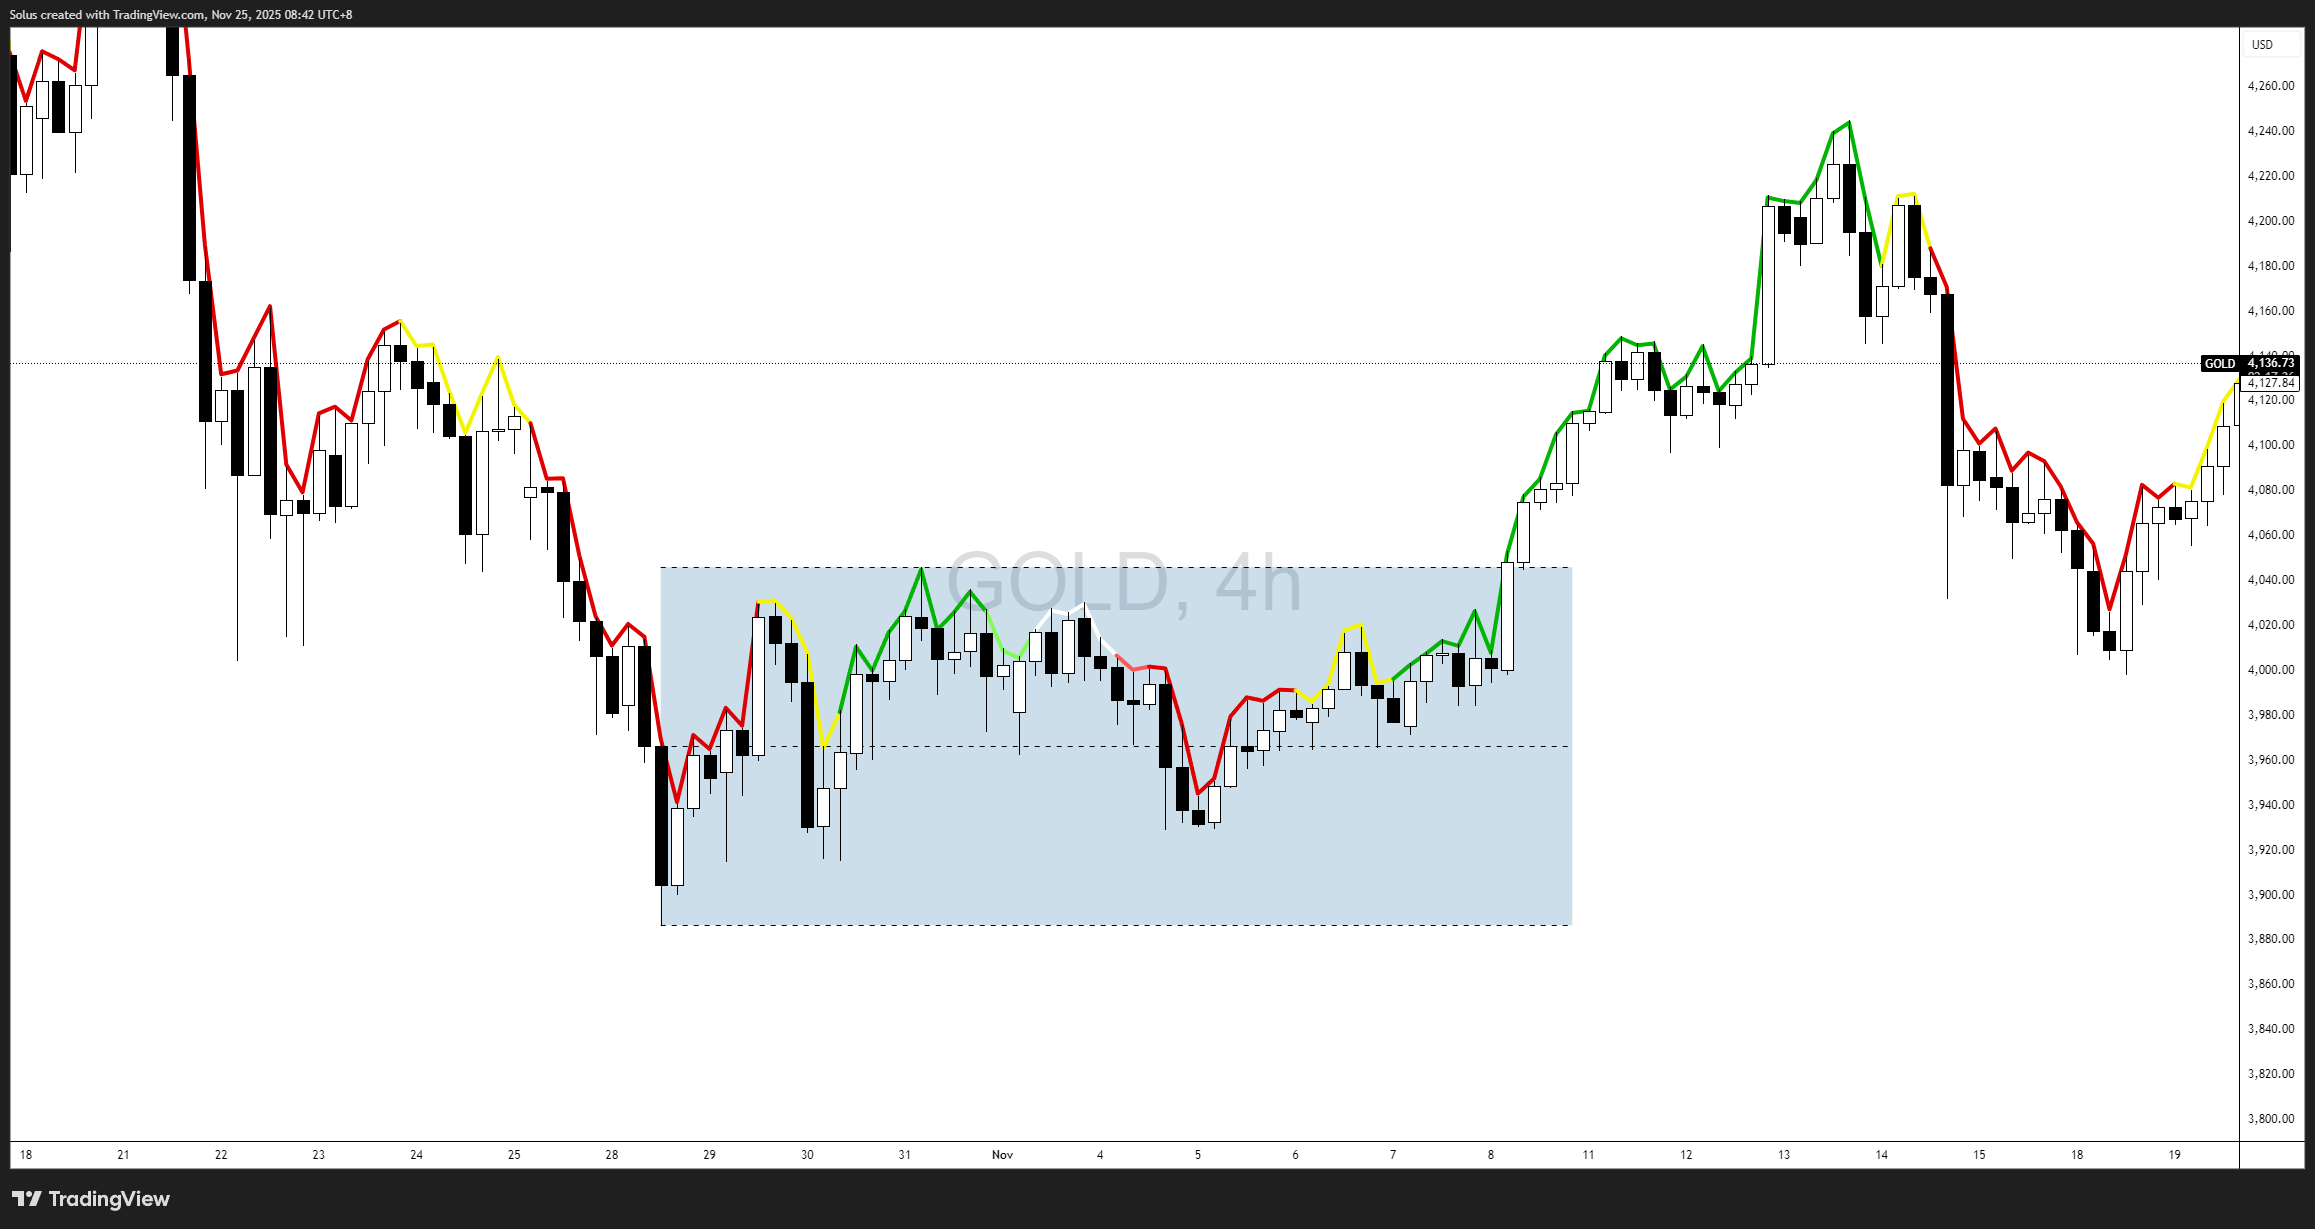
A range forms when neither buyers nor sellers have clear control. Price oscillates between support and resistance, building liquidity above and below the boundaries. Many traders swing trade these conditions, using principles similar to the ones outlined in The Market Basics for Swing Trading.
Characteristics:
If you can learn to identify a range early, you cut out a large portion of low-quality trades.
Swing highs and swing lows are the “bones” of market structure. They show you where the market rejected price and turned in the opposite direction. Learning to see these clearly will not only help you map trend, but also protect you from classic traps like stop hunting, which is explored more in Stop Hunting 101: How Swing Highs and Lows Become Liquidity Traps.
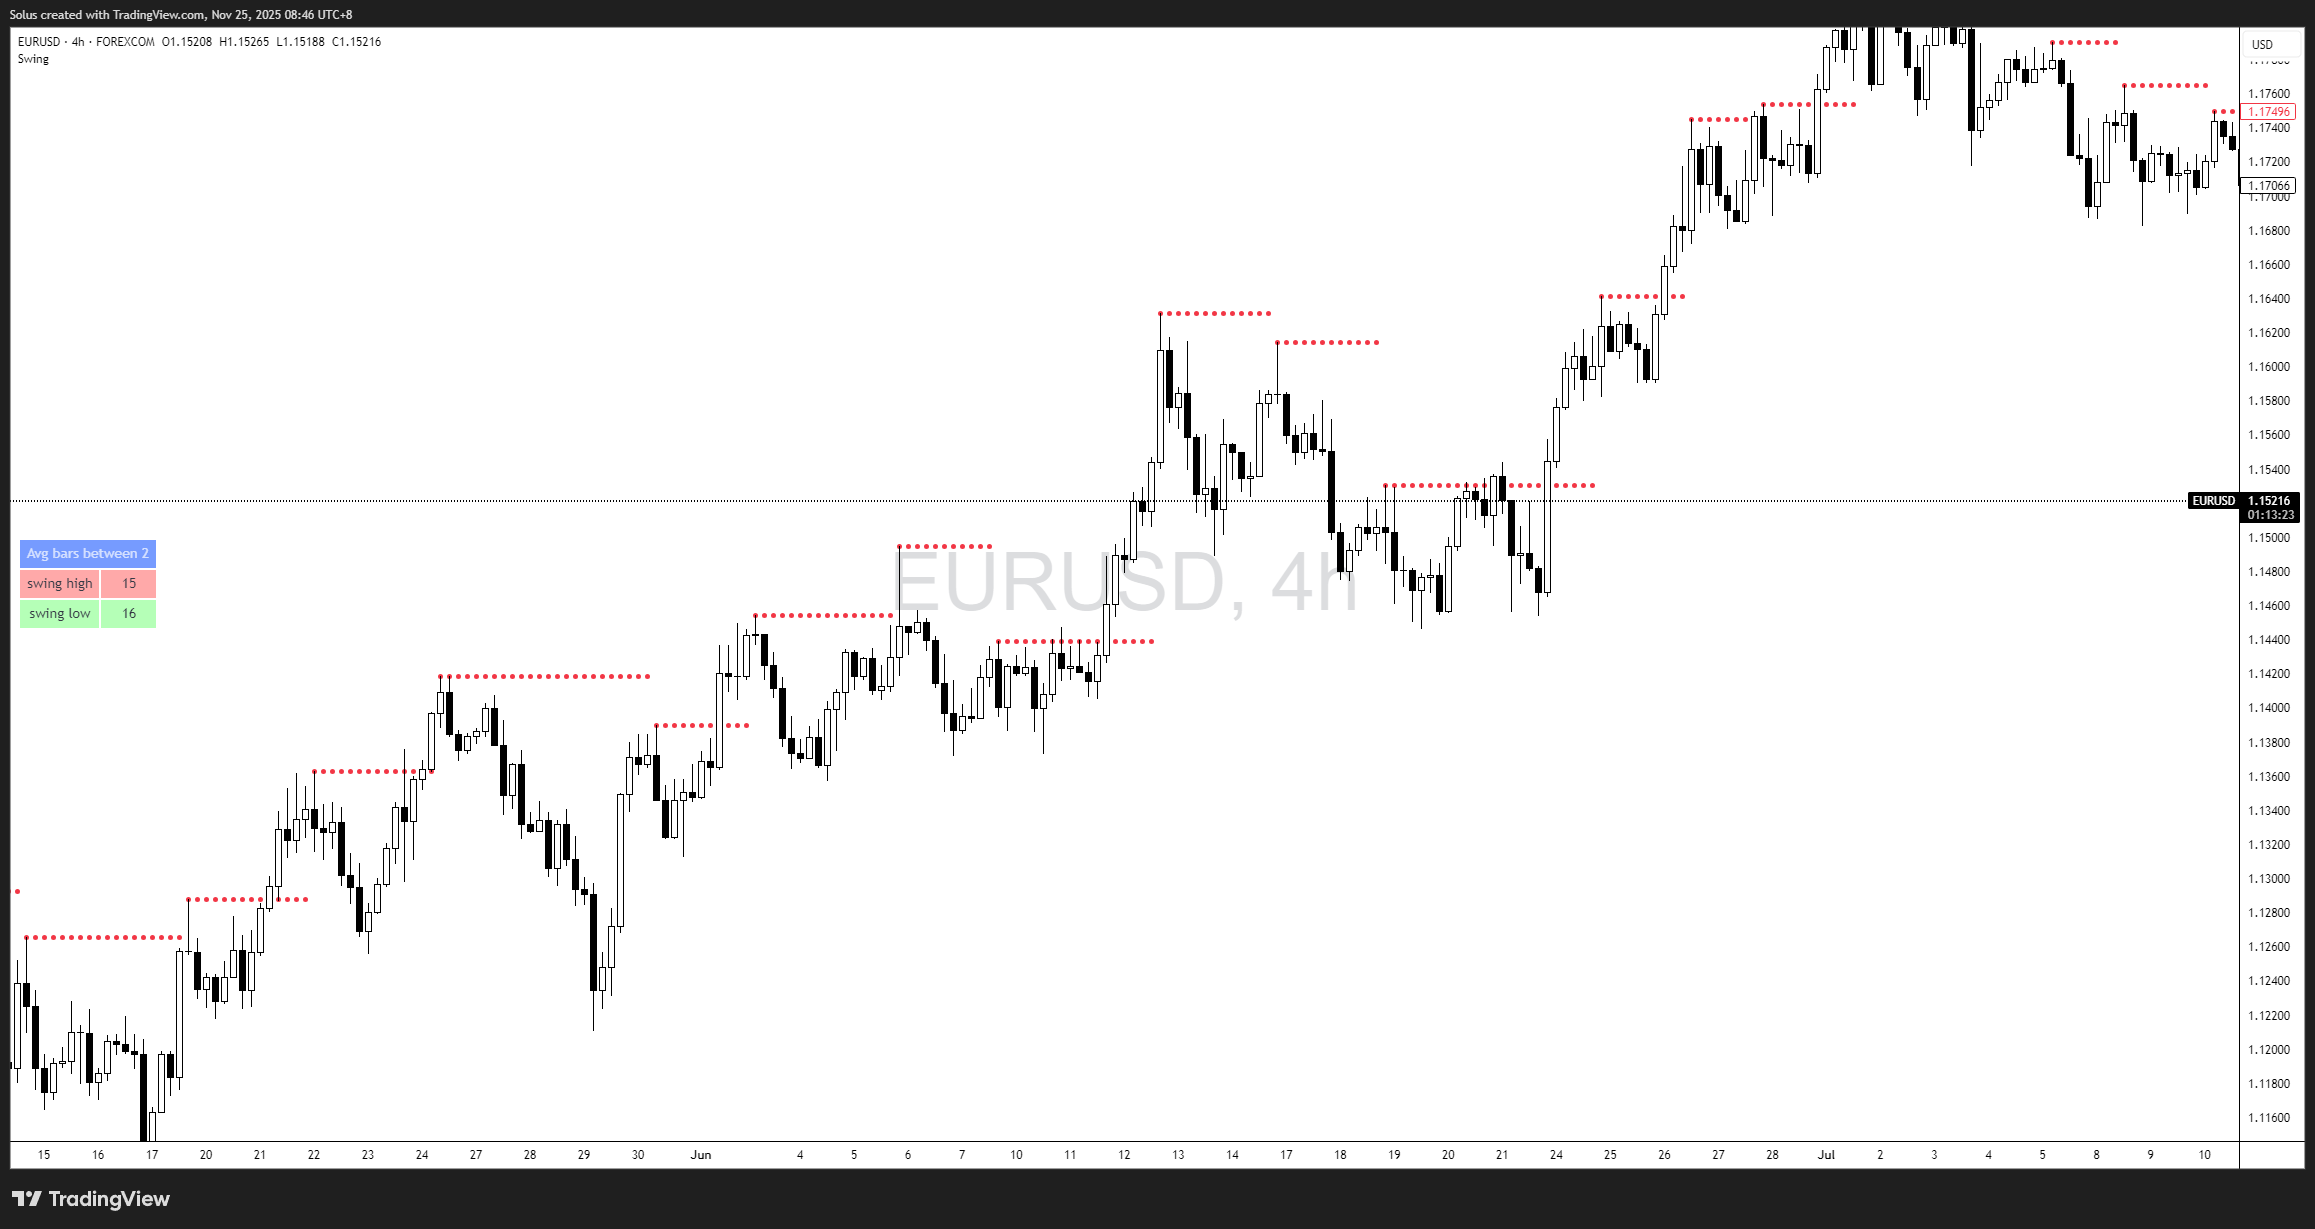
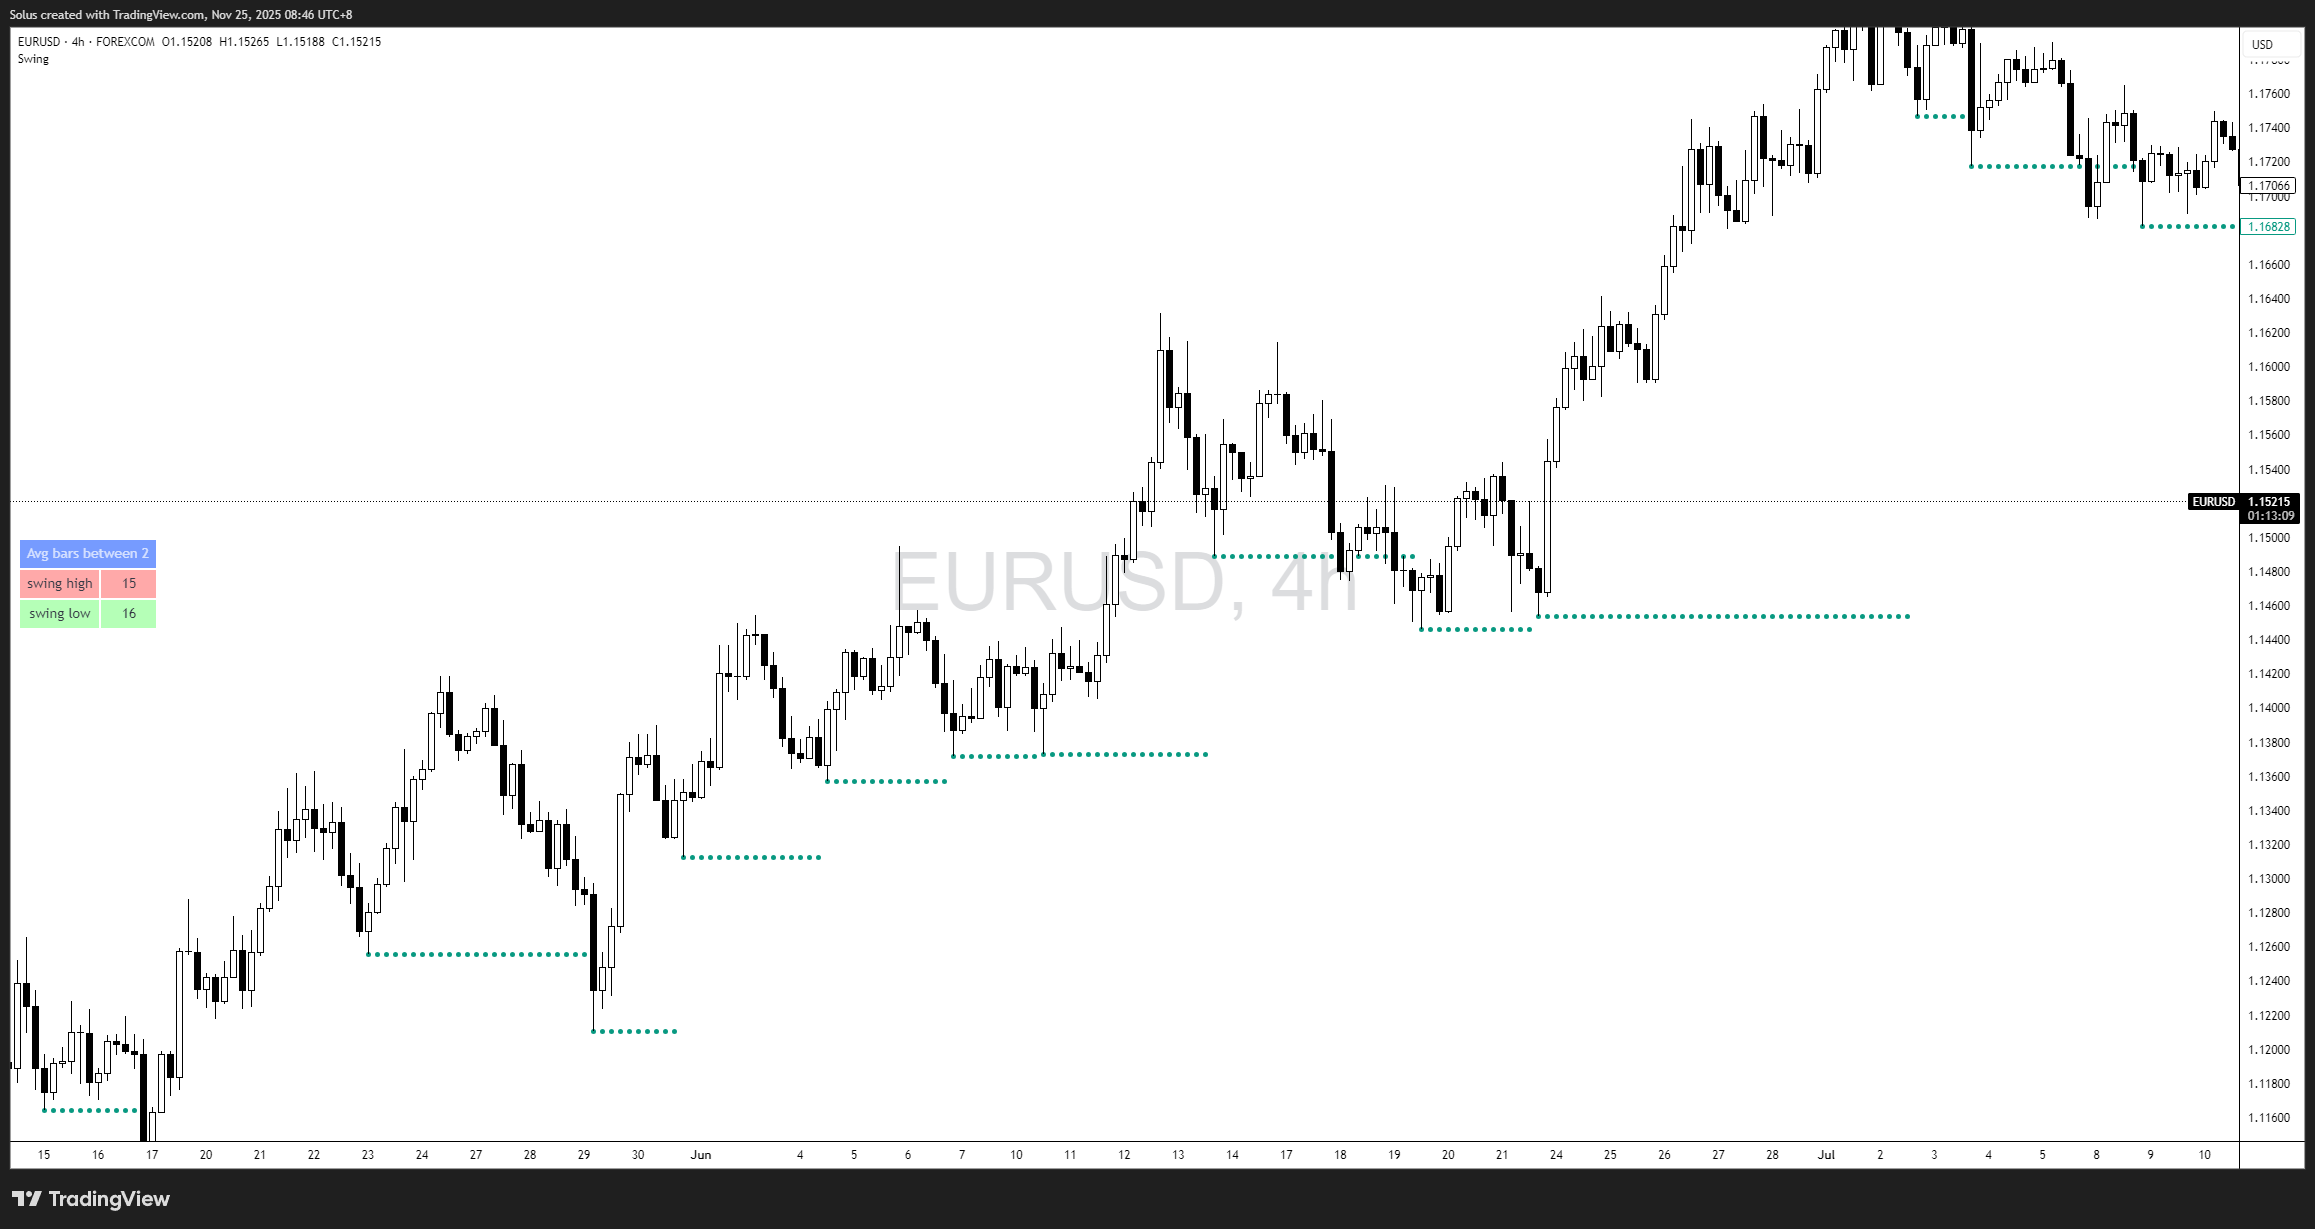
These points are not random.
They form the “stepping stones” the market uses to reveal trend direction.
Without swing points, you cannot identify a trend.
Without identifying a trend, you cannot read intent.
And without reading intent, you cannot anticipate what comes next.
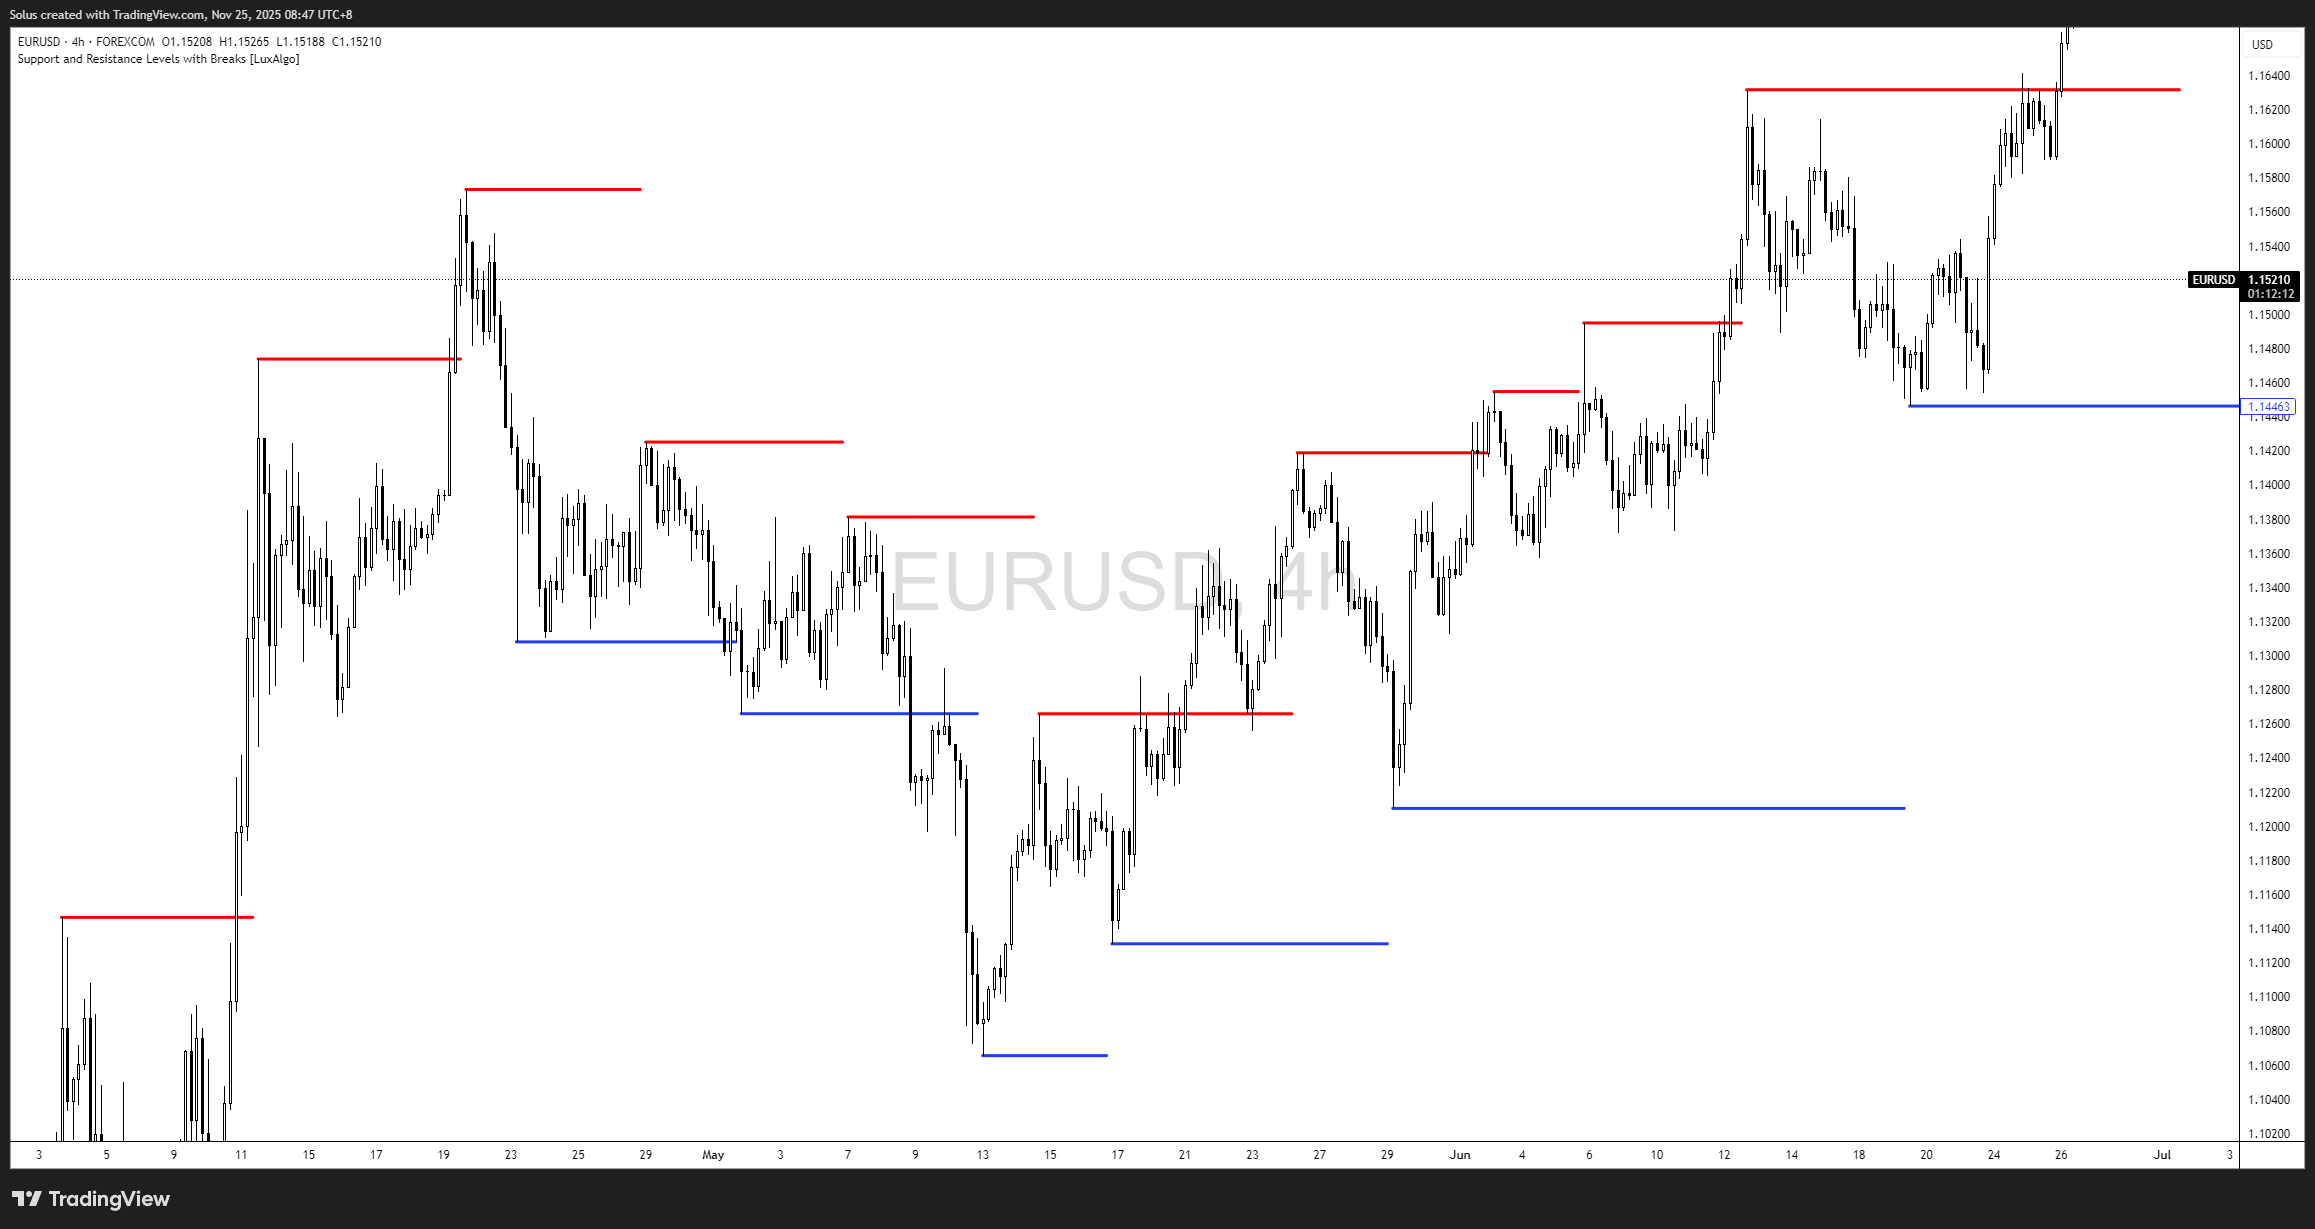
Support and resistance form naturally from swing highs and lows.
They are not magical zones. They are simply areas where buyers or sellers showed clear intent.
A level where downward movement stopped and buyers responded.
A level where upward movement stalled and sellers responded.
Most beginners complicate this by drawing countless levels.
Professionals do the opposite:
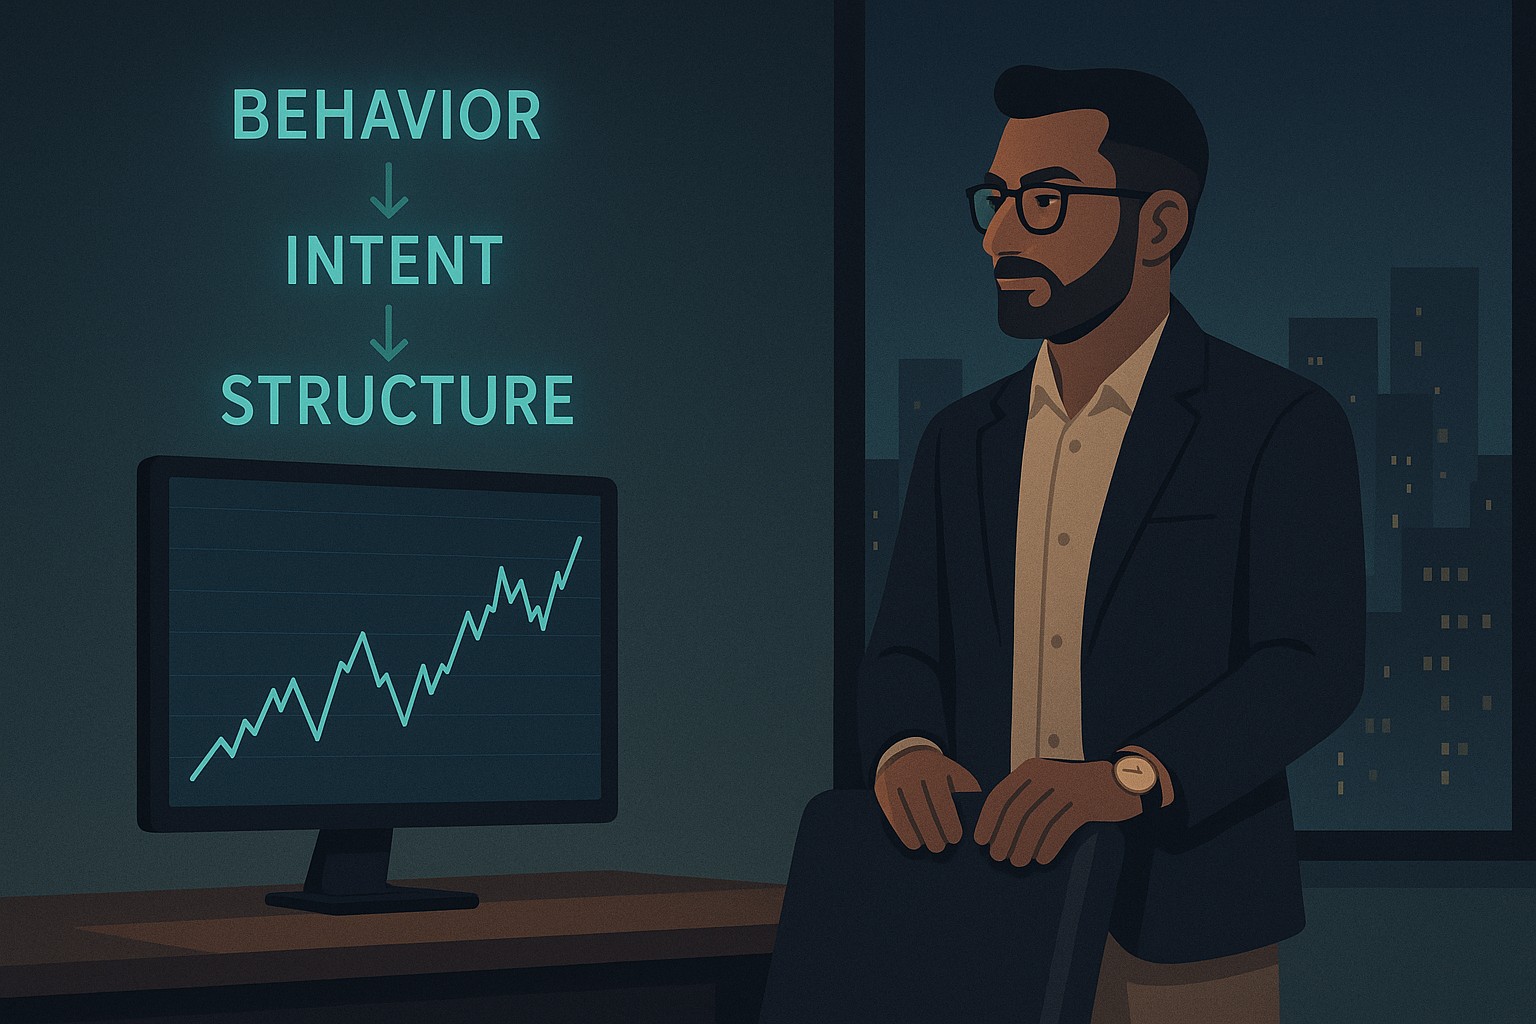
They draw fewer levels and read more behavior.
Because support and resistance are not about lines - they are about reactions.
You do not need a grid of lines. Professionals focus on the major reaction zones, then combine them with tools like confirmation entries or retest concepts, similar to what is taught in Mastering Retests: How to Enter with Confirmation After a Breakout.
Market intent is the heartbeat of price action.
Trend tells you where price is heading.
Intent tells you why it’s heading there - and whether it will continue.
Intent is visible through:
Here’s how to read intent:
Intent is what separates noise from information.
Price can move in a direction, but intent decides if the move has conviction.
As you refine this, you start thinking more like a discretionary price action trader in the spirit of How to Think Like a Price Action Trader.
Professional traders often remove everything from the chart except price.
Why?
Because raw price movement tells you more than any indicator ever will.
Use this 5-step method:
Identify the dominant direction.
You cannot judge a trend from a single candle.
This is best by looking at higher timeframes like Daily and Weekly.

These guide your interpretation of trend strength.
Is it trending or ranging?
Shallow pullbacks = strong trend
Deep pullbacks = weakening trend
Study how price reacts at major levels and whether it moves with conviction.
This is how traders build a clean, noise-free understanding of the market.
More Insights to Strengthen Your Foundation
Let’s go even deeper - these insights separate beginners from those who truly understand structure.
Think of the market like breathing.
The market breathes: expansion, then contraction. It surges, then rests. It trends, then ranges. Swing traders who understand this rhythm can position better during cycles, as outlined in Core Principles of Swing Trading.
It expands, then contracts.
Pushes, then pulls.
Impulses, then corrections.
If you focus too much on the impulse, you panic.
If you focus too much on the correction, you hesitate.
If you understand both, you see flow.
The market is always alternating between strength and weakness.
Your job is not to predict - your job is to observe the rhythm.
Trends don’t reverse out of nowhere.
There are always signs:
Structure weakens before trend shifts.
If you read these early, you avoid overstaying in fading trends and align with new ones earlier. This idea connects well with the way institutional traders think about accumulation and distribution, as described in Accumulation, Manipulation, Distribution: The Hidden Cycle That Runs Every Market.
Structure can look bullish on one timeframe and corrective on another. For example, a downtrend on the 5 minute chart might be a simple pullback on the 1 hour. What matters is how you stack perspectives.
When you start reading structure using multiple timeframes together, tools like The Power of Multi-Timeframe Analysis in Smart Money Concepts give you an even clearer roadmap for aligning your bias and execution.
All timeframes tell the same story at different speeds. Your job is to sync them.
No matter your style:
Every strategy relies on:
All rooted in structure.
Everything is built on trends, pullbacks, reversals, and breaks in structure. That is why understanding structure pairs naturally with building your own edge, as later explored in Trading Edge: Definition, Misconceptions and Casino Analogy.
Without structure, you’re guessing.
With structure, you’re reading.
Market structure is like reading someone’s body language.
You don’t need them to say a word - their posture, tone, and behavior reveal everything.
The market is the same:
If you pay attention, the market is constantly communicating.
The more time you spend observing, the more obvious it becomes when the market is confident, tired, undecided, or preparing for a move. As your awareness sharpens, you start to trade in a more focused and detached way, similar to the mindset in The Zen of Trading: Becoming the Observer, Not the Reactor.
Understanding market structure is the first moment trading stops feeling like gambling and starts feeling like skill. You’re no longer reacting to random candles - you’re reading behavior, intention, and rhythm.
You stop asking, “Where do I buy or sell?”
You start asking, “What is the market trying to do?”
That shift alone is what transforms uncertainty into clarity.
It builds confidence.
It reduces hesitation.
It makes your trading decisions intentional rather than emotional.
Market structure doesn’t promise perfection - it promises understanding.
And understanding is the foundation of every consistent trader.
If you master this, everything coming next-entries, confirmation models, risk execution, trend shifts-will feel simpler, cleaner, and more intuitive.
It’s time to go from theory to execution!
Create an Account. Start Your Live Trading Now!
Looking for step-by-step approaches you can plug straight into the charts? Start here:
Sharpen your edge with proven tools and frameworks:
News moves markets fast. Learn how to keep pace with SMC-based playbooks:
From NASDAQ opens to DAX trends, here’s how to approach indices like a pro:
Gold remains one of the most traded assets - here’s how to approach it with confidence:
Candlesticks are the building blocks of price action. Master the most powerful ones:
Ready to go intraday? Here’s how to build consistency step by step:
Markets swing between calm and chaos. Learn to read risk-on vs risk-off like a pro:
Step inside the playbook of institutional traders with SMC concepts explained:
Forex pairs aren’t created equal - some are stable, some are volatile, others tied to commodities or sessions.
If you’ve ever been stopped out right before the market reverses - this is why:
Mindset is the deciding factor between growth and blowups. Explore these essentials:
The real edge in trading isn’t strategy - it’s how you protect your capital:
If you’re not sure where to start, follow this roadmap:
This way, you’ll grow from foundation → application → mastery, instead of jumping around randomly.
Follow me for more daily market insights!
Jasper Osita - LinkedIn - FXStreet - YouTube
This content may have been written by a third party. ACY makes no representation or warranty and assumes no liability as to the accuracy or completeness of the information provided, nor any loss arising from any investment based on a recommendation, forecast or other information supplies by any third-party. This content is information only, and does not constitute financial, investment or other advice on which you can rely.
ACY Securities is one of Australia's fastest growing multi-asset online trading providers, offering ultra-low-cost trading, rock-solid execution, technologically superior account management and premium market analysis.
Select the categories and companies you wish to follow directly to your person rss feed.
Create Custom RSS FeedSign up and join over 5,000 professional members who receive personalized news alerts, curated professional connections, and more for free!
Sterling steadies after political uncertainty rattled gilt markets, while EUR/USD and EUR/GBP approach key technical levels ahead of today's European session.
GBP/AUD remains trapped in a well-defined bearish trend on both the weekly and daily timeframes.
Discover the key drivers, technical levels, and central bank expectations shaping the EUR/USD trend as the ECB prepares to hold rates and markets watch for a potential breakout.
Sydney-based multi-asset broker ACY Securities has introduced PAXGUSD, a new CFD instrument that allows clients to trade tokenised gold against the US Dollar 24 hours a day, seven days a week. The instrument is available across MetaTrader 4, MetaTrader 5, and the ACY Trading Platform.
Binance has lowered its VIP 3 Wallet Assets threshold from $3 million to $1 million and will now count OTC Spot Trading Volume at a 4x multiplier toward VIP qualification, removing the previous VIP 4 cap and allowing eligible users to progress through the full tier framework up to VIP 9.
Retail futures trading leader NinjaTrader Group has appointed Mark Omens as Senior Vice President, Commercial Strategy, bringing a 25-year veteran of derivatives marketplace CME Group into a newly created role focused on exchange partnerships and enterprise growth.
Gold Price Action Forecast: Will XAU/USD Drop to $3930? Meta Description: Read our Gold price action forecast to see if XAU/USD will drop to $3930.
BitDelta Securities Financial Services LLC (“BitDelta Securities”) today announced that it has received full regulatory approval from the Capital Market Authority (“CMA”) of the United Arab Emirates under the Category 5 — Arrangement and Advice license framework (License No. 20200000439). The approval follows the firm's receipt of In-Principal Approval earlier this year and represents the successful conclusion of the CMA's full licensing process, including the satisfaction of capital requirements, governance appointments, and operational setup.
Crypto.com has received a $400 million strategic investment from Citadel Securities, valuing the firm at $20 billion. It marks the first institutional funding round in the company's history, aimed at accelerating its expansion into tokenised securities, derivatives and other asset classes.
WTI’s pullback into $79–82 is the first major test of the bullish Elliott Wave count, with buyers targeting a renewed break above $85.