just now

Liquidity Finder Ltd is incorporated in England and Wales, company number 10610740, registered address 167-169 Great Portland Street, Fifth Floor, London W1W 5PF, United Kingdom.
Published: just now


Since the start of May, U.S. stock markets have climbed steadily, with the Dow Jones (US30) printing fresh yearly highs and both the Nasdaq 100 and S&P 500 marching toward key resistance zones. While inflation data gave bulls something to cheer, the rally was tested by a major headline: Moody’s downgraded the U.S. credit outlook, citing deepening fiscal imbalances.
Still, the market barely flinched. Earnings have been firm, the Fed remains neutral, and market fears are subdued. For now, the uptrend remains intact — but risks are still on the table.
Inflation in April cooled modestly, giving traders a reason to extend risk exposure. However, core CPI remains stuck at 2.8% YoY, signaling that underlying pressures still linger. The real surprise came from the Producer Price Index (PPI), which fell sharply — a possible early signal of future disinflation.
| Indicator | Actual | Forecast | Previous |
|---|---|---|---|
| Core CPI YoY | 2.8% | 2.8% | 2.8% |
| Headline CPI YoY | 2.3% | 2.4% | 2.4% |
| Core CPI MoM | +0.2% | +0.3% | +0.1% |
| Headline CPI MoM | +0.2% | +0.3% | -0.1% |
| PPI MoM | -0.5% | +0.2% | 0.0% |
The inflation trend is moving in the right direction, but not fast enough for the Fed to act — giving the market breathing room, not a full green light.
The Fed is staying on the sidelines, even as the data slowly improves. Powell emphasized caution, and other officials echoed the "not there yet" stance. Markets interpreted this as a soft backstop: no hike risk, no cut promise.
The Fed remains a stabilizing force — not bullish, not bearish, and that’s exactly what this market wants.
Moody’s cut its outlook on U.S. sovereign credit, warning of rising debt-to-GDP and the inability of lawmakers to manage long-term deficits. The downgrade was flagged by some as a "slow-moving crisis" — but equities didn't blink.
Market Impact:
Moody’s downgrade is a structural concern — not a trigger. But it adds weight to future volatility risk if inflation flares back up.
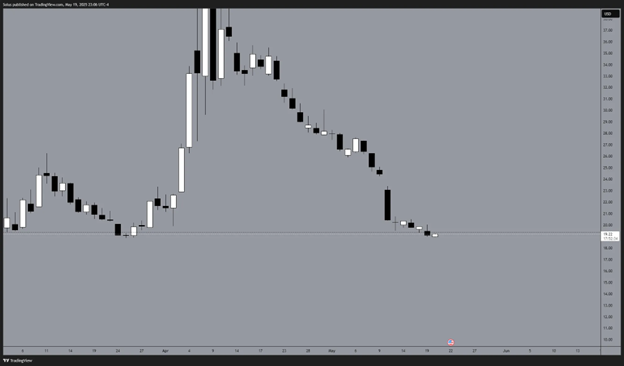
Despite Moody’s downgrade and sticky inflation, the VIX volatility index has stayed quiet and now trading below the 20 levels, allowing a risk-on sentiment on the U.S. market. Complacency or confidence? Either way, it's fueling low-stress breakouts across major indices.
As fears dissipates, confidence steps in, traders and investors, even institutions, are seeing this as an upside opportunity.
For forecast reference, check out my previous forecast:
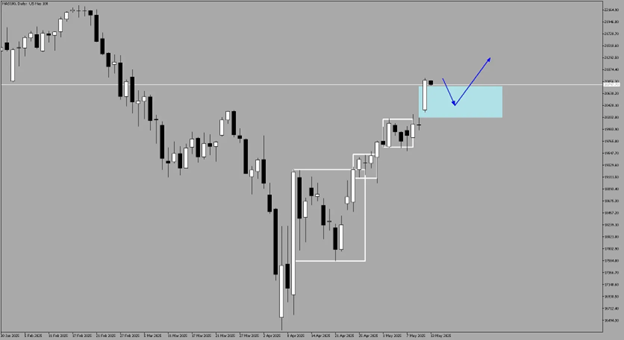
Dow Jones (US30)
Previous
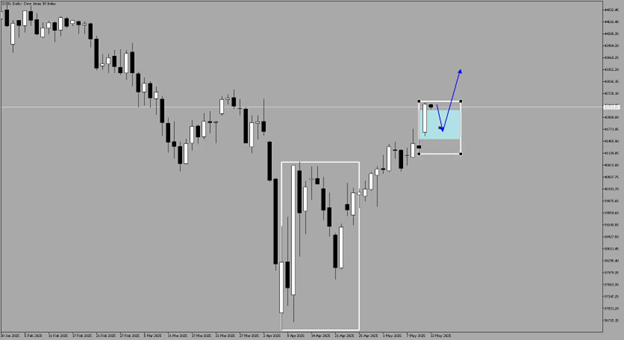
Current
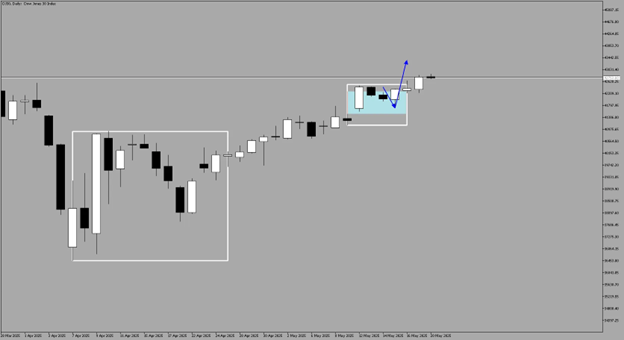
After hitting the Fair Value Gap on the daily, Dow Jones is still trending nicely and creating new highs.
Upside is still intact unless we a structure shift, taking out the immediate lows and creating lower highs for bearish scenario.
Previous
Current
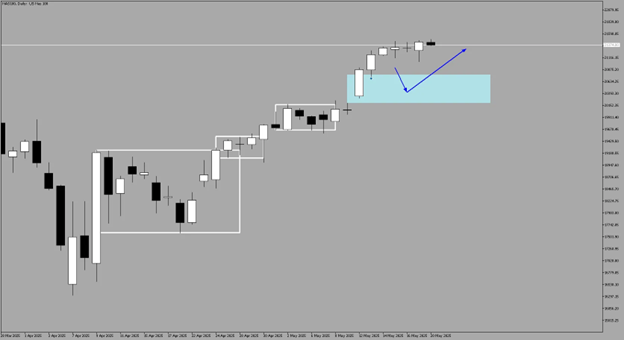
Compared to Dow Jones, Nasdaq has a stronger momentum with no signs of slowing down, yet. If Nasdaq pulls back, we could see a potential upside reaction at the Daily FVG resting at 20197.50 - 20766.90 level.
Unless new lows have been formed, with an obvious formation of a swing low, Nasdaq will continue to strengthen to the upside.
Previous
Current

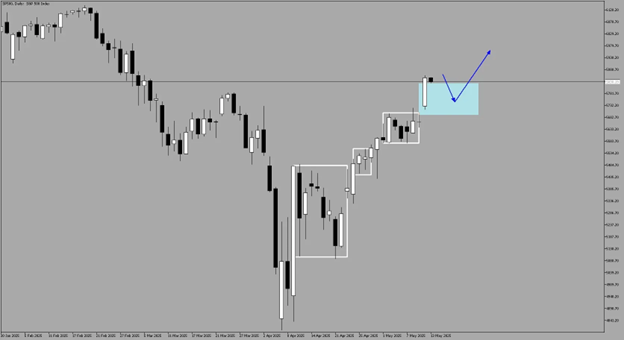
Same momentum also exhibits on S&P as it continues to trend to the upside.
Bullish FVG is still intact giving us more upside ahead. Unless broken down or invalidated, we’d like to see more highs on the horizon.

“It’s not whether you’re right or wrong that’s important, but how much money you make when you’re right and how much you lose when you’re wrong.”
—
George Soros
This is a market still willing to climb the wall of worry — but it’s walking a thinner line. Inflation may be easing, but core remains sticky. Moody’s downgrade didn’t break the trend, but it has cast a shadow over long-term credibility. The charts still favor bulls — but only if the fundamentals don't betray them first.
Stay nimble. Ride strength. Respect reversals.
Check Out Our Market Education
How to Start Day Trading:
5 Steps to Start Day Trading: A Strategic Guide for Beginners
8 Steps How to Start Forex Day Trading in 2025: A Beginner’s Step-by-Step Guide
3 Steps to Build a Trading Routine for Consistency and Discipline - Day Trading Edition
Learn how to navigate yourself in times of turmoil:
How to Identify Risk-On and Risk-Off Market Sentiment: A Complete Trader’s Guide
How to Trade Risk-On and Risk-Off Sentiment — With Technical Confirmation
The Ultimate Guide to Understanding Market Trends and Price Action
Want to learn how to trade like the Smart Money?
Mastering the Market with Smart Money Concepts: 5 Strategic Approaches
Mastering Candlestick Pattern Analysis with the SMC Strategy for Day Trading
Understanding Liquidity Sweep: How Smart Money Trades Liquidity Zones in Forex, Gold, US Indices
The SMC Playbook Series Part 4: How to Confirm Trend Reversal & Direction using SMC
The SMC Playbook Series Part 5: The Power of Multi-Timeframe Analysis in Smart Money Concepts (SMC)
Trading Psychology and Continuous Improvement Contents:
The Mental Game of Execution - Debunking the Common Trading Psychology
5 Steps to Backtest a Trading Strategy with AI: A Step-by-Step Guide
Managing Trading Losses: Why You Can Be Wrong and Still Win Big in Trading
Follow me on LinkedIn: Jasper Osita
Join me in Discord: The Analyst Guild
This content may have been written by a third party. ACY makes no representation or warranty and assumes no liability as to the accuracy or completeness of the information provided, nor any loss arising from any investment based on a recommendation, forecast or other information supplies by any third-party. This content is information only, and does not constitute financial, investment or other advice on which you can rely.
ACY Securities is one of Australia's fastest growing multi-asset online trading providers, offering ultra-low-cost trading, rock-solid execution, technologically superior account management and premium market analysis.
Select the categories and companies you wish to follow directly to your person rss feed.
Create Custom RSS Feed
just now
Sign up and join over 5,000 professional members who receive personalized news alerts, curated professional connections, and more for free!
Sterling steadies after political uncertainty rattled gilt markets, while EUR/USD and EUR/GBP approach key technical levels ahead of today's European session.
GBP/AUD remains trapped in a well-defined bearish trend on both the weekly and daily timeframes.
Discover the key drivers, technical levels, and central bank expectations shaping the EUR/USD trend as the ECB prepares to hold rates and markets watch for a potential breakout.
Sydney-based multi-asset broker ACY Securities has introduced PAXGUSD, a new CFD instrument that allows clients to trade tokenised gold against the US Dollar 24 hours a day, seven days a week. The instrument is available across MetaTrader 4, MetaTrader 5, and the ACY Trading Platform.
Binance has lowered its VIP 3 Wallet Assets threshold from $3 million to $1 million and will now count OTC Spot Trading Volume at a 4x multiplier toward VIP qualification, removing the previous VIP 4 cap and allowing eligible users to progress through the full tier framework up to VIP 9.
Retail futures trading leader NinjaTrader Group has appointed Mark Omens as Senior Vice President, Commercial Strategy, bringing a 25-year veteran of derivatives marketplace CME Group into a newly created role focused on exchange partnerships and enterprise growth.
Gold Price Action Forecast: Will XAU/USD Drop to $3930? Meta Description: Read our Gold price action forecast to see if XAU/USD will drop to $3930.
BitDelta Securities Financial Services LLC (“BitDelta Securities”) today announced that it has received full regulatory approval from the Capital Market Authority (“CMA”) of the United Arab Emirates under the Category 5 — Arrangement and Advice license framework (License No. 20200000439). The approval follows the firm's receipt of In-Principal Approval earlier this year and represents the successful conclusion of the CMA's full licensing process, including the satisfaction of capital requirements, governance appointments, and operational setup.
Crypto.com has received a $400 million strategic investment from Citadel Securities, valuing the firm at $20 billion. It marks the first institutional funding round in the company's history, aimed at accelerating its expansion into tokenised securities, derivatives and other asset classes.
WTI’s pullback into $79–82 is the first major test of the bullish Elliott Wave count, with buyers targeting a renewed break above $85.