just now

Liquidity Finder Ltd is incorporated in England and Wales, company number 10610740, registered address 167-169 Great Portland Street, Fifth Floor, London W1W 5PF, United Kingdom.
Published: just now


Overview
The recent downturn in major U.S. stock indices—namely the Dow Jones Industrial Average (US30), Nasdaq Composite (US100), and S&P 500 (US500)—can be attributed to a confluence of economic data and geopolitical factors that have unsettled investor confidence.
Key Factors Contributing to the Decline:
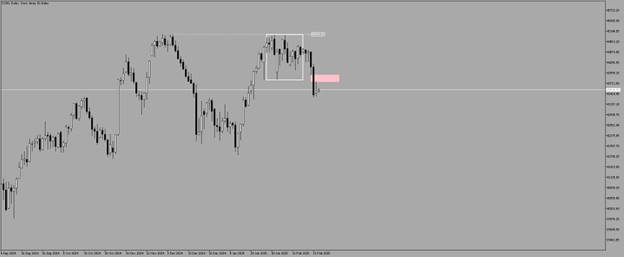
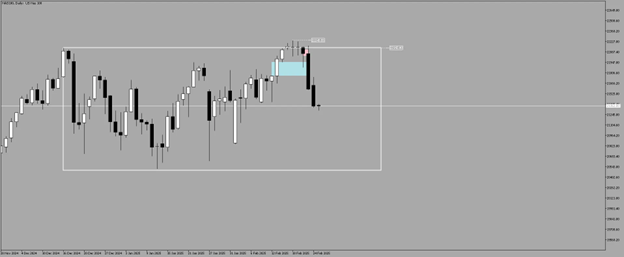
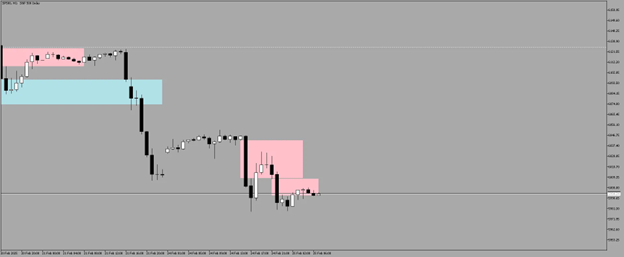
After an extended period of consolidation, the Dow Jones (US30) failed to hold its ground, breaking decisively below support. The bearish volume imbalance suggests sellers are in control, with resistance at 45,068.05 remaining intact unless price revisits and breaks through this level.
On the 4-hour timeframe, bearish momentum is evident, with long red candles dominating the chart. There are no clear signs of a market structure shift or potential reversal to the upside.
If price forms a reversal pattern within the Daily Fair Value Gap (FVG), a continued move lower could unfold. As long as price fails to break and hold above this level, short positions remain valid.
Failed All-Time High Breakout
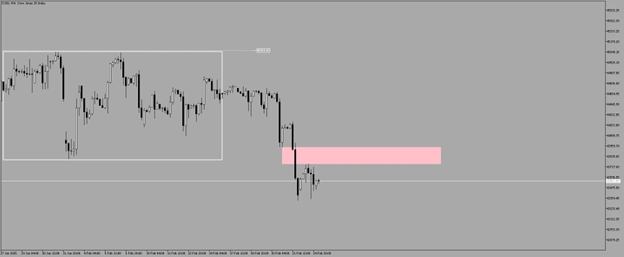
The Nasdaq (US100) attempted an all-time high breakout but failed to sustain momentum, leading to a sharp rejection.
Massive Sell-Off at Market Open
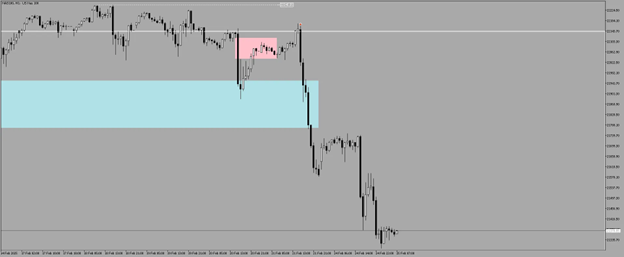
Right at the New York open, Nasdaq saw a sharp sell-off, dragging price back inside the range. Currently, price is testing the equilibrium level, an important decision point for further movement.
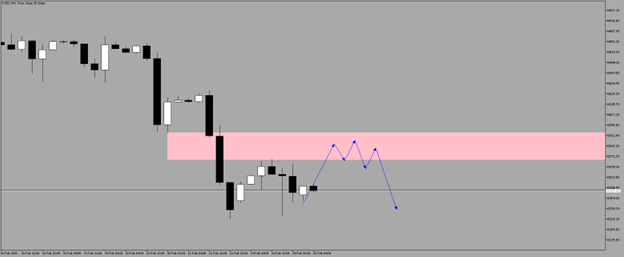
4-Hour Fair Value Gap: Break or Reversal?
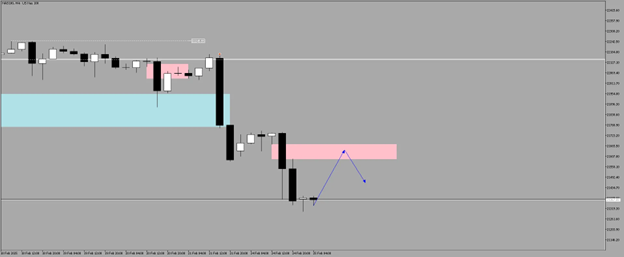
Two scenarios could unfold at this 4-hour FVG:
For now, momentum remains slow as Nasdaq consolidates.
Trading Below Equilibrium, No Strength Yet
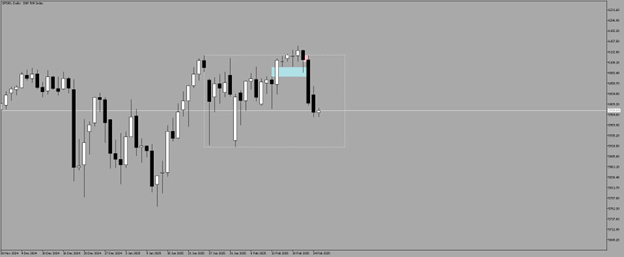
The S&P 500 (US500) also failed to hold its all-time high level, pushing price below equilibrium. If buyers do not step in, the next key level to watch is 5,907.
Momentum remains weak, and further downside is possible. Short setups could emerge within the H1 Fair Value Gaps, targeting 5,907 if no reversal structure appears.
All three major U.S. indices are showing bearish pressure, failing to hold key resistance levels. Traders should watch for:
✔ Key resistance retests (potential rejections for continuation)
✔ Fair Value Gaps (for potential short setups)
✔ Any signs of bullish structure shifts (to invalidate downside momentum)
With economic uncertainty and technical breakdowns aligning, short opportunities remain favorable until proven otherwise.
This content may have been written by a third party. ACY makes no representation or warranty and assumes no liability as to the accuracy or completeness of the information provided, nor any loss arising from any investment based on a recommendation, forecast or other information supplies by any third-party. This content is information only, and does not constitute financial, investment or other advice on which you can rely.
ACY Securities is one of Australia's fastest growing multi-asset online trading providers, offering ultra-low-cost trading, rock-solid execution, technologically superior account management and premium market analysis.
Select the categories and companies you wish to follow directly to your person rss feed.
Create Custom RSS Feed
just now
Sign up and join over 5,000 professional members who receive personalized news alerts, curated professional connections, and more for free!
Retail futures trading leader NinjaTrader Group has appointed Mark Omens as Senior Vice President, Commercial Strategy, bringing a 25-year veteran of derivatives marketplace CME Group into a newly created role focused on exchange partnerships and enterprise growth.
Gold Price Action Forecast: Will XAU/USD Drop to $3930? Meta Description: Read our Gold price action forecast to see if XAU/USD will drop to $3930.
BitDelta Securities Financial Services LLC (“BitDelta Securities”) today announced that it has received full regulatory approval from the Capital Market Authority (“CMA”) of the United Arab Emirates under the Category 5 — Arrangement and Advice license framework (License No. 20200000439). The approval follows the firm's receipt of In-Principal Approval earlier this year and represents the successful conclusion of the CMA's full licensing process, including the satisfaction of capital requirements, governance appointments, and operational setup.
Crypto.com has received a $400 million strategic investment from Citadel Securities, valuing the firm at $20 billion. It marks the first institutional funding round in the company's history, aimed at accelerating its expansion into tokenised securities, derivatives and other asset classes.
WTI’s pullback into $79–82 is the first major test of the bullish Elliott Wave count, with buyers targeting a renewed break above $85.

BitDelta Securities has secured a full CMA Category 5 licence in the UAE and opened a regulated office in Business Bay, Dubai. The firm operates as an introducing broker, connecting investors with licensed international brokers across multiple asset classes, with CEO Dr. Demetrios Zamboglou commenting on the milestone.
Index volatility is asleep while single stocks fight it out underneath, credit refuses to confirm the equity rally, and a bare macro calendar hands next week to oil.
Digital assets and FX brokerage GC Exchange FZE (GCEX) has appointed Mohammed A. Mulla as a Board Member of its Dubai-based entity, part of the wider GCEX Group.
Learn what Blockchain-as-a-Service is, how it works, and why businesses are using BaaS to build blockchain applications without managing infrastructure.
CFDs vs stocks compared on leverage, ownership, costs, dividends, taxes, and risk. Learn the differences between stocks and CFDs and discover which suits your investing or trading goals.