just now

Liquidity Finder Ltd is incorporated in England and Wales, company number 10610740, registered address 167-169 Great Portland Street, Fifth Floor, London W1W 5PF, United Kingdom.
Published: just now


Overview
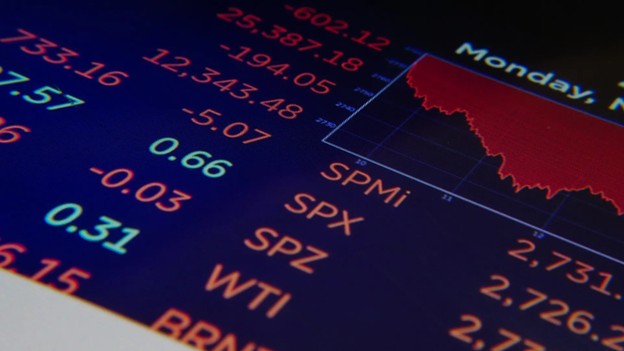
U.S. equity markets faced sharp declines this past week as global investors reacted to sweeping new tariffs announced by President Donald Trump. On April 2, 2025, the administration imposed a universal 10% tariff on all imports, with steeper rates targeting select countries. The decision aims to address long-standing trade imbalances but has quickly sparked financial turbulence and retaliatory responses.
Top Finance Leaders Warn of Recession Risks
Jamie Dimon, CEO of JPMorgan Chase: Raised concerns that prolonged tariff enforcement could reignite inflation and suppress economic growth, emphasizing the need for policy clarity and resolution.
Jim Cramer: Warned that these trade moves could set the stage for a market collapse comparable to Black Monday 1987, should investors lose confidence in the global economic outlook.
Bill Ackman, Hedge Fund Manager: Described the current climate as a potential “economic nuclear winter” and urged a 90-day pause on tariffs to avoid long-term damage to markets and consumers.
Economists are sounding the alarm on stagflation, the toxic mix of rising prices and slowing growth.
Core Inflation Rate MoM: Forecasted to Rise

Core inflation (MoM) is forecasted to rise, driven in part by the new 10% tariffs recently imposed by the Trump administration. As import costs climb, businesses are beginning to pass higher prices onto consumers, fueling underlying inflation.
This trend complicates the Federal Reserve’s path forward, as sticky inflation—now worsened by trade policy—could delay any rate cuts. Markets may face renewed volatility as tariffs amplify price pressures across sectors.
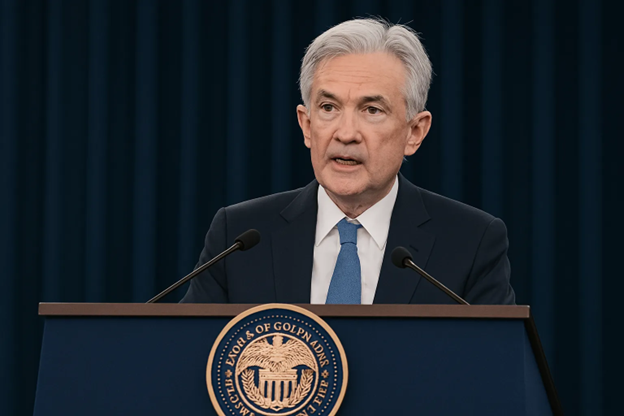
Federal Reserve Chair Jerome Powell acknowledged the larger-than-expected economic shock from the tariffs, stating they are likely to increase inflation and suppress growth. He emphasized the Fed’s goal of preventing temporary price hikes from becoming long-term inflation trends.
No Immediate Rate Cuts Despite Trump’s Pressure: Despite public pressure from President Trump for a rate cut, Powell reaffirmed the Fed's data-driven approach, stating the central bank will not move prematurely until more economic clarity is achieved.
Fed Calls Emergency Closed-Door Meeting: The Federal Reserve has convened a closed emergency session to assess the economic risks stemming from the trade policy shift. This internal review signals growing concern at the highest levels of monetary policy.
Producer Price Index (PPI) in Focus: Inflation Gauge Expected to Rise

Investors are closely watching the upcoming Producer Price Index (PPI) report for March 2025, scheduled for release on April 11. As a key measure of wholesale inflation, the PPI provides early insights into cost pressures facing manufacturers and suppliers, often foreshadowing future consumer price increases.
In short, the March PPI report won’t just be a data point—it’s a barometer for how deeply trade policy is starting to affect the supply side of the economy.
President Trump has doubled down on his decision, stating:
“I don’t want stock prices to fall, but sometimes you have to take medicine to fix something.”
His unwavering stance continues to divide economists and policymakers. Critics argue that prolonged trade tensions may trigger a recession, while supporters say the bold approach is necessary for long-term trade reform.
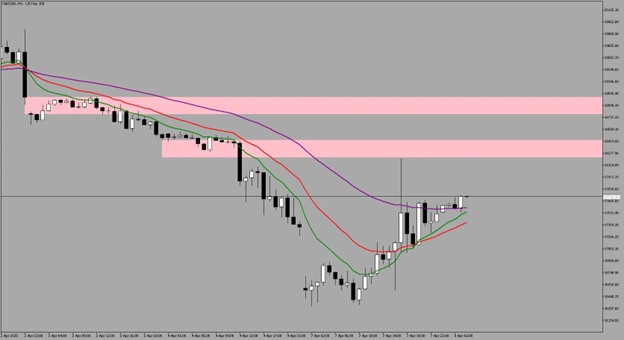
Dow
Daily
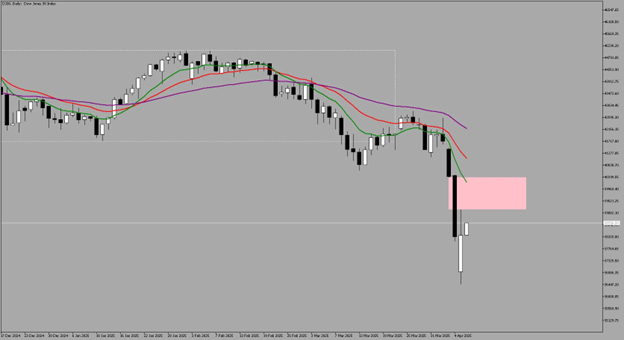
After three consecutive days of heavy downside following the global rollout of tariffs, the Dow finally caught a breather, closing near Monday’s candle close.
Price action may now be drawing liquidity into the 39,205.57 – 40,387.70 Fair Value Gap (FVG) zone, where we could anticipate a potential bearish reaction if supply steps in.
4-Hour
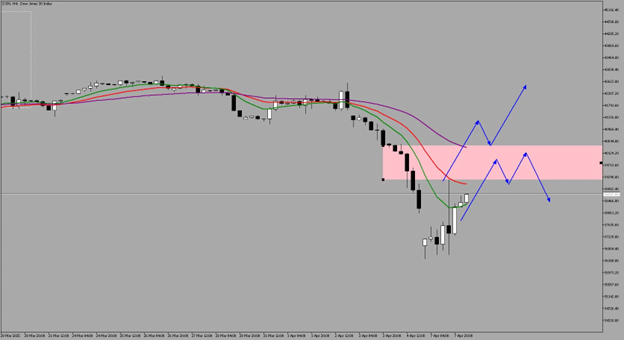
Potential Scenarios
NASDAQ

Since April 7, 2025, the top seven Nasdaq-listed companies—Apple (AAPL), Microsoft (MSFT), Amazon (AMZN), Alphabet (GOOGL), Meta Platforms (META), Tesla (TSLA), and NVIDIA (NVDA)—have experienced significant market volatility, primarily due to the recent imposition of global tariffs by the U.S. administration.
Apple (AAPL): The stock declined by 4.8% on April 7, nearing a one-year low. Analyst Dan Ives from Wedbush reduced Apple's price target from $325 to $250, citing the tariffs as a "complete disaster" for the company, given its reliance on Chinese assembly lines.
Tesla (TSLA): Shares fell by 7% on April 7. Ives also slashed Tesla's price target from $550 to $315, expressing concerns over the company's challenges in China and potential brand issues linked to CEO Elon Musk's political affiliations.
NVIDIA (NVDA): The stock experienced a 7.1% decline on April 7, reflecting broader concerns about the impact of tariffs on the semiconductor industry.
Microsoft (MSFT): The company faced a 10.1% decline in its stock price as of April 7, influenced by the overall market downturn and trade tensions.
Amazon (AMZN): The e-commerce giant's stock decreased by 13.3% as of April 7, amid concerns about increased costs due to tariffs and potential impacts on consumer spending.
Alphabet (GOOGL): Shares declined by 18.3% as of April 7, with the company facing additional pressures from ongoing antitrust actions by the Department of Justice.
Meta Platforms (META): Among the "Magnificent Seven," Meta has been the most resilient, with its stock price remaining relatively flat since the beginning of 2025.
These developments underscore the broader market's sensitivity to international trade policies and the potential for significant impacts on major technology companies.
Despite drawback from the 7, NASDAQ bounced and is currently rebounding to the upside.
Daily
At the start of the week, the Nasdaq opened with a sharp decline but managed to recover during the New York session.
4-Hour
Potential Scenarios
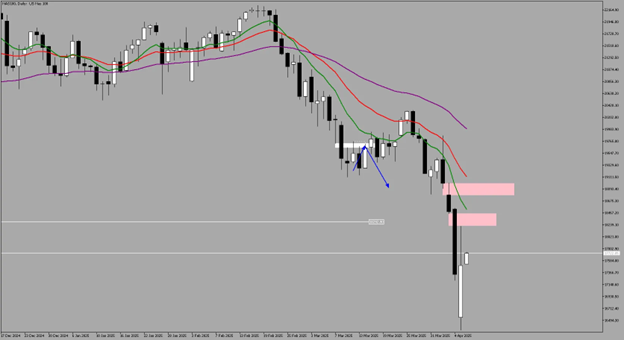
S&P
Daily
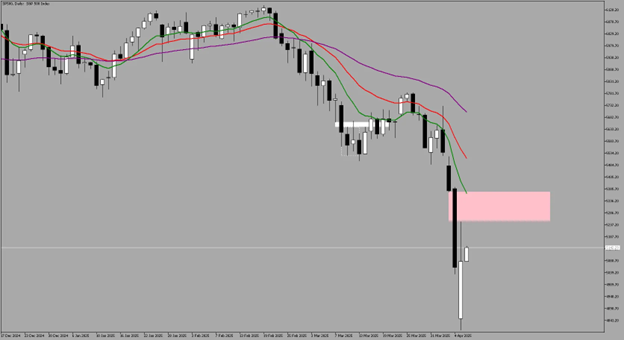
We are looking for a draw on liquidity at 5252.76 - 5372.79 level.
4-Hour
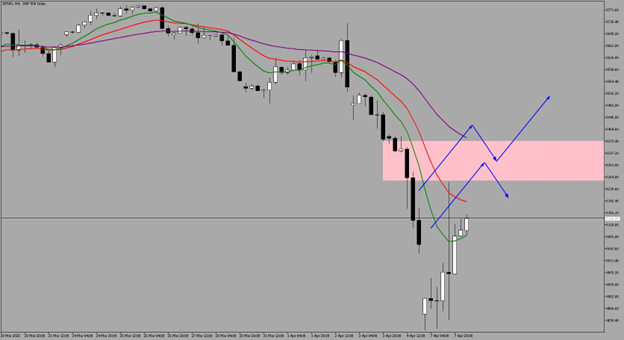
Potential Scenarios
This content may have been written by a third party. ACY makes no representation or warranty and assumes no liability as to the accuracy or completeness of the information provided, nor any loss arising from any investment based on a recommendation, forecast or other information supplies by any third-party. This content is information only, and does not constitute financial, investment or other advice on which you can rely.
ACY Securities is one of Australia's fastest growing multi-asset online trading providers, offering ultra-low-cost trading, rock-solid execution, technologically superior account management and premium market analysis.
Select the categories and companies you wish to follow directly to your person rss feed.
Create Custom RSS Feed
just now
Sign up and join over 5,000 professional members who receive personalized news alerts, curated professional connections, and more for free!
Retail futures trading leader NinjaTrader Group has appointed Mark Omens as Senior Vice President, Commercial Strategy, bringing a 25-year veteran of derivatives marketplace CME Group into a newly created role focused on exchange partnerships and enterprise growth.
Gold Price Action Forecast: Will XAU/USD Drop to $3930? Meta Description: Read our Gold price action forecast to see if XAU/USD will drop to $3930.
BitDelta Securities Financial Services LLC (“BitDelta Securities”) today announced that it has received full regulatory approval from the Capital Market Authority (“CMA”) of the United Arab Emirates under the Category 5 — Arrangement and Advice license framework (License No. 20200000439). The approval follows the firm's receipt of In-Principal Approval earlier this year and represents the successful conclusion of the CMA's full licensing process, including the satisfaction of capital requirements, governance appointments, and operational setup.
Crypto.com has received a $400 million strategic investment from Citadel Securities, valuing the firm at $20 billion. It marks the first institutional funding round in the company's history, aimed at accelerating its expansion into tokenised securities, derivatives and other asset classes.
WTI’s pullback into $79–82 is the first major test of the bullish Elliott Wave count, with buyers targeting a renewed break above $85.

BitDelta Securities has secured a full CMA Category 5 licence in the UAE and opened a regulated office in Business Bay, Dubai. The firm operates as an introducing broker, connecting investors with licensed international brokers across multiple asset classes, with CEO Dr. Demetrios Zamboglou commenting on the milestone.
Index volatility is asleep while single stocks fight it out underneath, credit refuses to confirm the equity rally, and a bare macro calendar hands next week to oil.
Digital assets and FX brokerage GC Exchange FZE (GCEX) has appointed Mohammed A. Mulla as a Board Member of its Dubai-based entity, part of the wider GCEX Group.
Learn what Blockchain-as-a-Service is, how it works, and why businesses are using BaaS to build blockchain applications without managing infrastructure.
CFDs vs stocks compared on leverage, ownership, costs, dividends, taxes, and risk. Learn the differences between stocks and CFDs and discover which suits your investing or trading goals.