just now

Liquidity Finder Ltd is incorporated in England and Wales, company number 10610740, registered address 167-169 Great Portland Street, Fifth Floor, London W1W 5PF, United Kingdom.
Published: just now


The U.S. dollar is at a technical and fundamental crossroads. While Treasury yields are firm, the greenback is losing ground as markets question U.S. fiscal health, inflation trajectory, and monetary policy resolve. With four high-impact events in focus—Durable Goods, GDP revision, FOMC minutes, and Core PCE—this week offers the catalyst for resolution.
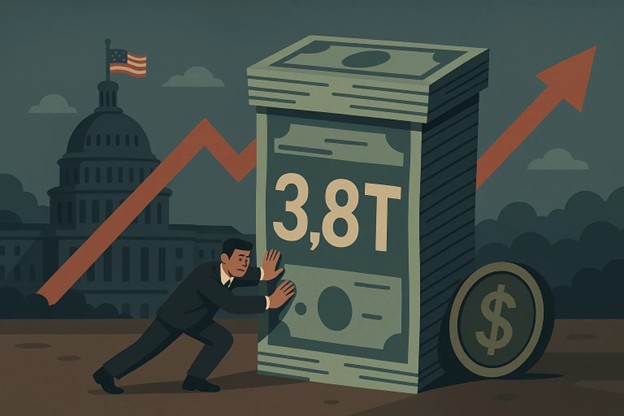
The House passed a massive tax-and-spend bill last week, igniting concerns over long-term U.S. fiscal sustainability.
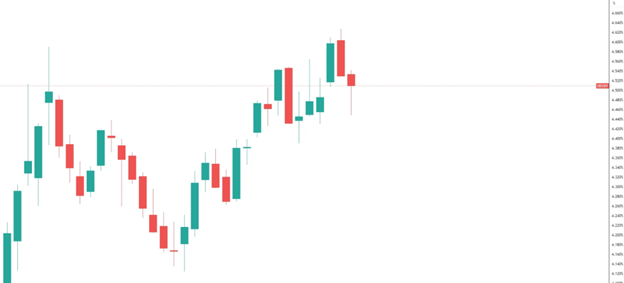
US10Y showing climb above 4.65% with annotations on spike dates. Despite rising yields, the dollar declined—suggesting the market now sees Treasury selling as a sign of risk, not growth.
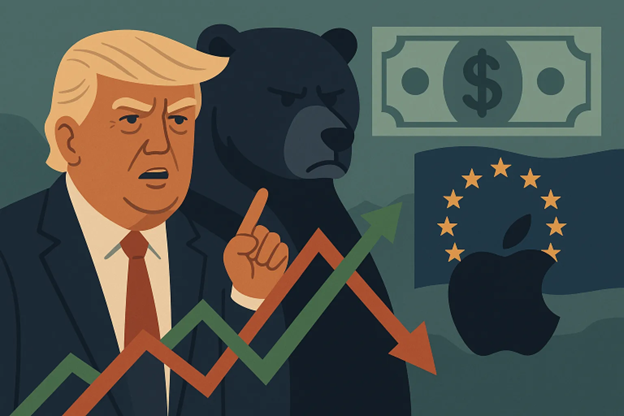
While Trump’s renewed tariff threats rattled sentiment, the USD didn’t benefit. Instead, global equities rallied on news that the EU tariff decision would be delayed until July. This shows risk-on positioning is outpacing safe-haven flows, even during geopolitical stress.
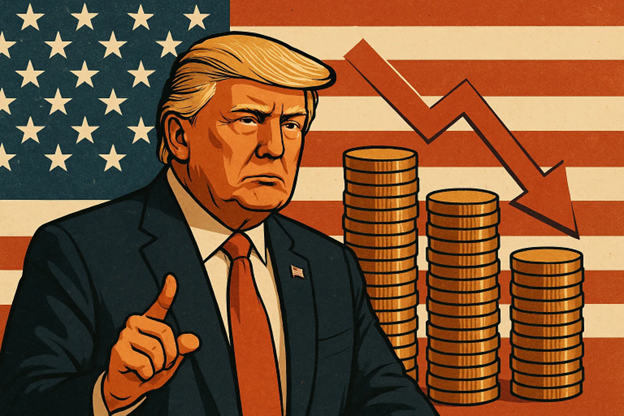
Trump has consistently argued that a strong dollar puts the U.S. at a disadvantage in global trade. During his presidency, he frequently criticized the Federal Reserve for raising interest rates and allowing the dollar to strengthen—stating in 2019 that the dollar was "too strong" and that it hurt U.S. exports. He publicly urged the Fed to lower interest rates and even suggested the U.S. should "match" other countries engaging in currency devaluation.
In the current campaign cycle, Trump continues to signal a protectionist and export-driven economic agenda. For that reason, markets may preemptively price in a policy bias toward a weaker dollar under renewed Trump influence—even without direct currency intervention.
“I want a strong dollar, but I want a dollar that does great for our country, not a dollar that's so strong that it makes it prohibitive for us to do business with other nations.”
— Donald J. Trump
Bias Hint: Structurally Bearish USD over the medium-term if Trump rhetoric escalates or policy influence returns.

Upcoming Key U.S. Data Releases (May 27–31)
| Date | Event | Forecast | Dollar Implication |
|---|---|---|---|
| May 27 | Durable Goods Orders | –8.0% | Miss = confirms growth risk → USD lower |
| May 29 | Q1 GDP (2nd Estimate) | –0.3% | Sharp downgrade = bearish pressure |
| May 29 | FOMC Minutes | — | Dovish = adds to USD decline; hawkish = may slow slide |
| May 30 | Core PCE (YoY Apr) | 2.8% | <2.7% = bearish; >3% = rally trigger |
| May 30 | Spending & Income | +0.2% / +0.3% | Weak = confirms slowdown fears |
Key Observations:
Technical Bias: Bearish
FX Pair Outlook – May 26, 2025
| Pair | Bias | Technical Narrative (Based on Daily Chart) |
|---|---|---|
| EUR/USD | ✅ Bullish | Broke out of the 1.13 with sustained bullish move. |
| GBP/USD | ✅ Bullish | Strong breakout above 1.3400 after prolonged range. Closed last week with a strong bullish displacement. |
| AUD/USD | ✅ Bullish | Clean breakout above long consolidation range could trigger strong upside. Structure favors continuation toward 0.6600. |
| NZD/USD | ✅ Bullish | Sustained bullish move after breaking out of the range. 0.603 can be a target for continued upside. |
| USD/CAD | ❌ Bearish | Sharp rejection from FVG. Clean break below 1.3750. Support at 1.3600. Below that opens more downside. Overall, CAD is weighing USD down. |
| USD/CHF | ❌ Bearish | Holding below broken FVG support. Eyes on 0.8100 next. Bearish unless reclaimed above 0.8350. With USD weakness, downside is more likely. |
| USD/JPY | ❌ Bearish | Break of 142.353 could send the gopher to more downside until 140.00. |

“Amateurs focus on rewards. Professionals focus on risk.”
— Jack Schwager, Market Wizards
One of the most defining traits of consistently profitable traders isn’t how much they make—it’s how well they manage what they can lose. As Jack Schwager notes, professionals don't chase wins blindly. They obsess over how much they’re willing to risk, how often they’re wrong, and how to survive long enough to capitalize when their edge plays out.
Focusing on risk reframes your entire mindset:
In essence, risk management isn’t just a safety net—it’s your offensive strategy for long-term survival.
Actionable Approach: “Risk-First” Routine for the Week
By thinking like a risk manager first, you give yourself the permission to trade freely and professionally—with structure, patience, and clarity.
How to Start Day Trading:
5 Steps to Start Day Trading: A Strategic Guide for Beginners
8 Steps How to Start Forex Day Trading in 2025: A Beginner’s Step-by-Step Guide
3 Steps to Build a Trading Routine for Consistency and Discipline - Day Trading Edition
Learn how to navigate yourself in times of turmoil:
How to Identify Risk-On and Risk-Off Market Sentiment: A Complete Trader’s Guide
How to Trade Risk-On and Risk-Off Sentiment — With Technical Confirmation
The Ultimate Guide to Understanding Market Trends and Price Action
Want to learn how to trade like the Smart Money?
Mastering the Market with Smart Money Concepts: 5 Strategic Approaches
Mastering Candlestick Pattern Analysis with the SMC Strategy for Day Trading
Understanding Liquidity Sweep: How Smart Money Trades Liquidity Zones in Forex, Gold, US Indices
The SMC Playbook Series Part 4: How to Confirm Trend Reversal & Direction using SMC
The SMC Playbook Series Part 5: The Power of Multi-Timeframe Analysis in Smart Money Concepts (SMC)
Trading Psychology and Continuous Improvement Contents:
The Mental Game of Execution - Debunking the Common Trading Psychology
5 Steps to Backtest a Trading Strategy with AI: A Step-by-Step Guide
Managing Trading Losses: Why You Can Be Wrong and Still Win Big in Trading
Follow me on LinkedIn: Jasper Osita
Join me in Discord: The Analyst Guild
This content may have been written by a third party. ACY makes no representation or warranty and assumes no liability as to the accuracy or completeness of the information provided, nor any loss arising from any investment based on a recommendation, forecast or other information supplies by any third-party. This content is information only, and does not constitute financial, investment or other advice on which you can rely.
ACY Securities is one of Australia's fastest growing multi-asset online trading providers, offering ultra-low-cost trading, rock-solid execution, technologically superior account management and premium market analysis.
Select the categories and companies you wish to follow directly to your person rss feed.
Create Custom RSS FeedSign up and join over 5,000 professional members who receive personalized news alerts, curated professional connections, and more for free!
WTI’s pullback into $79–82 is the first major test of the bullish Elliott Wave count, with buyers targeting a renewed break above $85.

BitDelta Securities has secured a full CMA Category 5 licence in the UAE and opened a regulated office in Business Bay, Dubai. The firm operates as an introducing broker, connecting investors with licensed international brokers across multiple asset classes, with CEO Dr. Demetrios Zamboglou commenting on the milestone.
Index volatility is asleep while single stocks fight it out underneath, credit refuses to confirm the equity rally, and a bare macro calendar hands next week to oil.
Digital assets and FX brokerage GC Exchange FZE (GCEX) has appointed Mohammed A. Mulla as a Board Member of its Dubai-based entity, part of the wider GCEX Group.
Learn what Blockchain-as-a-Service is, how it works, and why businesses are using BaaS to build blockchain applications without managing infrastructure.
CFDs vs stocks compared on leverage, ownership, costs, dividends, taxes, and risk. Learn the differences between stocks and CFDs and discover which suits your investing or trading goals.
Want to master the markets? A winning trading mindset beats a perfect strategy. Learn how emotional discipline helps you conquer fear and avoid heavy losses.
Read our latest Gold price action forecast to see how a double top pattern triggered a massive XAU/USD selloff.
Wondering how the API weekly report impacts oil prices? Learn how U.S. crude stockpiles and voluntary surveys predict the official EIA report.
cTrader Mobile 5.9 introduces a dedicated charts tab, single-tap chart access, a draggable floating action panel and a new focus mode for positions and orders, following the platform's Best Mobile Trading App win at UF Awards Global 2026. Sergey Borisov of Spotware comments on the update.