just now

Liquidity Finder Ltd is incorporated in England and Wales, company number 10610740, registered address 167-169 Great Portland Street, Fifth Floor, London W1W 5PF, United Kingdom.
Published: just now


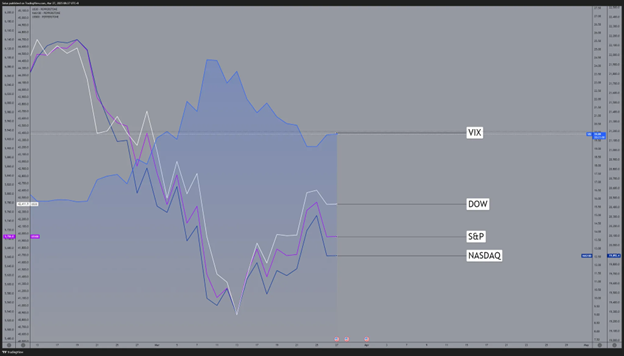
The U.S. stock market showed early signs of recovery this week — only to tumble again under the weight of poor liquidity, rising volatility, and renewed geopolitical tensions. The VIX surged, tech stocks led the decline, and macro headlines once again drove intraday market direction.
NAS - Tech Selloff Triggers Sharp Reversal
S&P - Weakness Confirmed as Price Trades Below Key Levels
DOW - Breakout Fails as Index Slips Into Bearish Sequence

Markets kicked off the week with a hopeful tone. On Monday, March 24, durable goods orders surprised to the upside, rising 0.9% against expectations of a decline. The S&P 500, Nasdaq, and Dow all posted modest gains — a breather after recent weakness.
But under the surface, liquidity was already starting to fade. Spreads widened, market depth thinned, and the VIX crept higher to 20.2 on Wednesday.
Tuesday’s mild gains masked something bigger: institutional players were backing off. Bloomberg reported the lowest S&P futures depth since 2020. Traders noticed: fills slowed, volatility increased, and bids began to disappear in size.
By midweek, that fragility turned into a move.
Mini-recovery followed by hesitation
On March 26, all major indexes slipped. The Nasdaq dropped 2%, the S&P fell 1%, and the Dow shed 130+ points.

The trigger? Renewed trade war rhetoric. President Trump’s announcement of “reciprocal tariffs” on EU and Asian auto imports spooked global markets. Headlines hit fast, and with thin liquidity, the downside accelerated.
Big Tech led the drop.
These weren’t just stock-specific — they signaled a potential shift in tech leadership, with institutional outflows following.
NAS
4-Hour
1-Hour
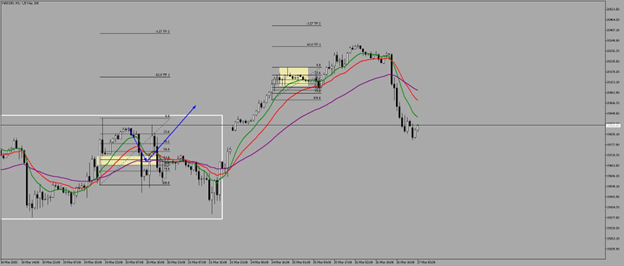
After hitting our target at -62.0 Fibo Extension at 20315 level, NAS consolidated shortly and after yesterday’s New York market open, NASDAQ fell sharply and broke down the moving averages.
4-Hour Scenario
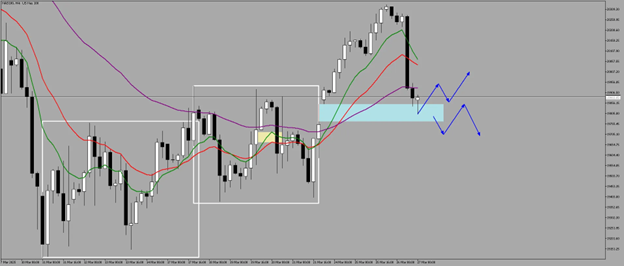
Currently, we are testing the 19849.43 - 19766.00 level as price seeks support for a potential bounce on the Fair Value Gap.
If NAS fails to show bullish reaction and follow-through, a breakdown could be imminent with potential test of support at 19600 level.

U.S. analysts called the pullback a dip to buy. European desks weren’t convinced. A Bloomberg roundup showed EU strategists warning of deeper macro risks — tightening credit, weak industrial data, and rising protectionism.
For traders, this divergence offers insight into global flows and sentiment rotation.
Corrections are normal — since 1980, the S&P 500 has averaged a 14% intra-year drop. But this one comes amid:
That combo could change market behavior — especially for trend-following strategies and momentum setups.
S&P
4-Hour
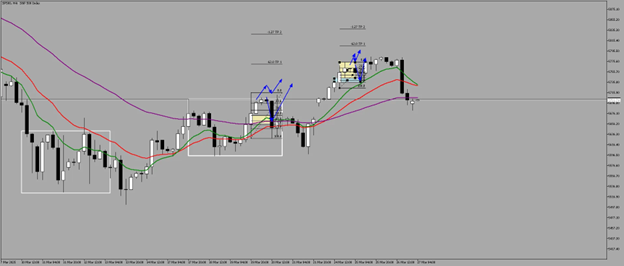
With Nasdaq falling sharply, S&P also fell on the downside for almost -2% from the open.
1-Hour
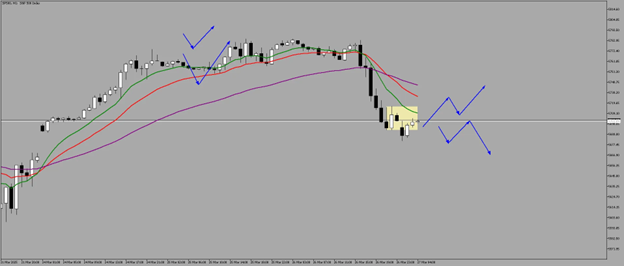
S&P is currently trading below the MAs which exhibits weakness. Unless we breakout of the MAs and the 5692.19 - 5715.98 level, we could see further downside testing the 5656.49 - 5681.19 level.
The Dow held firmer than tech — but under the hood, cyclicals and industrials are losing steam. If defensives can’t carry the baton, broader downside risk grows.
DOW
4-Hour
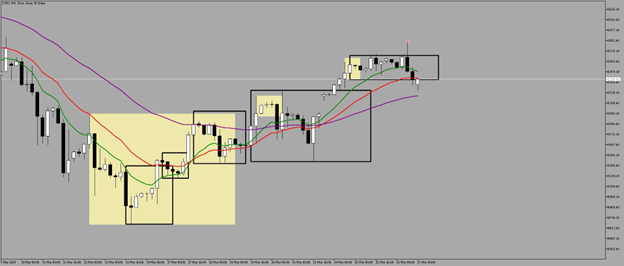
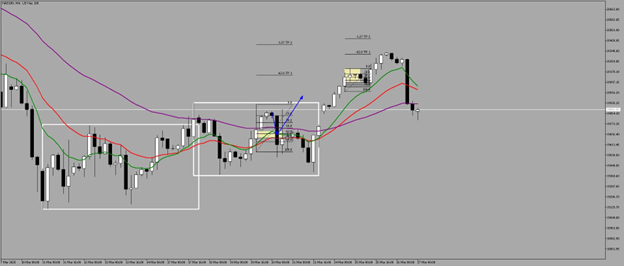
Dow failed to hold its ground above 42650 level after trying for another push to the upside and turned out to be just a fakeout.
Dow has already broken the immediate support with signs of weakness incoming due to tariff concerns.
1-Hour
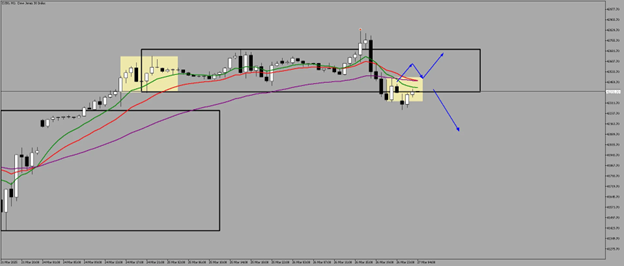
We are still in an obvious bearish sequence that could lead to more downside if we fail to breakout at 42321.90 - 42493.74 level. Unless we breakout, further downside could be capitalized for shorts.
This market is driven as much by headlines as it is by fundamentals. Stay nimble, stay informed — and don’t trade in isolation from the bigger picture.
“Price is the effect. Narrative is the cause. Trade both.”
This content may have been written by a third party. ACY makes no representation or warranty and assumes no liability as to the accuracy or completeness of the information provided, nor any loss arising from any investment based on a recommendation, forecast or other information supplies by any third-party. This content is information only, and does not constitute financial, investment or other advice on which you can rely.
ACY Securities is one of Australia's fastest growing multi-asset online trading providers, offering ultra-low-cost trading, rock-solid execution, technologically superior account management and premium market analysis.
Select the categories and companies you wish to follow directly to your person rss feed.
Create Custom RSS Feed
just now
Sign up and join over 5,000 professional members who receive personalized news alerts, curated professional connections, and more for free!
Gold Price Action Forecast: Will XAU/USD Drop to $3930? Meta Description: Read our Gold price action forecast to see if XAU/USD will drop to $3930.
BitDelta Securities Financial Services LLC (“BitDelta Securities”) today announced that it has received full regulatory approval from the Capital Market Authority (“CMA”) of the United Arab Emirates under the Category 5 — Arrangement and Advice license framework (License No. 20200000439). The approval follows the firm's receipt of In-Principal Approval earlier this year and represents the successful conclusion of the CMA's full licensing process, including the satisfaction of capital requirements, governance appointments, and operational setup.
Crypto.com has received a $400 million strategic investment from Citadel Securities, valuing the firm at $20 billion. It marks the first institutional funding round in the company's history, aimed at accelerating its expansion into tokenised securities, derivatives and other asset classes.
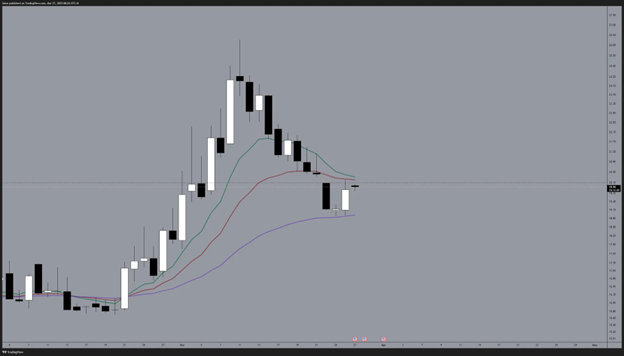
WTI’s pullback into $79–82 is the first major test of the bullish Elliott Wave count, with buyers targeting a renewed break above $85.

BitDelta Securities has secured a full CMA Category 5 licence in the UAE and opened a regulated office in Business Bay, Dubai. The firm operates as an introducing broker, connecting investors with licensed international brokers across multiple asset classes, with CEO Dr. Demetrios Zamboglou commenting on the milestone.
Index volatility is asleep while single stocks fight it out underneath, credit refuses to confirm the equity rally, and a bare macro calendar hands next week to oil.
Digital assets and FX brokerage GC Exchange FZE (GCEX) has appointed Mohammed A. Mulla as a Board Member of its Dubai-based entity, part of the wider GCEX Group.
Learn what Blockchain-as-a-Service is, how it works, and why businesses are using BaaS to build blockchain applications without managing infrastructure.
CFDs vs stocks compared on leverage, ownership, costs, dividends, taxes, and risk. Learn the differences between stocks and CFDs and discover which suits your investing or trading goals.
Want to master the markets? A winning trading mindset beats a perfect strategy. Learn how emotional discipline helps you conquer fear and avoid heavy losses.