just now

Liquidity Finder Ltd is incorporated in England and Wales, company number 10610740, registered address 167-169 Great Portland Street, Fifth Floor, London W1W 5PF, United Kingdom.
Published: just now

This weekly open is lining up to be a volatile one — especially for American markets.
On the technical side, the S&P 500 and Nasdaq 100 weekly charts are flashing warning signals. The S&P 500 has printed a tweezer top, a potential bearish reversal pattern, while the Nasdaq 100 appears to have formed a failed breakout above the Value Area High (VAH) — hinting at fading momentum.
Fundamentally, tensions in the Middle East have escalated. Over the weekend, the U.S. conducted a surprise military operation linked to the ongoing Iran-Israel conflict — despite President Trump having previously issued a two-week ultimatum for Iran to de-escalate. The early strike caught markets off guard, and 24/7 assets like Bitcoin reflected the risk-off mood, tumbling more than 4.5%.
If equities follow suit, conservative downside targets sit around the 4–5% range, but an extended correction of 6–7% can’t be ruled out in the short term. There’s also a case to be made about the yearly top being in — resulting in a 20% correction.
Either way, it would not be surprising if markets take on a risk-off approach this week.
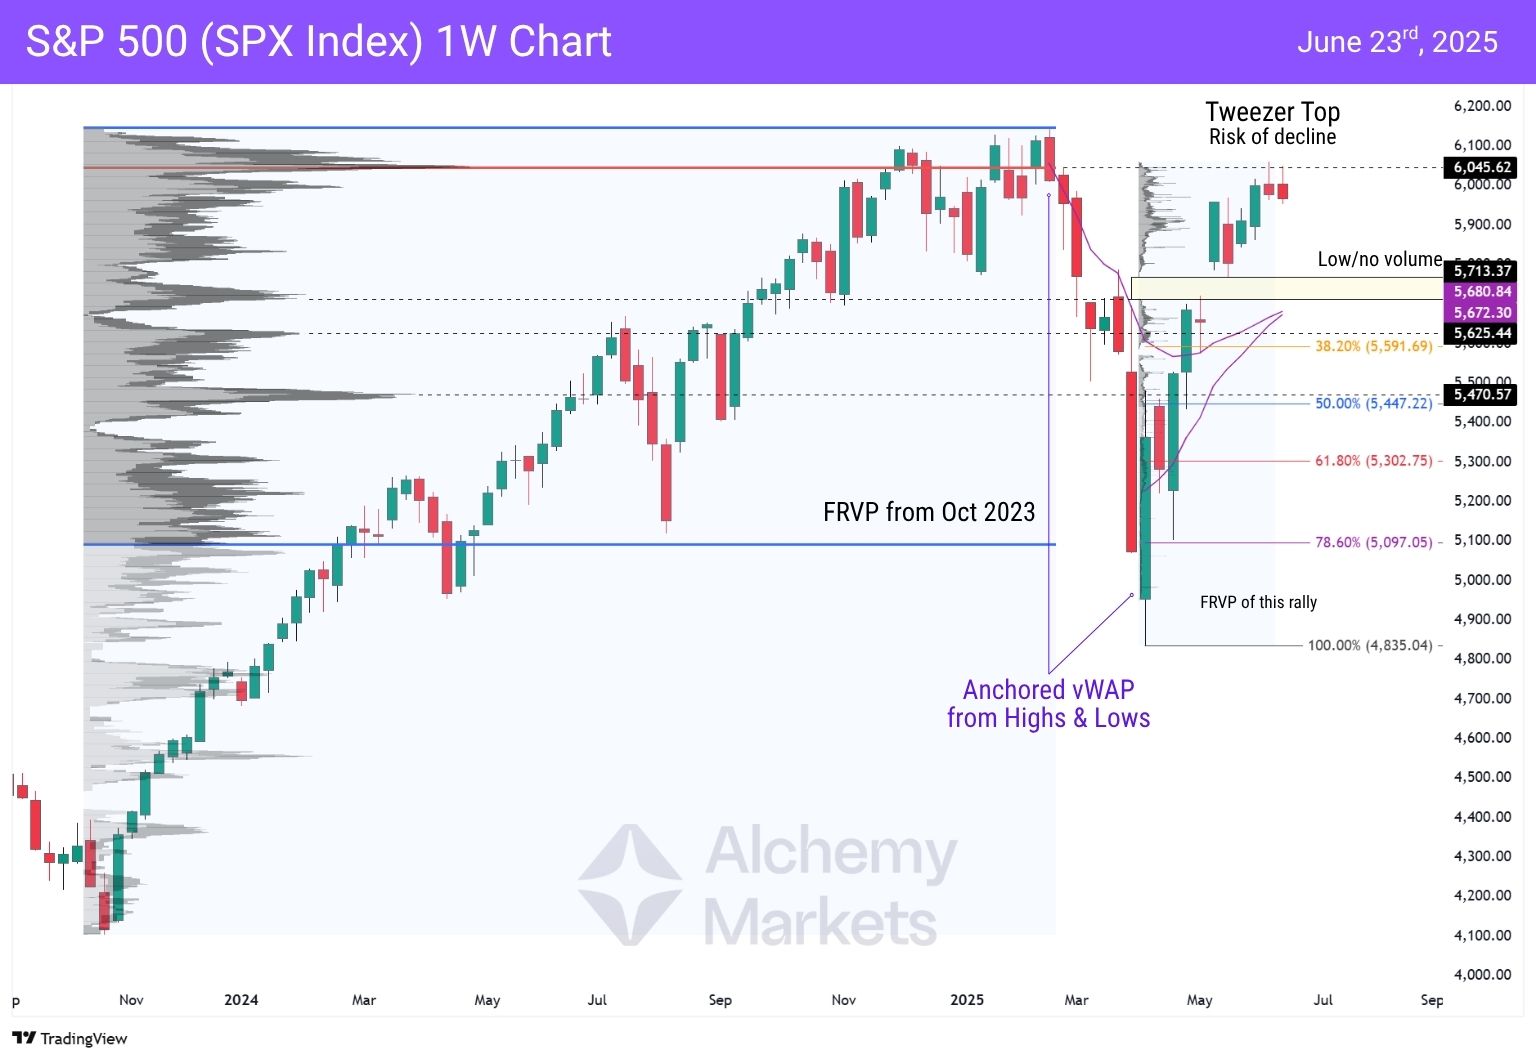
T1 — Market Gap at $5,713 and $5,767
T2 — Anchored vWAP Cluster at $5,672.30 and $5,680.84
T3 — Larger Correction down to 50% Fibonacci Retracement at $5,447.22
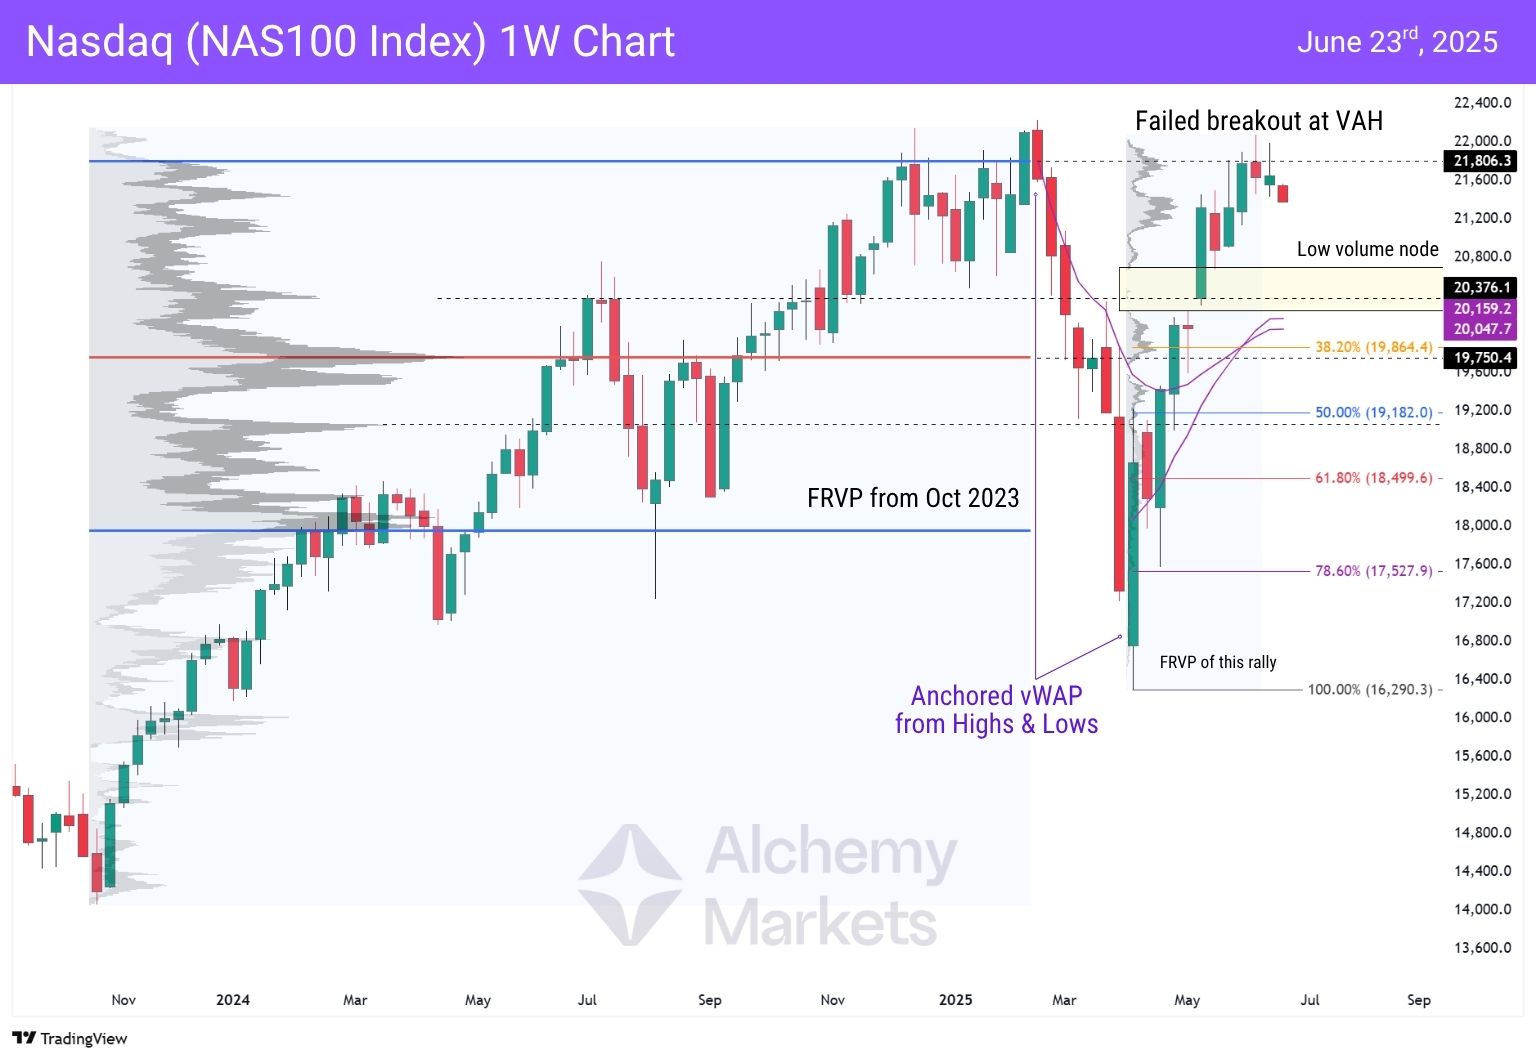
T1 — Low volume node/ Thin profile at $20,248 to $20,695 range
T2 — Anchored vWAP Cluster at $20,047.7 and $20,159.2
T3 — Larger Correction down to 50% Fibonacci Retracement at $19,182.0
If tensions escalate or drag out, a deeper correction toward the March 2025 lows would align with a larger ABC corrective structure — a common outcome in geopolitical-led pullbacks. While bulls still hold structural control, the current confluence of technical weakness and geopolitical uncertainty adds fuel to the bear case.
You may also be interested in:
Powell, PCE, Housing & U.S.-Iran Tensions Stir 20% Correction Risk
DISCLAIMER: For educational purposes only. Trading comes with substantial risk, leading to possible loss of your capital. Traders are advised to do their own due diligence before investing.
Alchemy Markets is a multi-asset brokerage providing retail traders with the same elite trading conditions, tools, and transparency typically reserved for institutions.
Select the categories and companies you wish to follow directly to your person rss feed.
Create Custom RSS Feed
just now
Sign up and join over 5,000 professional members who receive personalized news alerts, curated professional connections, and more for free!
Sydney-based multi-asset broker ACY Securities has introduced PAXGUSD, a new CFD instrument that allows clients to trade tokenised gold against the US Dollar 24 hours a day, seven days a week. The instrument is available across MetaTrader 4, MetaTrader 5, and the ACY Trading Platform.
Binance has lowered its VIP 3 Wallet Assets threshold from $3 million to $1 million and will now count OTC Spot Trading Volume at a 4x multiplier toward VIP qualification, removing the previous VIP 4 cap and allowing eligible users to progress through the full tier framework up to VIP 9.
Retail futures trading leader NinjaTrader Group has appointed Mark Omens as Senior Vice President, Commercial Strategy, bringing a 25-year veteran of derivatives marketplace CME Group into a newly created role focused on exchange partnerships and enterprise growth.
Gold Price Action Forecast: Will XAU/USD Drop to $3930? Meta Description: Read our Gold price action forecast to see if XAU/USD will drop to $3930.
BitDelta Securities Financial Services LLC (“BitDelta Securities”) today announced that it has received full regulatory approval from the Capital Market Authority (“CMA”) of the United Arab Emirates under the Category 5 — Arrangement and Advice license framework (License No. 20200000439). The approval follows the firm's receipt of In-Principal Approval earlier this year and represents the successful conclusion of the CMA's full licensing process, including the satisfaction of capital requirements, governance appointments, and operational setup.
Crypto.com has received a $400 million strategic investment from Citadel Securities, valuing the firm at $20 billion. It marks the first institutional funding round in the company's history, aimed at accelerating its expansion into tokenised securities, derivatives and other asset classes.
WTI’s pullback into $79–82 is the first major test of the bullish Elliott Wave count, with buyers targeting a renewed break above $85.

BitDelta Securities has secured a full CMA Category 5 licence in the UAE and opened a regulated office in Business Bay, Dubai. The firm operates as an introducing broker, connecting investors with licensed international brokers across multiple asset classes, with CEO Dr. Demetrios Zamboglou commenting on the milestone.
Index volatility is asleep while single stocks fight it out underneath, credit refuses to confirm the equity rally, and a bare macro calendar hands next week to oil.
Digital assets and FX brokerage GC Exchange FZE (GCEX) has appointed Mohammed A. Mulla as a Board Member of its Dubai-based entity, part of the wider GCEX Group.