just now

Liquidity Finder Ltd is incorporated in England and Wales, company number 10610740, registered address 167-169 Great Portland Street, Fifth Floor, London W1W 5PF, United Kingdom.
Published: just now


Gold has always held a unique place in the financial ecosystem. It’s not just a commodity or a currency it’s a signal. In times of uncertainty, gold often rises as investors seek safety. In times of optimism, it may stall or decline as capital flows into riskier assets. This dynamic between "risk-on" and "risk-off" sentiment has become one of the most reliable guides for gold traders.
In 2025, that connection is as clear as ever. Whether it's the ongoing fallout from geopolitical tensions or renewed volatility tied to U.S.-China trade relations, gold continues to act as a safe harbor. Whenever there's a shock whether military, political, or economic XAU/USD tends to surge. And most of the time, those surges aren't random. They’re timed with the global flow of news and capital.
Understanding when to trade gold isn’t just about watching charts it’s about reading the world.
What Triggers Gold Moves in 2025? Look to the Headlines
Let’s look back briefly. In early 2024, when headlines screamed about a possible Trump-China trade escalation, gold spiked nearly $80 in a matter of days. A year earlier, ceasefire talks between Ukraine and Russia caused sharp intraday swings with gold both rallying on war fears and briefly dipping on hopes of peace.
These are not coincidences. They’re examples of how gold thrives on narrative and why traders need to be acutely tuned into global news cycles.
The lesson here? The best time to trade gold is often when the market is reacting emotionally. This is when momentum is strong, volume is high, and flows into gold become dominant.
Although gold is traded 24/5, not all hours are created equal. The most active and liquid periods tend to fall within overlapping major market sessions especially when they coincide with fresh news, data releases, or market-moving headlines.
While you can technically trade gold anytime, here’s where most of the meaningful price action tends to happen:
If you’re trading from Australia or Asia-Pacific, it’s worth adjusting your sleep schedule if you’re looking for bigger moves because most true volatility comes from U.S. hours or from surprise news during those crossover periods.
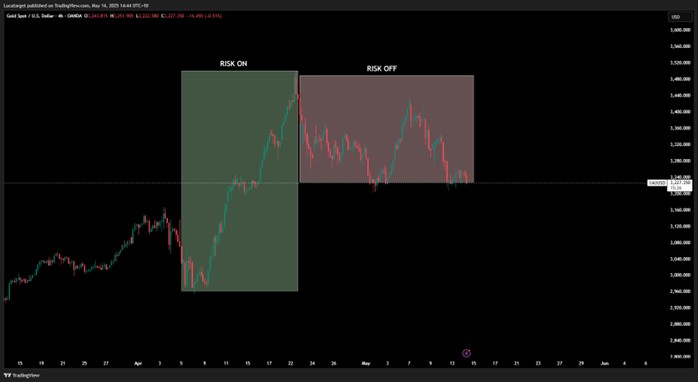
In 2025, one strategy has stood out for traders watching XAU/USD: buying gold on pullbacks during risk-off conditions. Over the past five years, gold has continued to trend higher not in a straight line, but with frequent, temporary retracements. These dips often occur when risk sentiment temporarily shifts or when traders take profits.
But the broader trend has remained intact. Here’s what that means for your approach: if the macro environment is still uncertain (inflation is high, geopolitical risks are unresolved, or global markets are uneasy), gold is likely to remain supported.
This is where a disciplined buy-the-dip strategy can be incredibly effective especially if you’re willing to use tools like dollar-cost averaging (DCA).
DCA isn’t just for long-term investors it can be a smart tactical strategy for traders too. By spreading out your entries over time (especially during retracements), you reduce the risk of going all-in at the wrong moment.
Imagine gold drops $30 in a day because of a temporary “risk-on” headline maybe a ceasefire rumour or an upbeat inflation print. If your macro view is still bullish on gold, instead of chasing the bounce or panicking, you allocate a portion of your capital, then wait. If gold drops further, you add again. Over time, you build your position at an increasingly favourable average price.
Of course, DCA is not without risk. If gold breaks through key macro levels or if the geopolitical narrative truly shifts toward calm and recovery, your long exposure could get caught on the wrong side of the trend. That’s why combining DCA with clear stop levels, position sizing, and macro awareness is essential.
The key is not to blindly buy every dip but to understand why the dip is happening, and whether the underlying drivers of the gold rally remain in play.
There’s a popular saying among gold bugs that “gold only goes up.” While that’s not strictly true gold does have drawdowns the long-term trend, especially during uncertain periods, is overwhelmingly positive.
From January 2020 to May 2025, gold (XAU/USD) has climbed from around $1,500 to over $2,400 a gain of more than 60% in just over five years. But more telling than the price is the reason behind the move:
These aren’t short-term narratives they’re structural. And if they persist, gold has fundamental backing to remain in a long-term uptrend.
To summarize your tactical trading windows:
Headlines like these move the market and they tend to cause impulsive, high-volume gold flows, especially in favour of longs when fear rises quickly.
Gold may thrive on chaos, but successful gold traders thrive on preparation. Trading XAU/USD in May 2025 or any time is about understanding the rhythm of the market. Timing matters. Sentiment matters. But most of all, having a plan matters.
Use the market sessions to your advantage. Stay informed about global events. Look to buy dips in risk-off environments and be ready with a strategy like dollar-cost averaging to build positions methodically.
Gold doesn’t just react to data it reacts to fear, trust, and uncertainty. If you can read those factors in the market, gold can become one of your most rewarding assets to trade.
To deepen your understanding of gold trading strategies and market dynamics, consider exploring the following resources:
These resources are designed to provide you with a deeper understanding of macroeconomic indicators and their practical applications in CFD trading.
This content may have been written by a third party. ACY makes no representation or warranty and assumes no liability as to the accuracy or completeness of the information provided, nor any loss arising from any investment based on a recommendation, forecast or other information supplies by any third-party. This content is information only, and does not constitute financial, investment or other advice on which you can rely.
ACY Securities is one of Australia's fastest growing multi-asset online trading providers, offering ultra-low-cost trading, rock-solid execution, technologically superior account management and premium market analysis.
Select the categories and companies you wish to follow directly to your person rss feed.
Create Custom RSS FeedSign up and join over 5,000 professional members who receive personalized news alerts, curated professional connections, and more for free!
: How the Federal Open Market Committee decisions change the cost of borrowing money? Learn how U.S. interest rates shift stocks, bonds, and the U.S. dollar today.
Want to join the ranks of profitable traders? Discover why mastering your trading psychology and sticking to a trading plan is the real key to success.
The EUR/USD pair deals with bearish weight as a hawkish Federal Reserve and increasing geopolitical tensions testing the critical support 1.1400 region.
Read my EUR/USD price action forecast for this week. Will the 1.14150–1.14520 EUR/USD resistance level trigger a massive drop? Find out here.
Pepperstone has expanded its Perpetual CFD suite beyond digital assets, adding Gold, Silver, Nasdaq, S&P 500, WTI and Brent Crude to its lineup. The regulated broker aims to bring perpetual market mechanics, first popularised in crypto, into traditional asset classes as global markets shift toward continuous, round-the-clock trading access.
cBridge, Spotware's fixed-price liquidity bridge, has partnered with institutional CFD liquidity provider STARPRIME, giving brokers access to multi-asset liquidity across FX, metals, indices, commodities and crypto, alongside aggregation, routing, exposure monitoring and reporting tools.
USD/CAD cools inside a tight bull flag as CPI, the BoC and a little-known tariff deadline all land in the same week.
Former TradingView CEO Oleg Mukhanov joins GoCharting as President and COO, with ex-TradeStation chief Salomon Sredni as Chairman, alongside Long Ridge investment.
Databento, the market data platform for modern finance, has raised a $97 million Series B led by NEA, with participation from DRW Venture Capital, Redpoint Ventures and Tribe Capital. The oversubscribed round drew over $300 million in demand and will fund global infrastructure and data centre expansion.
CME Group has announced Treasury Link, an industry-first functionality connecting CBOT Treasury futures and BrokerTec cash Treasuries via CME Globex. Leveraging FX Link technology, the service enables single-submission spread trading, eliminating legging risk, and is expected to launch in Q4 2026, pending regulatory review.