
Why Tick Volume Is Important To Monitor

Unlike futures trading, one of the challenges of trading spot forex is its opaque and fragmented nature, with no exchange or central entity facilitating a transparent volume representation. Trading activity via banks, financial institutions, hedge funds, asset managers, individual traders around the clock makes it incredibly difficult to track the real-time aggregated volume. Because of this wrongly assumed limitation, many traders have led to believe that volume activity is therefore not available.
Tick Volume To The Rescue
Fortunately, there is a way around to replace this shortcoming. What if you could add a ‘non-lagging’ indicator that would allow you to make better-informed decisions as a trader? That’s where tick volume, which measures the number of times the price ticks up and down, comes into play.
Did you know that tick volume activity and actual traded volume in spot forex exhibit a relationship that is extremely high? All it takes is to find a broker such as Global Prime Forex with sufficient depth of liquidity and learn how to properly interpret these volume patterns that occur over and over.
First, let’s briefly touch on why is volume such a powerful piece of information. The answer lies in the influence it has to move prices and similarly because it communicates the involvements of the big or smart money. Volume is the fuel to cause new cycles and tells us the degree of commitment that it exists to endorse a certain buy or sell-side campaign.
By understanding the bias of big players, we can piggyback their market bias. Let’s now back up with empirical evidence why tick volume matters.
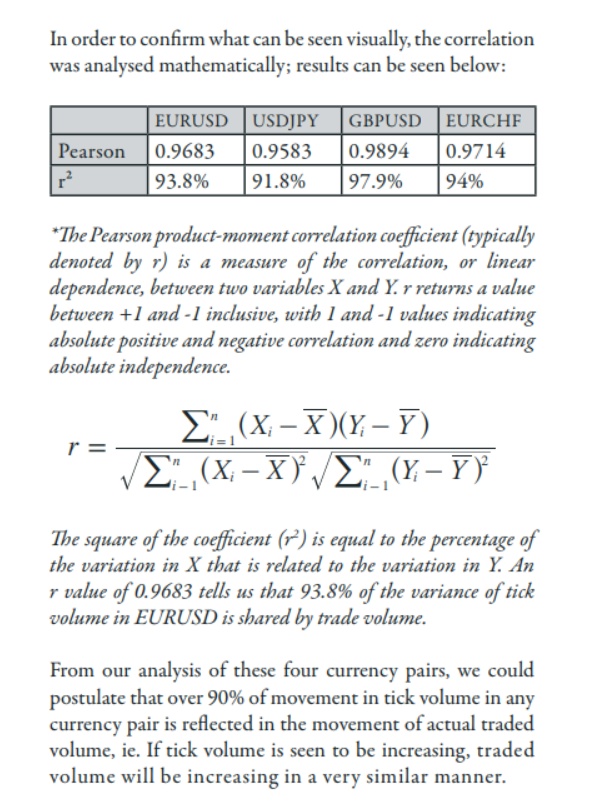
In a landmark research paper* published back in 2011 by Caspar Marney, veteran forex trader, who served tenures at banks such as UBS or HSBC, debunked the myth of the limited usefulness of tick volume in spot forex. Caspar, after a thorough study, concluded the existence of striking high levels of accuracy between tick activity and actual traded volume, which vindicates the importance of tick data and hence the relevance of this tutorial.
Find below an extract of the correlations Caspar came up with, which shows the intimate relationship between price updates and real volume. As you can notice, we are talking about correlations of 90% plus. Therefore, we should safely conclude that the analysis of tick volume activity provides real insights into the actual buy or sell-side commitment shown by the major market participants moving the price in the forex market.
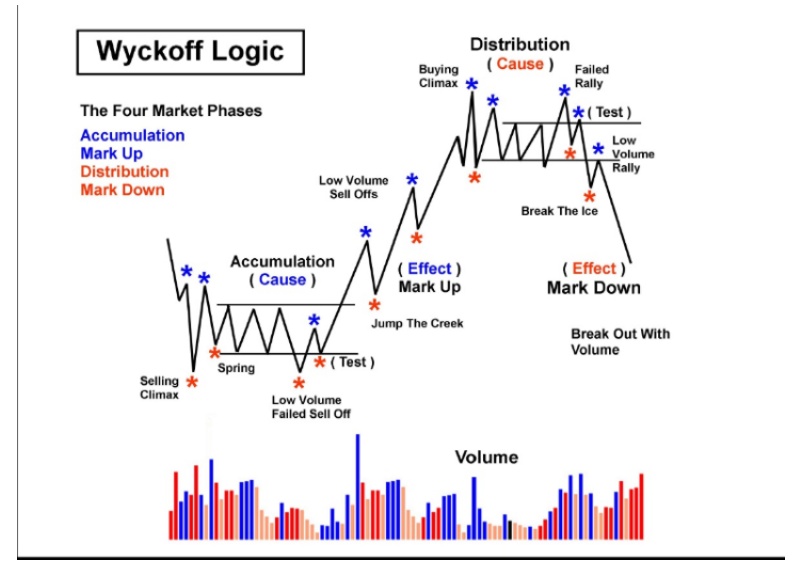
I must say, the search of an exploitable edge by blending in volume with price dates back to 1900s after a major influencer in the study of volumes, Richard Wyckoff, presented a research known as Wyckoff Analysis. His findings then evolved into what is today popularly known as Volume Spread Analysis (VSA). However, to simplify this tutorial, I will focus on the volume patterns that I have personally come to identify as a trader. Nonetheless, find below the basics of what Wyckoff would understand as his own logic.
Context Is King: Is The Smart Money Behind?
One important aspect to clarify is the absolute ‘must’ to always understand the environment and conditions you are trading. If the volume is going to be taken in isolation, it means very little. It’s only when contextualizing recent price movements and its volume evolution that it starts to tell us a story, unfolding bar by bar. The art of reading the market is to take a holistic and pragmatic overall view, moving away from the read of individual bars.
What I mean by stressing the above point is that as a trader, you must keep your multi-timeframe analysis in mind. Failure to do so may easily lead to picking the toughest and most costly battles as the tide is not in your favor. Never forget this tip. If you want to find out much more about how I personally analyze cycles, find my tutorial in market structure.
I once read a great analogy for volumes, which I can’t credit to one particular individual as it was many years ago and I completely lost track. He would compare volume to the accelerator of a car, price movement to the actual car motion, while a universal level of resistance/support would be a ‘hill’.
If the car is expected to keep going up a steep hill, do you think gently pressing the gas pedal would do the job? The forward motion of the car going up the hill can’t possibly be long-lasting unless there is more power (gas) applied, correct? What if you were to press the accelerator to its maximum capacity yet the car motion is still stagnant going up the hill? That would be another clue, right? Do you start to see how the study of volume can be of real value to tells us a story about the intentions of market participants?
So, how can we tell if a price movement has the characteristic of being smart money-driven? To accomplish our objective, we will stick to our 3 elements, that is, the car (price), the gas (volume) and the hill* (key level). How price heads into major areas of interest will be absolutely key to make a well-informed call about the environment as traders we face.
*I assume the reader will be interested to engage in relevant areas of support and resistance, as that will ensure that the volume analysis occurs in areas that are universally followed by all types of traders. Nothing will have more usage than support and resistance, even algorithms-driven systems take these levels into account. This implies that liquidity will be available on the proximity of the level and especially on a breakout, making it a decision point.
Volume Sequence: Type Of Volume Acceleration
Depending on the type of trader you are, this is all you may need to get your entry confirmation. Other traders will need some extra info before pulling the trigger, and that’s fine too. It’s all about styles. I will be exploring both scenarios, that is, the two most basic yet most fundamental volume sequence to constantly be monitoring, while I will also provide different individual candle formations that add an extra input of potential confirmation.
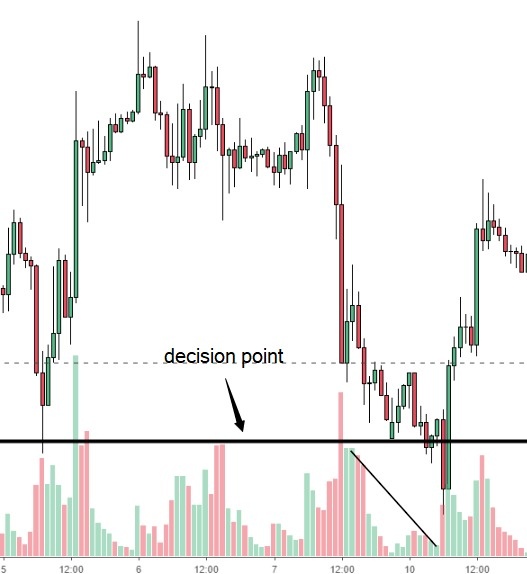
Let’s dive into it. The first pattern to be aware of is what I personally refer to as false acceleration, even if it’s more commonly known as exhaustion sequence. If you observe price heading into a key decision point on lower or decreasing tick volume, we are likely to find ourselves in a context where a rejection of that level is likely. Remember, the car is trying to go up a hill with little gas being applied. It doesn’t bode well unless gas (volume) increases.
This type of acceleration in price without the backing of volume tends to be a false picture of the market intentions, and certainly not one that carries the interest of the smart money. The low tick volume is caused by the professional money staying away from participating in the move.
The absence of this big money riding the move results on thinner market liquidity, which facilitates a larger price extension even of low volumes. Unless the ‘smart money’ takes part in the move, the hill will get too steep for the car to keep moving forward.
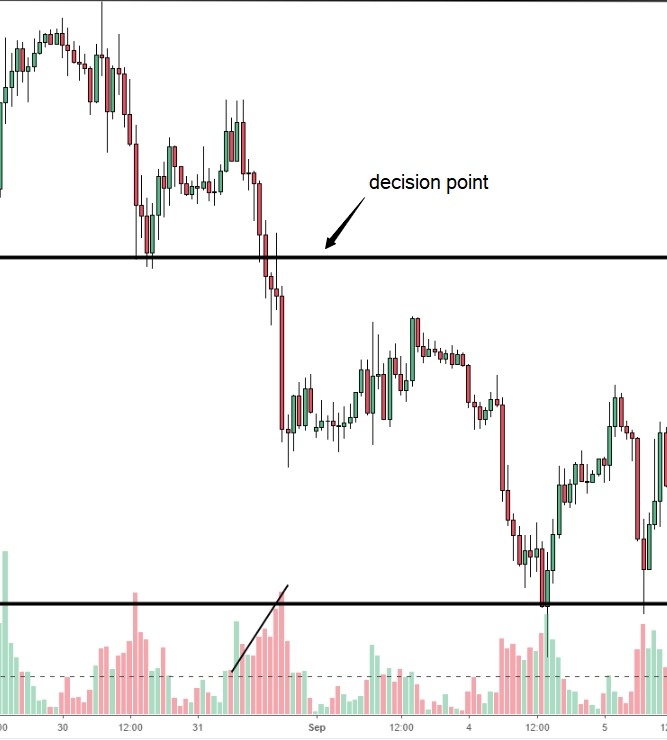
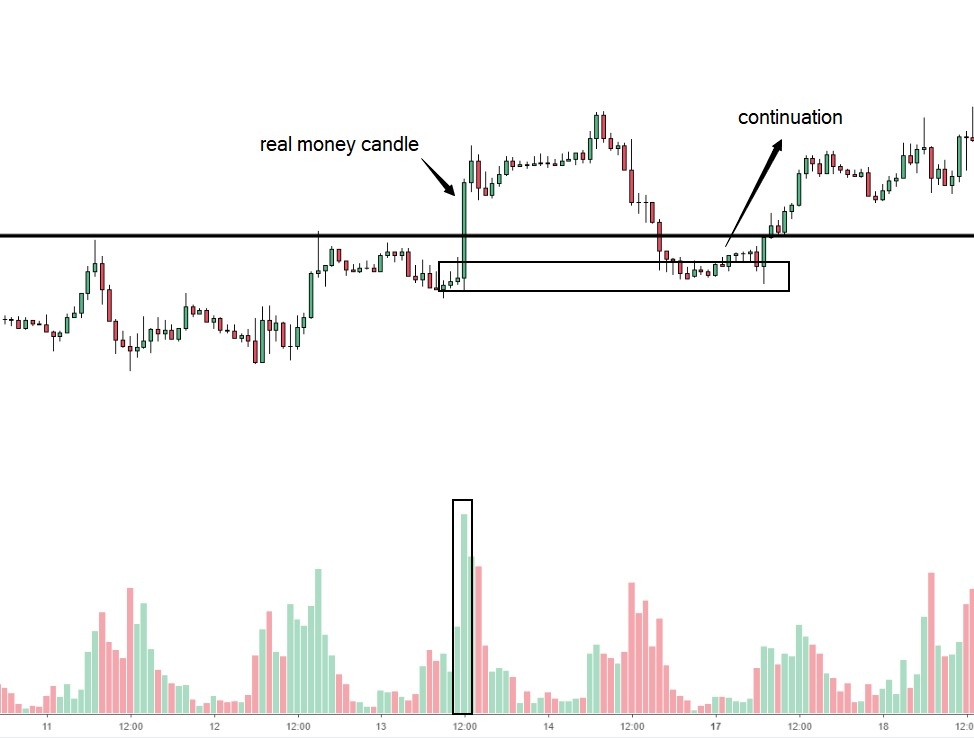
If the price moves towards a decision point or the level is broken amid higher or increasing tick volume, more often than not, it communicates that the bias has the backing of the institutional money. When this happens, a continuation of the developing trend is expected. Find an illustration of this pattern below.
Most Common Tick Volume Candles
Aren’t you aggressive enough to factor in the above volume sequences to trade off your selected levels? No worries, I’ve got you covered. It’s now time to dig deeper into the most common individual tick volume candles that may show up at these trading levels. It should serve as yet another invaluable piece of the jigsaw to make an informed trading decision. These candle formations can reveal plenty of clues to confirm a thesis over a particular direction.
As an important note. You must make sure these candles are formed at the right levels with enough room to run to the next logical targets. And again, remember that candle formations are as good as the context traded.
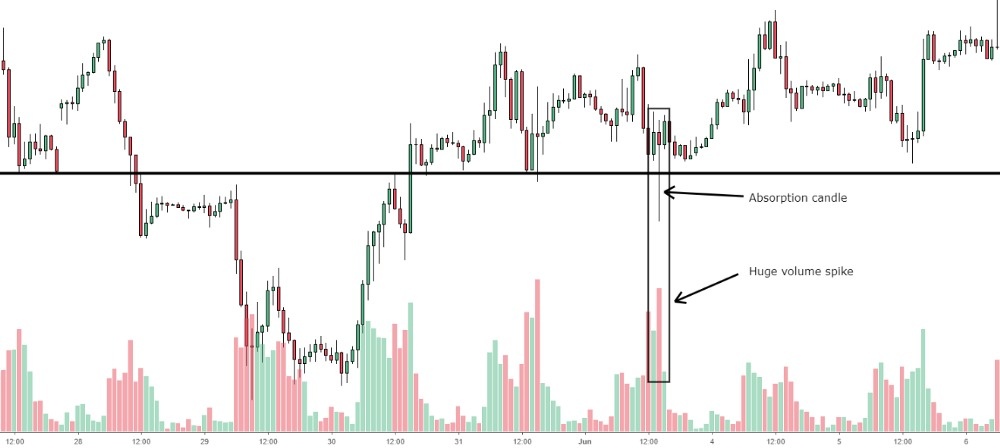
If at a key decision point as in the illustration below, we spot a volume that stands out above the rest, with a sizeable tail of at least ½ the size of the candle, that’s what is known as an absorption candle.
An immense amount of selling pressure came in, yet buy orders ended up overwhelming buyers. After this print, do you think sellers are likely to engage again or will they re-assess at the next best level? Remember, the driver has applied maximum force to the gas pedal yet the car can’t seem to go further up the hill. You’d probably want to find a different hill (level) as this one is clearly too steep to make it through.
Bonus: If you see an absorption candle followed by an exhaustion sequence, as in the example below, then it’s almost perfection.
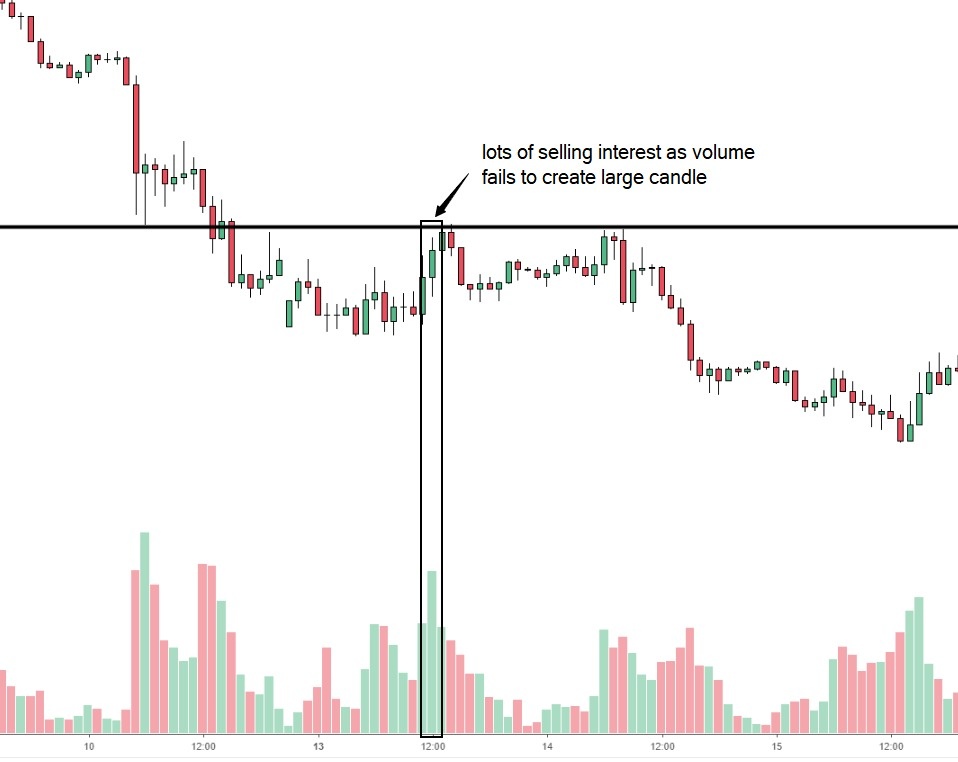
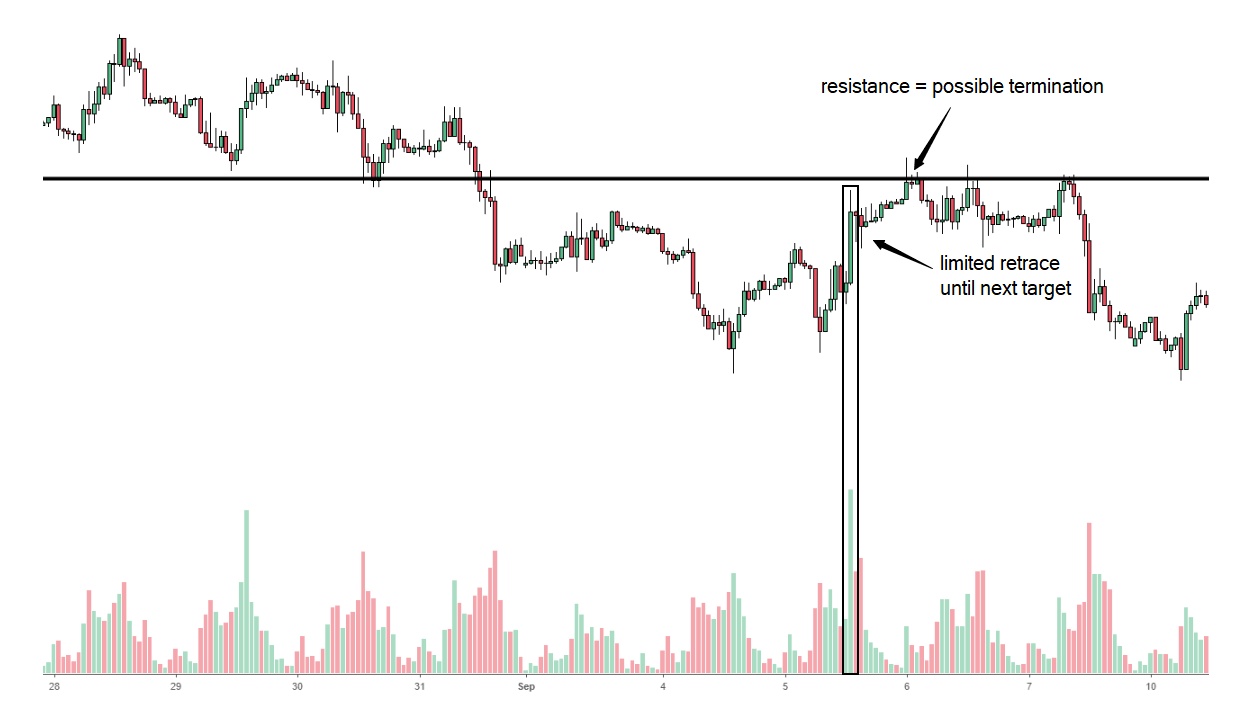
Ideally, the close is in favor of your preferred trading direction, but it’s not necessary. In the first illustration below, the relatively small bullish candle is printed on much higher volume as price heads back into a resistance level.
If you think about it, that small size candle on such high volume can only be possible if there is strong interest by sellers to absorb whatever demand comes in. When this pattern occurs, it tends to halt price for a potential reversal.
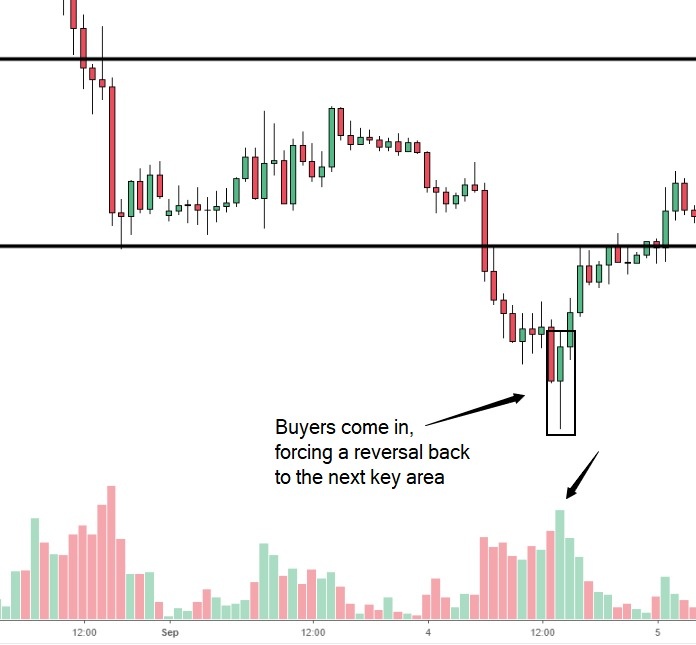
If there is enough room until the next target area, this candle formation tends to run further with little retracement as momentum traders jump onto the bandwagon. However, unless you are a short-term trader, due to the over-extended conditions, it usually retraces, and that’s where swing traders and the smart money will look to re-engage.
Putting It All Together
This tutorial has set the foundation for you to explore further the magic of blending price action and volume analysis at key decision points. It is now your turn to define and ask yourself the next logical question. How would you go about exploiting tick volume to find low-risk entries? Whichever approach you take, spend time studying your charts using tick volume data based on some of the patterns I introduced. Find a mechanical and repetitive way to go about entries too. What are the areas you like to trade off? What about the timeframe? Are you a short-term, swing or position trader? There are many questions you must fill in the gaps with. Lastly, spend time thinking if the study of tick volume can help you with your decision-making process.
Extra Bonus (Practical Exercise)
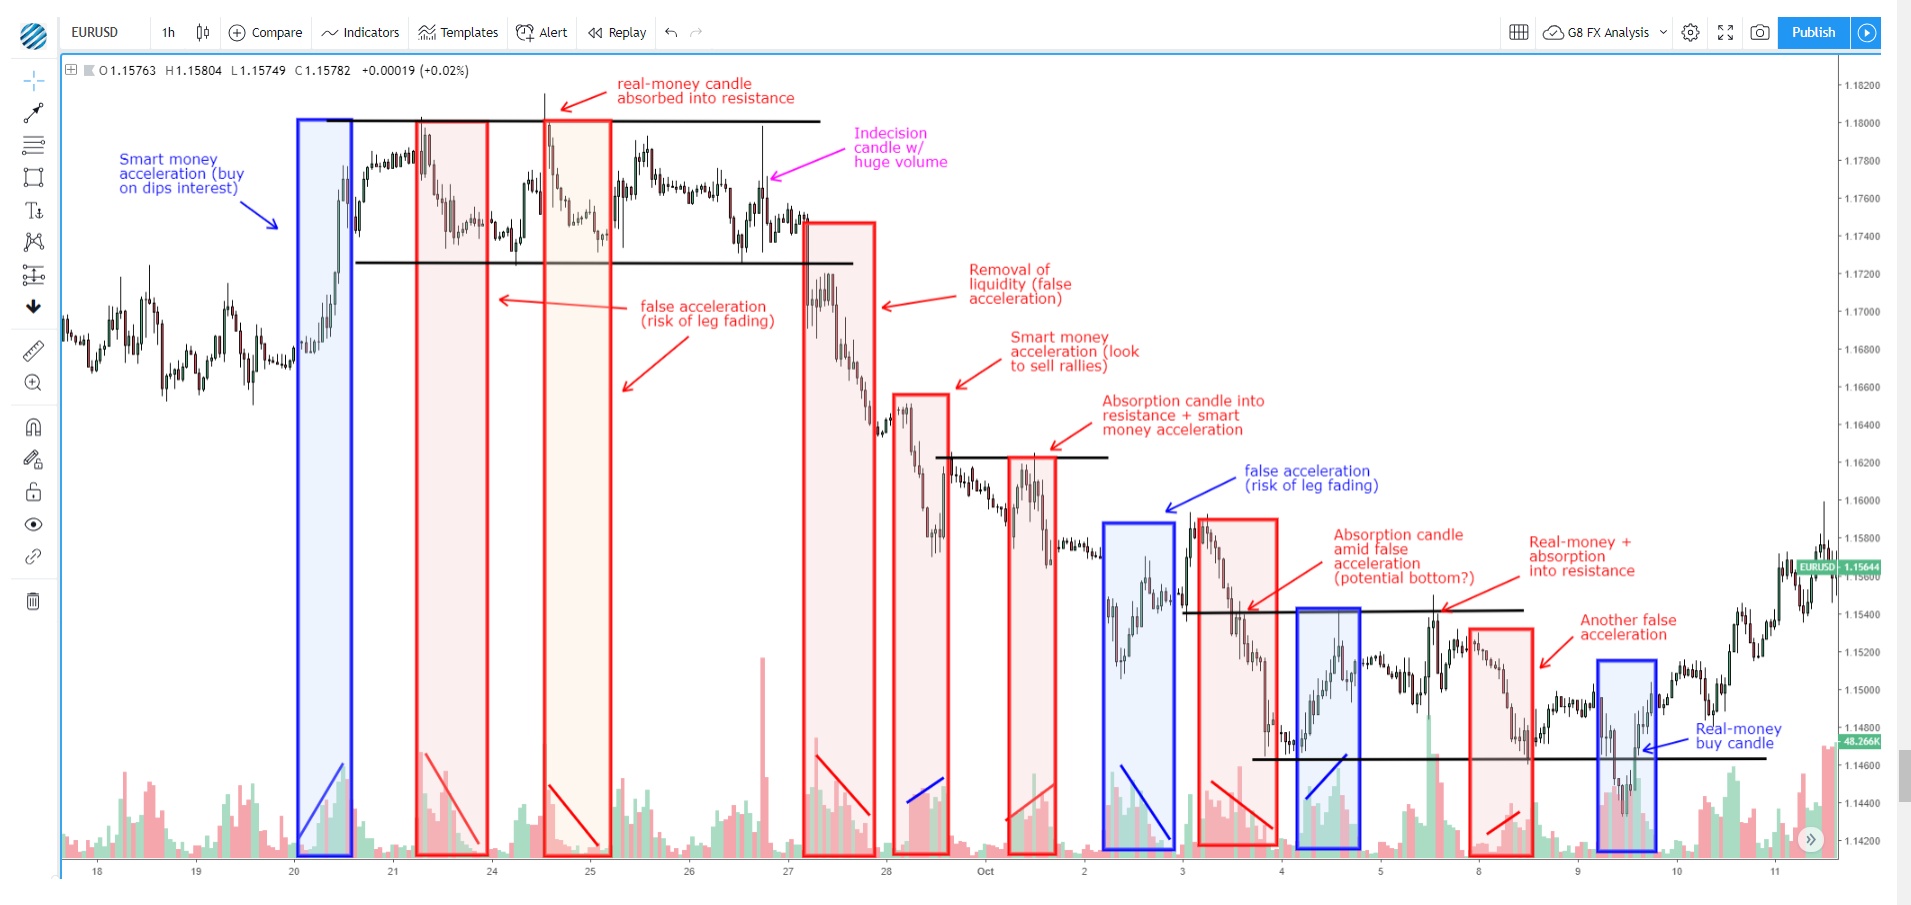
I also took the time to work out the latest volume structures in EUR/USD via Tradingview, based on the principles taught in this latest tutorial.
To learn more about the institutional / professional trading services provided by Global Prime, or to contact the firm, please click on the link below:
LiquidityFinder
LiquidityFinder was created to take the friction out of the process of sourcing Business to Business (B2B) liquidity; to become the central reference point for liquidity in OTC electronic markets, and the means to access them. Our mission is to provide streamlined modern solutions and share valuable insight and knowledge that benefit our users.
If you would like to contribute to our website or wish to contact us, please click here or you can email us directly at press@liquidityfinder.com.