

XAUUSD Price Action: A Beginner Buy Setup for Next Week
 ACY Securities - Ruffy Capacio
Key Takeaways:
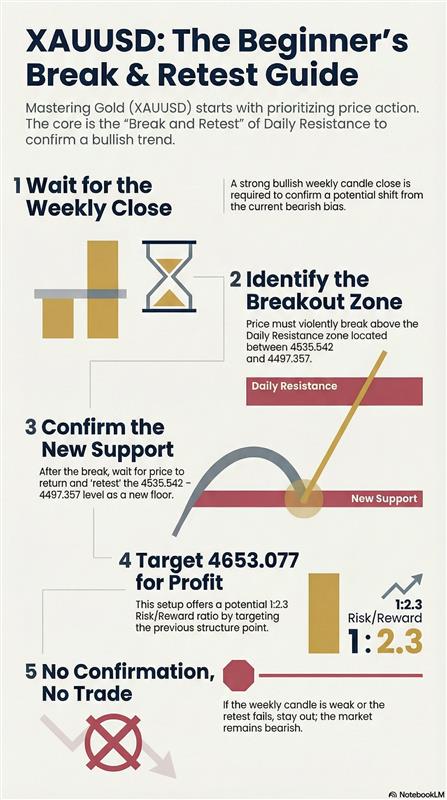
- Wait for the weekly candle to close to confirm a shift from the bearish trend.
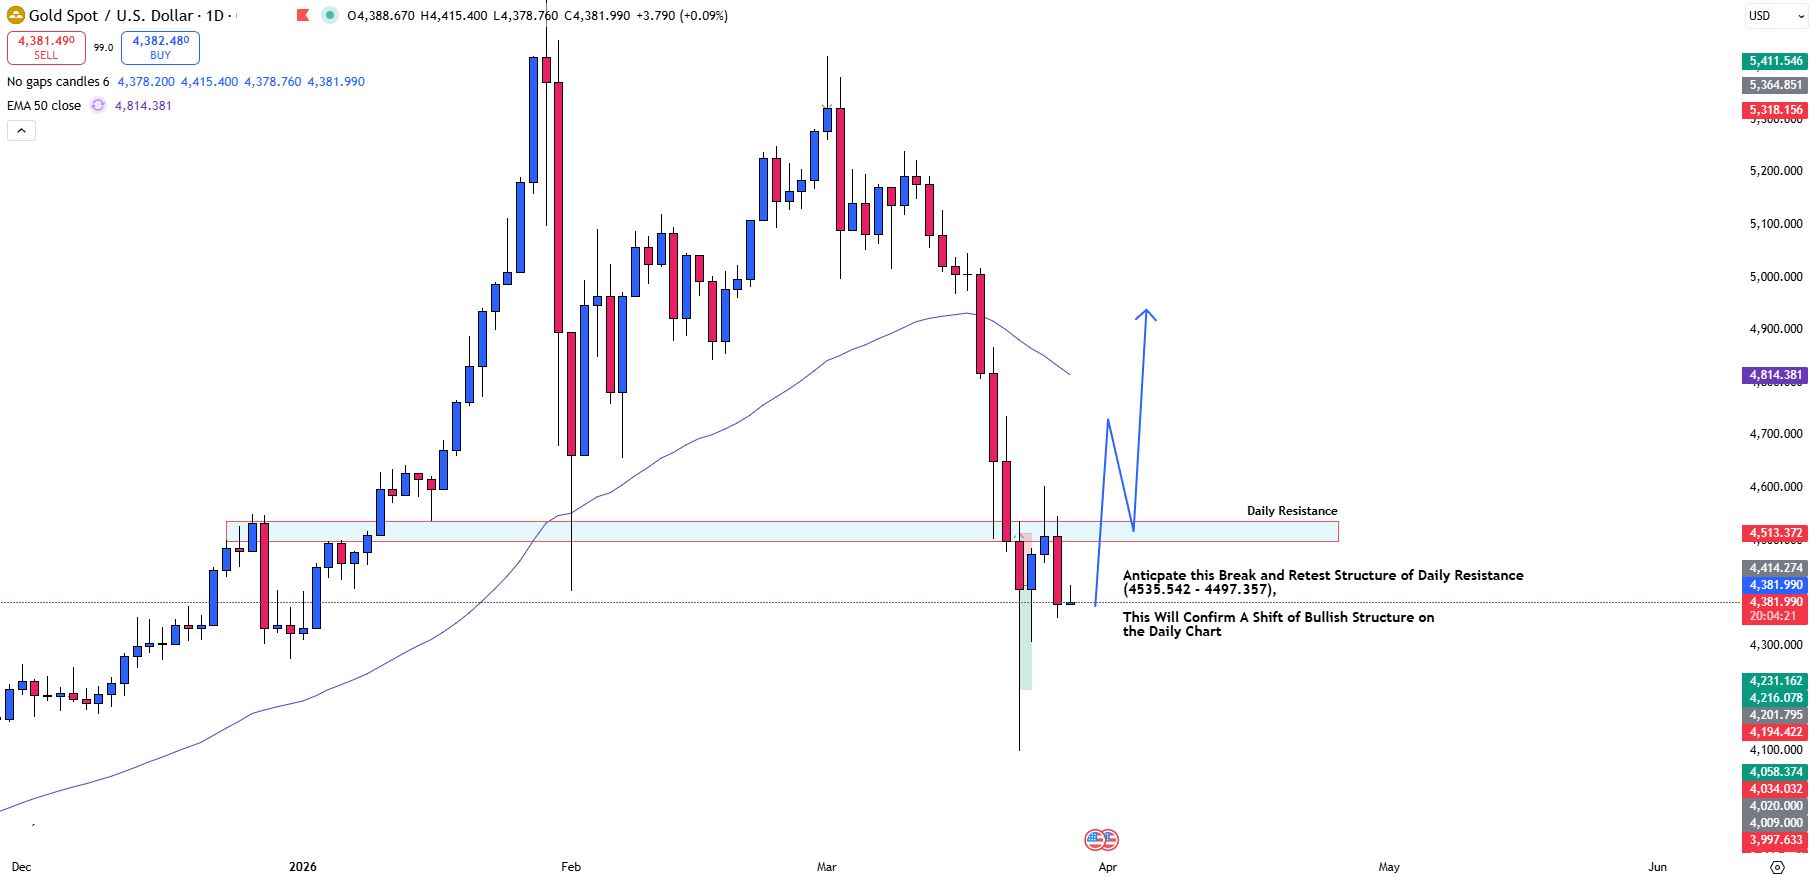
- Watch for a violent break above the daily resistance zone at 4535.542 - 4497.357.
- Buy only after a successful retest of this newly established support level.
- Target the 4653.077 level for maximum profit if the bullish setup holds.
What Does XAUUSD Price Action Tell Us on the Weekly Chart?

Many beginner traders rely too heavily on indicators. However, the real edge in trading comes from understanding price action and identifying key support and resistance levels.
In price action trading, focusing on simple levels is vital. I noticed that the current market structure reveals a very clear and obvious bullish bias. The gold market recently formed a potential higher low indicating that buyers are fighting back!
Weekly Chart Overview on XAUUSD: Watching Price Action for Bullish Confirmation
In forex trading, understanding price action and key levels is one of the most important skills for beginners. Instead of relying heavily on indicators, traders can analyze how price behaves around support and resistance zones.
On the Weekly Chart, I saw this price action shows a potential last move to create a potential lower high structure currently showing a bearish bias, with the market reacting from a key support area. This suggests that sellers are still active in the broader structure.
Strong Resistance EMA Rejection at 4100.771
- This is a strong support area where prices have reacted to before.
- The market recently showed EMA rejection in support zone, meaning sellers stepped in.
- This price action shows a potential shift downward, possibly forming a potential lower high structure to higher move after a lower high.
This Massive push could potentially happend next weekly, we wait and anticipate the move and catch it towards the lower timeframe/ chart.
What Does the Weekly Chart Tell Us About XAUUSD Price Action?
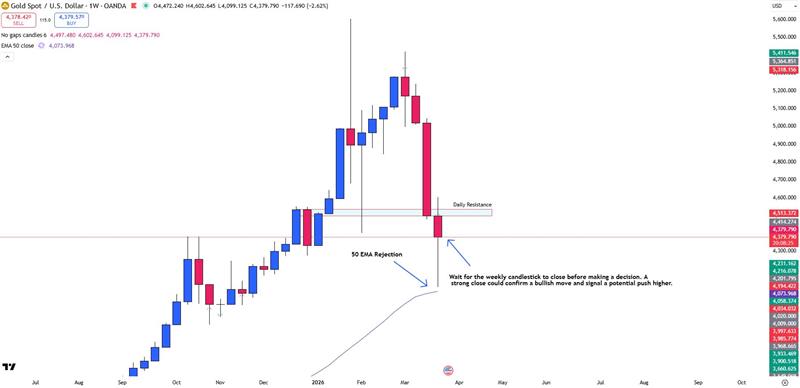
On the weekly timeframe, XAUUSD recently formed a lower low, indicating a bearish structure. However, price is now reacting strongly from a key support area and rejecting the 50 EMA, which could signal a potential shift
Wait for the weekly candle to close.
- A strong bullish close may confirm a potential move to the upside
- A weak close means the bearish trend may continue
For now, we are anticipating this move for next week, waiting for clear confirmation before taking action.
What is the Best Way to Trade This Break and Retest?
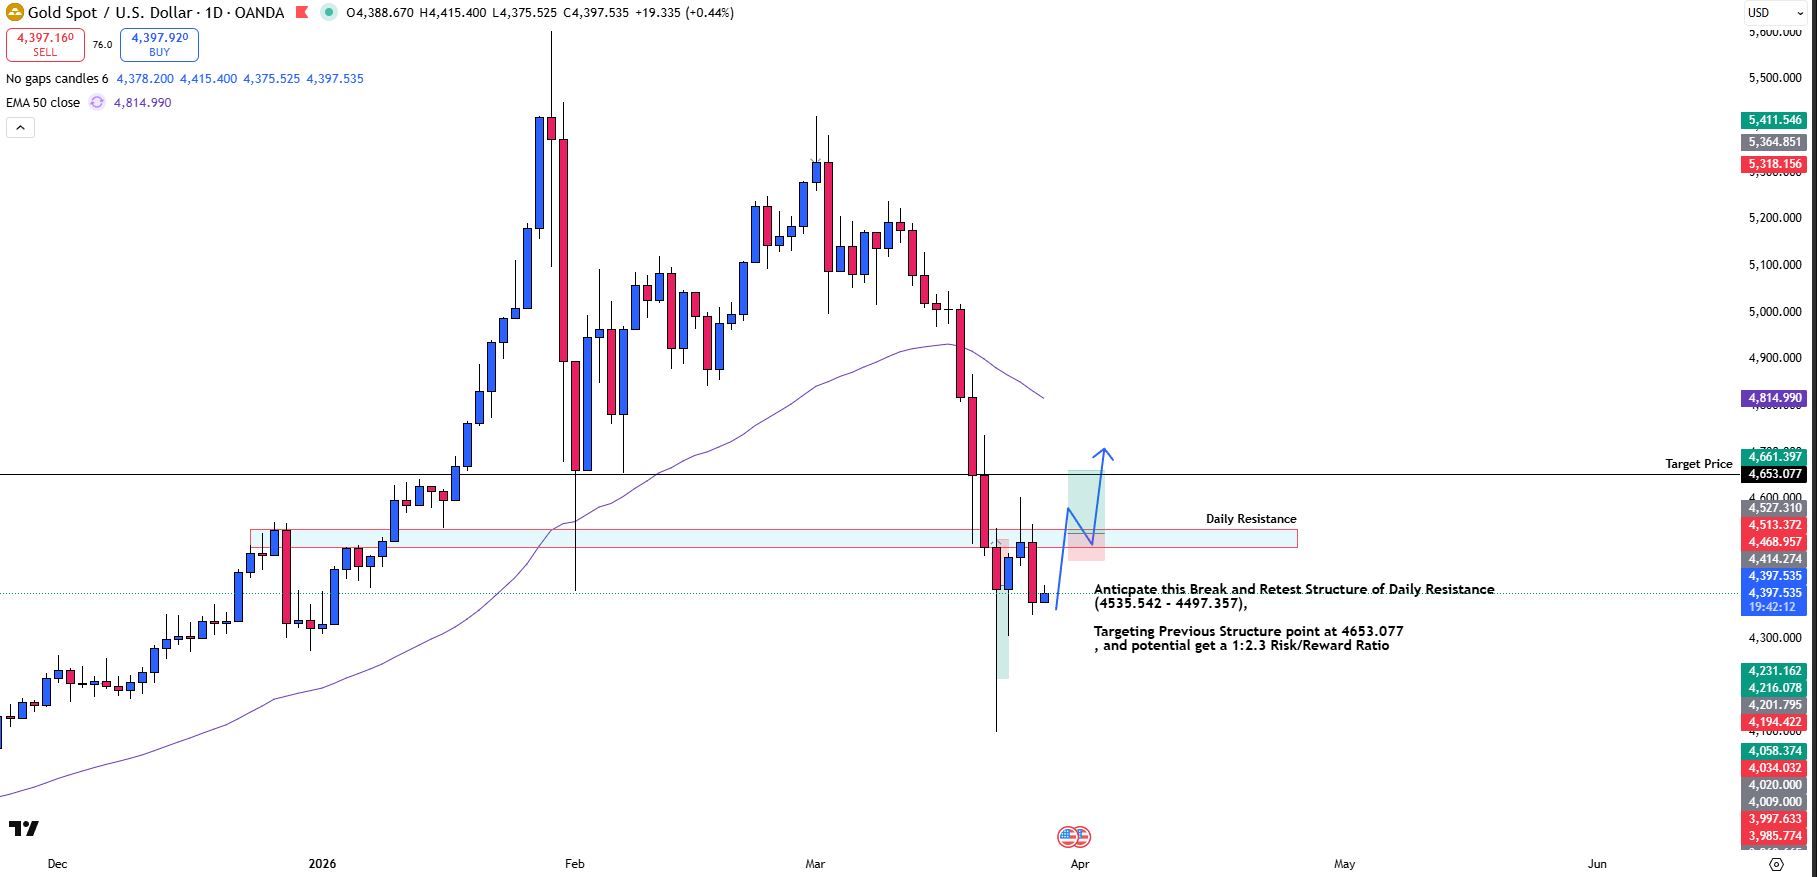
My preferred bullish case requires the price to violently break the daily resistance. After that breakout happens, you must watch for a successful retest of the 4535.542 - 4497.357 zone to confirm the newly found support. Once that floor holds, we target the 4653.077 level for maximum profit.
Key Levels to Watch
- Resistance (Break & Retest):
- Daily Resistance: 4535.542 - 4497.357
Potential Anticipation
Upside Anticipation: If bullish momentum continues, XAUUSD could break the daily resistance and retest the 4535.542 - 4497.357, and target 4653.077
How to Trade This XAUUSD: Simplest Action View?
Wait for price to break the resistance, then confirm the retest before buying.
If the weekly candle closes weak and price fails to break, stay out -trend remains bearish.
Key Points:
- Wait for price to break above the zone
- Wait for a retest and confirmation
- Then look for buy opportunities
Bullish Case (Preferred Setup)
- Weekly candle closes strong bullish
- Price breaks daily resistance
- Retest holds
Target: 4653.077
Possible strong upward momentum
Bearish Case (Alternative)
- Weekly candle closes weak
- Price fails to break resistance
Market may continue downtrend
Which Correlated Pairs Should You Watch?
Monitoring correlated markets can strengthen your analysis:
- XAGUSD (Silver): Frequently moves in tandem with gold.
- DXY (US Dollar Index): Features a strong inverse relationship with gold.
- US Oil: Heavily impacts inflation sentiment across the board.
- SPX: Serves as a primary risk sentiment indicator.
- BTC: Acts as a modern alternative risk asset comparison.
Conclusion & The ACY Edge
XAUUSD is currently at a critical decision point.
- The market is still bearish overall
- But early signs of a reversal are forming
- The best approach for beginners is to stay patient and wait for confirmation
No confirmation = No trade
If the setup plays out, next week could present a high-probability buying opportunity with strong upside potential.
Disclaimer:
Trading forex and derivative instruments involves substantial risk and may not be suitable for all individuals. Only use funds that you are prepared to lose. It is important to understand how these markets work and the risks involved before trading, and to seek independent financial advice if needed. All market analysis and insights shared are intended for educational and informational purposes only and should not be considered financial or investment advice. March 27, 2026
LiquidityFinder
LiquidityFinder was created to take the friction out of the process of sourcing Business to Business (B2B) liquidity; to become the central reference point for liquidity in OTC electronic markets, and the means to access them. Our mission is to provide streamlined modern solutions and share valuable insight and knowledge that benefit our users.
If you would like to contribute to our website or wish to contact us, please click here or you can email us directly at press@liquidityfinder.com.