Search Companies, News, Members & more
Terms of ServicePrivacy PolicySecurity PolicyLegal InformationCommunity GuidelinesSitemapsCookie Settings
2026 Copyright © Liquidity Finder Ltd. All rights reserved.
Liquidity Finder Ltd is incorporated in England and Wales, company number 10610740, registered address 167-169 Great Portland Street, Fifth Floor, London W1W 5PF, United Kingdom.
A New Model for Assessing Crypto Asset Liquidity
Published on Jan 24, 2023
Updated on Mar 7, 2026


By Conor Ryder, CFA
Kaiko Research
Market capitalization is one of the most commonly used metrics to legitimize the value of a cryptocurrency. We often hear of a token breaking into the top 10 ranking by market cap, with tokens like BNB making headlines after a move into the top 5, cementing it as a pillar in the crypto ecosystem. However, all it takes is a quick run through the top 20 or 30 tokens to realize not all market caps are created equal. FTT was a top 20 token pre-collapse and LUNA was once ranked in the top 10. While market cap works as a rough estimation of a token’s value, an asset is only as valuable as it is liquid.
That’s especially true when it comes to the liquidity crunch we have experienced in this current bear market. As I’ll demonstrate in this article, market cap as a metric becomes particularly misleading when investors equate it to the liquidity of a token.
Why a Liquidity Ranking System is Necessary
An absence of risk management, or more specifically liquidity management, seems to be a recurring theme in the multiple contagion crises we’ve seen this year. Whether that was Celsius holding an excessive amount of stETH it couldn’t redeem, or FTX holding about half of its balance sheet in FTT, a token which had virtually no liquidity or use cases.
A more thorough approach to valuing tokens is needed and liquidity must be a metric investors incorporate going forward to properly assess the risks of their holdings. Simply equating liquidity to market cap isn’t sufficient as there are some large outliers.
That being said, I present a liquidity ranking system to approximate the liquidity risk inherent in each of the major tokens. I will go into more detail on the methodology, but at a high level the three criteria involved in determining the ranking are: volume, market depth and spreads. Combining all three metrics and getting an average rank allows us to take a well-rounded gauge of liquidity for each token, and we can examine how that compares to market capitalization to find any discrepancies.
The below chart was the final result:
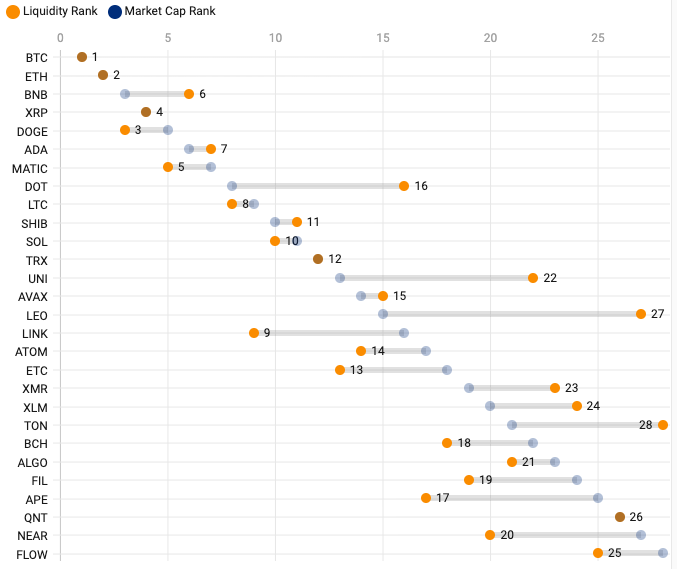
Chart: Conor Ryder, CFA - Source: Kaiko, Coinmarketcap. Ecludes stablecoins. Average 2% Market Depth, Daily Volume and Spreads used to determine liquidity ranking.
You should be able to spot the outliers already — I’ll look at them in more detail later in this article. For now I think it’s important to show you how I arrived at the liquidity rank at a granular level to demonstrate a more robust approach to liquidity management.
The Data
28 tokens were ranked by market capitalization, excluding stablecoins and wrapped tokens. For volume and market depth, data was aggregated across all active USD, BUSD, USDT, and USDC-denominated pairs on 16 of the most liquid centralized exchanges. This encompasses a majority of market activity.
For spreads, only data from Binance is used, which is the most liquid exchange across the widest range of markets. This is due to the problems that outliers can cause when taking an average spread. For example, just one illiquid market would cause the average spread to skyrocket, which wouldn’t reflect the token’s true liquidity.
As a final note, this liquidity analysis is a first iteration, and we are open for feedback. The following three criteria were used to arrive at a liquidity rank for each token:
1) Volumes
Historically, the most common metric used to measure a cryptocurrency’s liquidity is daily trade volumes, specifically on centralized exchanges. Volumes are strongly correlated to order book liquidity measures such as market depth and spread. Tokens that have higher trade volumes typically have deeper order books, which enables traders to trade an asset with limited impact on price. But, in crypto markets there can be discrepancies in this correlation. For example, wash trading or other types of market manipulation can make a token appear very liquid without having deep order books, which means that trade volume alone is not adequate to fully assess liquidity.
Market capitalization and volume tend to have a strong correlation, but there are also clear discrepancies which is an indicator that a token is not as liquid as it appears.
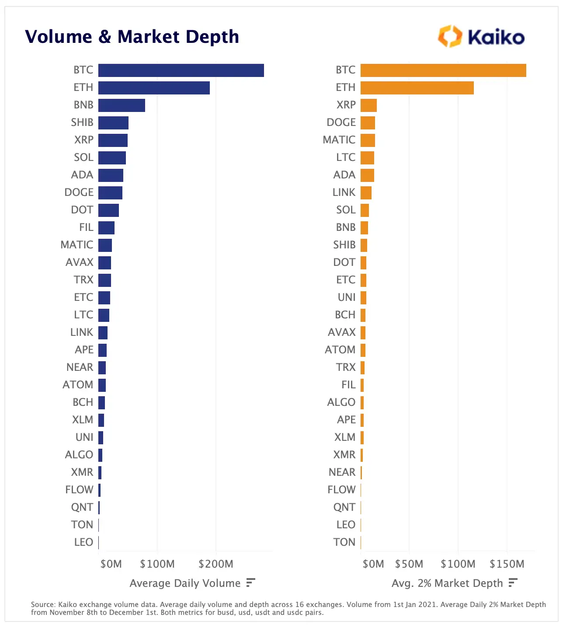
The standout tokens volume-wise are:
- SHIB: A strong showing for the dog themed token, SHIB comes in fourth place for daily volumes, beating out several other higher market cap tokens, including DOGE.
- LEO: The exchange token of Bitfinex comes in dead last for volumes traded, despite possessing a middle-of-the-pack market cap.
- FIL: Filecoin’s trading volumes are significant on centralized exchanges, commanding an average daily volume of $29m, placing it in 10th for volumes.
Below, we chart the ranking for both volume and market depth for each token analyzed.
2) Market Depth
Market depth is one of, if not the best indicator of liquidity in the market as it gives us an exact dollar figure of the liquidity available within a certain % range of the price. Market depth considers the overall level and breadth of open orders and is calculated from the number of buy and sell orders at various price levels on each side of the mid price. In this analysis, 2% market depth is taken.
If market depth is “deep” for a given token, this means that there is sufficient volume of open orders on either the bid or ask side, which ultimately makes it easier to exchange the asset at prices reflecting its intrinsic value. The weaker a market’s depth, the easier it is for larger market orders to move the price.
The standout tokens above for market depth are:
- LINK: Despite only being ranked 16th in market cap (excluding stablecoins), Chainlink’s token depth is impressive, ranking 8th overall.
- BNB: Arguably the most surprising considering it is the native token of the exchange with the most liquidity, BNB ranks 10th overall for market depth, compared to a market cap ranking of 3.
- LTC: Litecoin depth comes in at $15m, giving it the 6th best depth out of all tokens measured.
3) Spreads
In traditional finance, the bid-ask spread is the most frequently used indicator when assessing a market’s liquidity. The spread is calculated by taking the difference between the best bid and the best ask on an asset’s order book at a moment in time.
Typically, the smaller the spread the more liquid the market. Wide spreads indicate that liquidity is weaker for an asset, and that it will be more difficult to exchange the asset at stable prices, making it an important metric when assessing the overall liquidity of an asset from an investment standpoint. The average spread for the month of November on Binance is charted below for each asset and is sorted from tightest spread to widest.
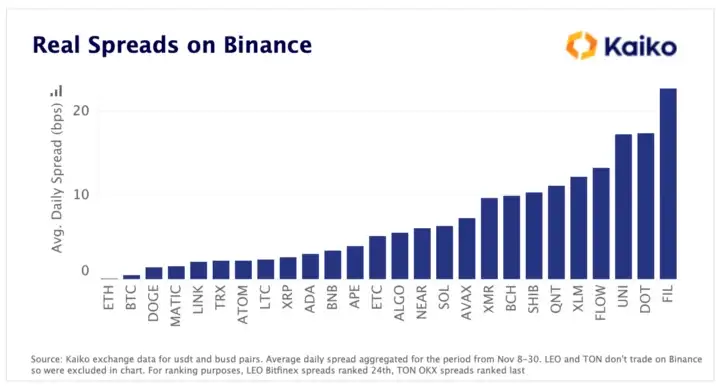
Interestingly, ETH has tighter spreads on Binance than BTC, but that can be explained by the removal of BTC trading fees on most pairs while ETH fee removal on the exchange was only temporary over the summer. This led to market makers widening their spreads offered on BTC pairs to compensate for the zero fees.
Some of the standout tokens here are:
- DOT: Ranked 8th in market cap, Polkadot’s token has the second widest spreads out of the tokens measured on Binance.
- DOGE: The infamous dog token beats out the likes of BNB, ADA and XRP with the third tightest spreads on Binance.
- ATOM: Ranks an impressive 7th in spreads despite only ranking 17th in market cap.
Total Liquidity Ranking
Putting the three metrics together and getting an average allows us to arrive at an overall liquidity rank for each token. In the chart below we can see the contribution of each metric towards the overall ranking of a token.
For Volume and Depth, the highest ranking token will have the highest quantity for each measure. For Spread, the highest ranking token will have the lowest measure (narrow spreads = more liquid).
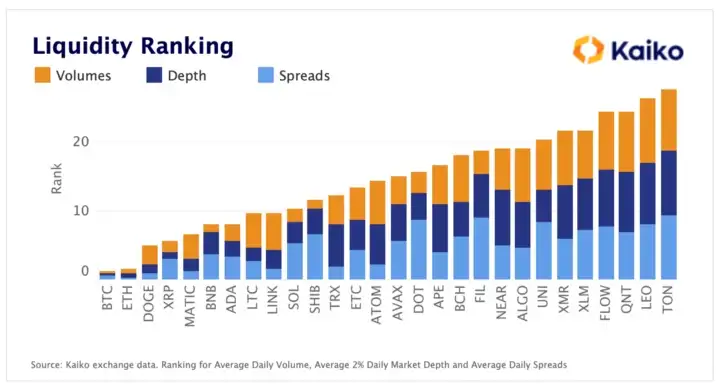
BNB, for example, only ranks 6th due to its poor ranking in depth and spreads, despite commanding the 3rd most volumes of any tokens. LINK performed well in the spreads and depth metrics, but was let down by its lower trading volumes on centralized exchanges to arrive at, a still impressive relative to its market cap, 9th in liquidity rank.
Winners & Losers
That brings us up to speed with the criteria and metrics to arrive at the liquidity rank. Now we can refer back to the first chart and take a closer look at the tokens rank well, or poorly, when comparing their liquidity to their market cap. The below chart illustrates the differences between the two rankings for each token.
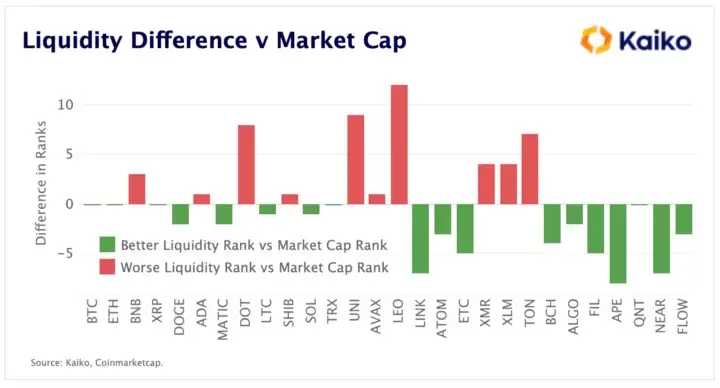
Winners:
- DOGE ranks 5th in market cap of the tokens chosen, but finished an impressive 3rd in the liquidity ranking. This impressive feat for a meme coin can be attributed to having the third tightest spreads and the fourth best market depth.
- LINK ranked as the 9th most liquid token thanks to its strong scores in spreads and depth. Chainlink’s token is only ranked 16th in market cap and is therefore more liquid than its market cap implies.
- ETC & BCH liquidity was impressive relative to their market cap which should be reassuring for investors in the hard forks. Both made headlines last week as Coinbase Wallet stopped support for the chains.
- Lower market cap tokens ALGO, FIL, APE NEAR and FLOW all are more liquid than their ranking suggests. APE was the largest outlier of the tokens that were more liquid than their market cap implies, ranking as the 17th most liquid token and the 25th largest by market cap. All sitting outside the top 20, perhaps it’s the larger market cap tokens that warrant more caution when it comes to liquidity management.
Losers:
- BNB was admittedly less liquid than I would have predicted. Being the token of the highest liquidity exchange, BNB underperformed in the depth and spread metrics in particular. BNB ranked as the 6th most liquid token, 3 places worse than its market cap suggests.
- DOT was an underperformer from a liquidity standpoint, only ranking as the 16th most liquid token despite being the 8th largest token by market cap. As we saw earlier, DOT was let down by its second last finish in the spread rankings.
- UNI & LEO were the two largest variations from their market cap to the downside. In UNI’s defense, its primary use is not on centralized exchanges and it functions as a DeFi native token. Seeing it perform poorly on centralized liquidity metrics was therefore not a surprise. LEO on the other hand falls into the same category as BNB and FTT. Its primary use case is very niche as an exchange token that offers benefits to users on that exchange, in this case Bitfinex. The liquidity of LEO is a considerable concern for token holders as it finished second last in our liquidity ranking despite being the 14th largest token by market cap.
- Top 15 market cap tokens seem to be the most misleading from a liquidity point of view. As the largest tokens, investors are more likely to assume all are very liquid and their liquidity risk is low. We can see from our liquidity ranking that this doesn’t hold — 7 of the top 15 tokens had lower liquidity than their standing in market cap rankings suggests. These tokens have the highest potential to mislead investors so it is imperative that their liquidity risk is properly accounted for.
Conclusion
Simply assuming a token is as liquid as its market cap suggests is negligent and lazy. A more thorough approach to valuation is needed that factors in liquidity risk as part of the investment process. This liquidity risk needs to take into account factors such as volume, market depth, and spreads to get a more complete picture of liquidity.
While not completely foolproof, the liquidity ranking system presented in this article provides a more comprehensive way of evaluating the risks of holding a particular token by factoring in the various aspects of liquidity. Outliers such as DOT, BNB, and LEO highlight the need for investors to carefully consider the liquidity of their holdings as part of both the investment process and ongoing risk management of positions.
Learn more about Kaiko's products for enterprises here.
Share this article
Comments
Most Recent
Find The Right Partners for
Your Trading Business
Sign up and join over 5,000 professional members who receive personalized news alerts, curated professional connections, and more for free!

Discover whether KuCoin is still “The People’s Exchange” in 2026. This in-depth KuCoin review breaks down fees, KYC, security, Proof of Reserves, supported coins, deposits/withdrawals, futures, margin, Earn and the platform’s standout free trading bots — plus who it’s best for (and who should avoid it).
Gas fees can be the most confusing part of using Ethereum and other blockchains. This guide explains what gas fees are, why they exist, how costs are calculated (including EIP-1559’s base fee and priority tip), and the key factors that drive price spikes. You’ll also learn practical ways to reduce fees using gas trackers, smarter timing, batching, and Layer 2 networks like Arbitrum, Optimism, Polygon and zkSync.

Generating and sustaining liquidity requires a strategic approach across centralized exchanges, decentralized pools, and market-making relationships. This guide covers every stage of the process for crypto projects.
This guide covers how proof-of-stake works, the best assets to stake, liquid staking protocols, and the risks you need to understand before committing funds.

S&P Global Ratings gave Tether (USDT) the weakest Stablecoin Stability Assessment. Olaf Ransome breaks down what drives stablecoin risk—asset backing, custody/correspondent chains, transparency and reporting.
Decentralized exchanges (DEXs) allow peer-to-peer trading without intermediaries. This guide covers how AMMs work, how to connect a wallet, understand liquidity pools, manage slippage, and trade safely across Ethereum, BNB Chain, and Solana.

Gold-i CEO Tom Higgins explains why most crypto exchanges are still retail-first and what must change to win institutional flow — including FIX support, independent custody, predictable liquidity, and pricing models that reward aggregator-driven volume.

Olaf Ransome explores how stablecoins offer faster, 24/7 payments and banking access where traditional rails fall short, with insights from industry experts: 6 reasons Stablecoins beat traditional payments
Create Your FREE Account
Get access to latest news, updates, real-time data, brokerage and trading firm insights and customized information feeds.

USD/CAD cools inside a tight bull flag as CPI, the BoC and a little-known tariff deadline all land in the same week.

Former TradingView CEO Oleg Mukhanov joins GoCharting as President and COO, with ex-TradeStation chief Salomon Sredni as Chairman, alongside Long Ridge investment.

Databento, the market data platform for modern finance, has raised a $97 million Series B led by NEA, with participation from DRW Venture Capital, Redpoint Ventures and Tribe Capital. The oversubscribed round drew over $300 million in demand and will fund global infrastructure and data centre expansion.

CME Group has announced Treasury Link, an industry-first functionality connecting CBOT Treasury futures and BrokerTec cash Treasuries via CME Globex. Leveraging FX Link technology, the service enables single-submission spread trading, eliminating legging risk, and is expected to launch in Q4 2026, pending regulatory review.

Marex Group has agreed to acquire Singapore-based Bright Point International, adding roughly $800m in client balances and over 70 staff across Asia and Europe. The deal expands Marex's clearing footprint in Asia Pacific and improves client access to Chinese markets, pending regulatory approval, expected to close by late 2026 or early 2027.

Read our latest Gold XAU/USD forecast update. See exactly how the $4,200 resistance triggered a massive selloff using proven Gold price action strategies.

Exness has welcomed Arab trader, educator and author Hussain Almatrouk to Exness Team Pro, its global network of elite traders and mentors. Active since 2009, Almatrouk brings a background in educational technology and a following of over 45,000 on Instagram, strengthening the broker's presence across the GCC.

Vantage Markets has secured a Capital Market Authority (CMA) Category 5 licence in the UAE, strengthening its regional presence across MENA. CEO Marc Despallieres said the licence underscores the firm's long-term commitment to the region as traders demand greater transparency and operational confidence.

XS.com has appointed Emily A. Aghajanyan as Regional Director for Emerging Markets, tasking her with leading the broker's growth strategy across high-growth regions. She joins from Alpari, bringing over a decade of leadership experience across the Middle East, North Africa, and other emerging financial markets.

Ondo Perps has launched a permissionless perpetual futures platform allowing tokenised equity holdings and stablecoins as collateral, offering 24/7 trading with up to 20x leverage on US stocks, ETFs, and commodities. Built on Ondo Finance's technology, it targets non-US investors seeking leveraged market access.
Feed