Search Companies, News, Members & more
Terms of ServicePrivacy PolicySecurity PolicyLegal InformationCommunity GuidelinesSitemapsCookie Settings
2026 Copyright © Liquidity Finder Ltd. All rights reserved.
Liquidity Finder Ltd is incorporated in England and Wales, company number 10610740, registered address 167-169 Great Portland Street, Fifth Floor, London W1W 5PF, United Kingdom.

-
MACD is a professional tool available on all MetaTrader platforms.
-
Traders use MACD to predict future market trends, prices and expected market momentum
-
It was designed to show changes in the strength, direction, momentum, and duration of a stock price’s trend
-
Invented in the 70s, MACD indicators remain one of the most popular tools used by professional traders today
An introduction to the MACD Indicator
The MACD indicator is a popular trading tool used to analyse markets from a technical perspective on MetaTrader online trading platforms. These popular charts help traders make more informed decisions by demonstrating a financial instrument’s potential trend changes or price movements. These are typically displayed through showing the difference between moving trade signal averages on charts that are referred to as ‘histograms’. “MACD” stands for Moving Average Convergence Divergence and was created by Gerard Appel in the late 1970’s to show changes in the strength, direction, momentum, and duration of a stock price’s trend. The MACD indicator is available on MetaTrader 4 and MetaTrader 5 and can be added to the charts of any tradable assets, such as shares, currency pairs, commodities, indices, and cryptocurrencies.
MACD is not only an old indicator but also a popular one
How to use MACD components
The MACD indicator consists of two components: the MACD line and the signal line. These lines are then displayed in MACD histogram charts through a series of bars that oscillate above and below the zero line, which indicates the relationship between the two moving averages. The MACD line is used to reflect market momentum and is calculated by subtracting a 26-period exponential moving average (EMA) from a 12-period exponential moving average. The signal line gives indications on potential buying and selling trade signals by examining 9 periods of the exponential moving average of the MACD line.
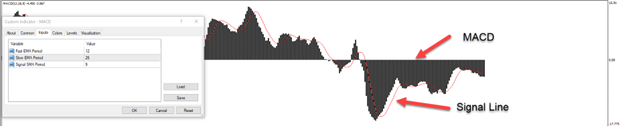
How the MACD indicators are calculated
The twin components of the MACD indicator work together using the following equations to create the final shape of the indicator’s histogram chart. These are automatically calculated onto live trading charts, as the MACD indicator updates itself at the end of every selected time frame when each time period closes.
When the indicator’s numbers are set to default, they will appear as (12, 26, 9) based on the following calculation:
MACD Histogram: Value of 26 Exponential Moving Average – 12 Exponential Moving Average
Signal Line = 9 periods of MACD line
The benefits of trading with MACD indicators
When it comes to technical analysis, the MACD indicator is one of the most useful tools out there because it is relatively easy to use and is extremely effective in identifying market trends and market momentum.
I
nvestors, traders and speculators generally use MACD indicators to enhance their trading strategies in two ways. The first is to use technical data to identify new trading trends, and the second way is to detect potential trend reversals.
- Determining new trends: On the MACD histogram, the zero level is used to determine trends. When price averages are above the zero level, it may indicate that an asset’s price is rallying and signal to traders that a bearish trend will follow. However, when MACD indicates trades are falling below the zero level, it suggests that prices may drop on that particular asset.
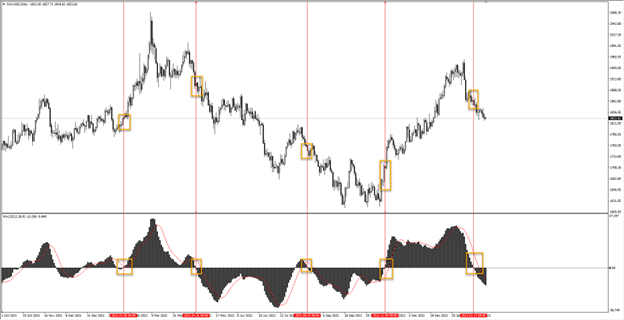
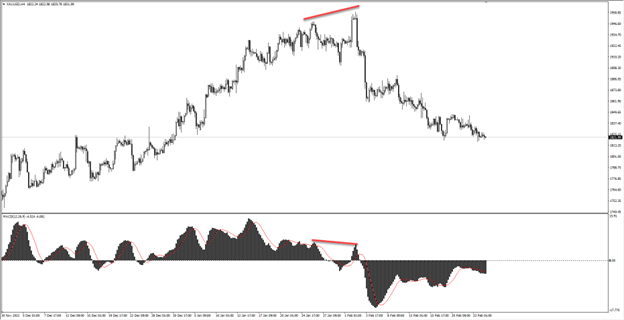
- Identifying Trend Reversals: Traders can identify when a market will switch from a bullish to bearish trend when there is a clear price divergence by comparing the top levels of a price against its MACD indication. Likewise, they can estimate a trend will reverse from bearish to bullish when there is a price divergence between the asset price bottoms and the MACD indicator bottoms.
The price divergence is a difference between the price of the financial asset and the MACD indicator in the formation of tops or bottoms, meaning that the pair forms a top and the indicator forms another top, then they fall, and then the pair rises again to break the previous top, but the MACD indicator records a top less than the price and does not break the last top, for example.
It is important to note that like most technical analysis indicators, the MACD indicator is not always accurate and may provide many false and misleading signals, especially regarding volatile assets or during weak or sideways price movement. Although many traders use the MACD indicator along with other indicators to reduce risks and confirm signals, there are no guarantees in trading, and it is always recommended to trade within a comfortable risk appetite.
Author, Ahmed Azzam, Regional Financial Market Analyst, Equti.com
Ahmed is an accomplished and highly respected professional in the financial industry, with a proven track record as a successful trader, trainer, and market analyst. Leveraging his extensive knowledge and expertise in both fundamental and technical analysis, Ahmed has accumulated over 14 years of experience conducting in-depth research and analysis within the financial markets.
As a chartist and fundamentalist, Ahmed has held critical market analyst positions in some of the most reputable firms, including Capital Investments, Noor Al-mal, Falcon Brokers, Fx River, and Borsaat. His exceptional analytical skills and market insights have enabled him to consistently provide valuable recommendations and insights to clients.
Throughout his distinguished career, Ahmed has made significant contributions to the success of numerous educational and analytical initiatives. His ability to provide actionable insights and strategic advice has resulted in his recognition as a thought leader in the industry. Ahmed's unwavering commitment to excellence and his dedication to driving value for clients make him an invaluable asset to any organization.
Share this article
Comments
Most Recent
Find The Right Partners for
Your Trading Business
Sign up and join over 5,000 professional members who receive personalized news alerts, curated professional connections, and more for free!

LiquidityFinder's Sam Low sits down with Maria Pittashi, General Manager of Cyprus-based broker technology firm PLUGIT, to discuss its modular YOONIT platform, the Dynamic Margin tool brokers ask for by name, fixed-fee versus volume-based pricing, the hidden cost of manual KYC, and the AI features coming next.
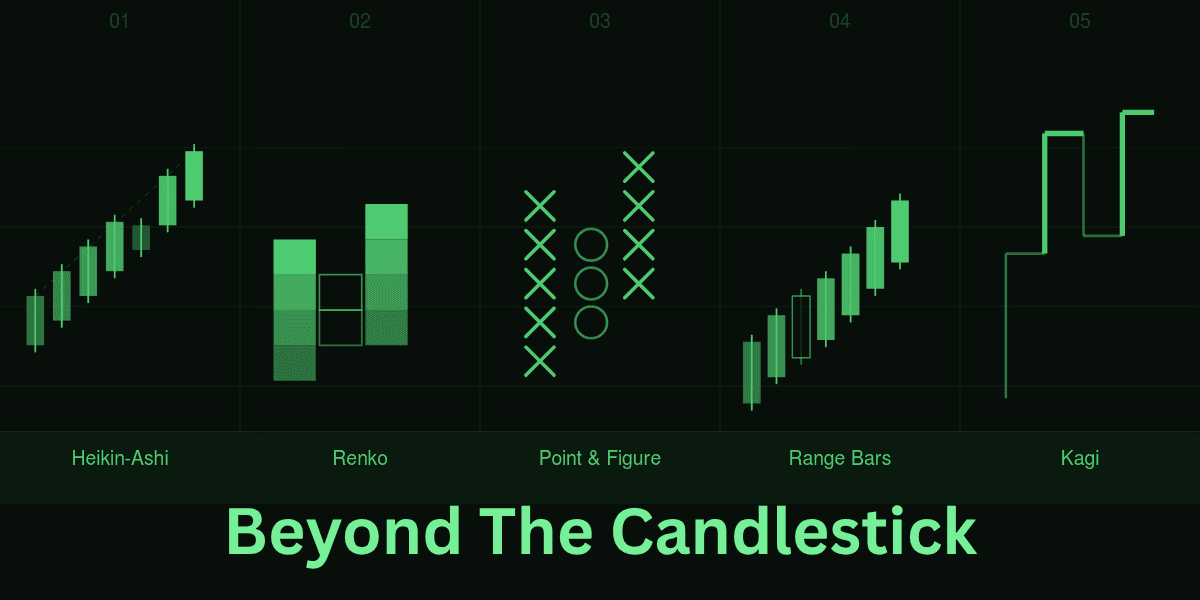
Candlestick charts dominate trading screens worldwide — but they are not always the sharpest tool available. This guide explores five proven alternatives: Heikin-Ashi, Renko, Point and Figure, Range Bars and Kagi. Learn how each works, what it reveals that candles can obscure, and how to integrate any of them into your existing workflow without disruption.
n in-depth review of TMGM (TradeMax Global Markets), the ASIC-regulated ECN broker offering raw spreads from 0.0 pips, MT4 and MT5, copy trading via HUBx and ZuluTrade, and 24/7 multilingual support across four regulated jurisdictions. Find out if TMGM belongs on your shortlist.

Gold at record highs, oil as a meme stock, and crypto exchanges eyeing your clients. Watch our expert panel - Gold-i, Your Bourse, Tapaas and Devexperts - discuss broker risk management, , AI trading and the MetaTrader debate.

A complete comparison of MT4, MT5, cTrader, and modern proprietary trading platforms.
The definitive list of genuine prop trading firms and funded account challenges for 2026.

We examine Plus500's spreads, regulatory standing, platform capabilities, and who it actually makes sense for in 2026.

Keep an eye on key upcoming economic events, announcements, and news. Plus, set up filters in a few clicks, selecting for event importance and affected currencies.
Create Your FREE Account
Get access to latest news, updates, real-time data, brokerage and trading firm insights and customized information feeds.

Databento, the market data platform for modern finance, has raised a $97 million Series B led by NEA, with participation from DRW Venture Capital, Redpoint Ventures and Tribe Capital. The oversubscribed round drew over $300 million in demand and will fund global infrastructure and data centre expansion.

CME Group has announced Treasury Link, an industry-first functionality connecting CBOT Treasury futures and BrokerTec cash Treasuries via CME Globex. Leveraging FX Link technology, the service enables single-submission spread trading, eliminating legging risk, and is expected to launch in Q4 2026, pending regulatory review.

Marex Group has agreed to acquire Singapore-based Bright Point International, adding roughly $800m in client balances and over 70 staff across Asia and Europe. The deal expands Marex's clearing footprint in Asia Pacific and improves client access to Chinese markets, pending regulatory approval, expected to close by late 2026 or early 2027.

Read our latest Gold XAU/USD forecast update. See exactly how the $4,200 resistance triggered a massive selloff using proven Gold price action strategies.

Exness has welcomed Arab trader, educator and author Hussain Almatrouk to Exness Team Pro, its global network of elite traders and mentors. Active since 2009, Almatrouk brings a background in educational technology and a following of over 45,000 on Instagram, strengthening the broker's presence across the GCC.

Vantage Markets has secured a Capital Market Authority (CMA) Category 5 licence in the UAE, strengthening its regional presence across MENA. CEO Marc Despallieres said the licence underscores the firm's long-term commitment to the region as traders demand greater transparency and operational confidence.

XS.com has appointed Emily A. Aghajanyan as Regional Director for Emerging Markets, tasking her with leading the broker's growth strategy across high-growth regions. She joins from Alpari, bringing over a decade of leadership experience across the Middle East, North Africa, and other emerging financial markets.

Ondo Perps has launched a permissionless perpetual futures platform allowing tokenised equity holdings and stablecoins as collateral, offering 24/7 trading with up to 20x leverage on US stocks, ETFs, and commodities. Built on Ondo Finance's technology, it targets non-US investors seeking leveraged market access.

M1X Global has closed an oversubscribed Seed round led by Paradigm, with Breed VC participating, taking total funding to $8.5 million. The sovereign infrastructure firm, behind the Marshall Islands' USDM1 bond, aims to expand institutional adoption of programmable, blockchain-based sovereign debt instruments.

Master the best beginner technical trading systems using simple price action principles. Learn how to trade Gold, Forex, Crypto, and Indices with confidence.
Feed