Search Companies, News, Members & more
Terms of ServicePrivacy PolicySecurity PolicyLegal InformationCommunity GuidelinesSitemapsCookie Settings
2026 Copyright © Liquidity Finder Ltd. All rights reserved.
Liquidity Finder Ltd is incorporated in England and Wales, company number 10610740, registered address 167-169 Great Portland Street, Fifth Floor, London W1W 5PF, United Kingdom.
Triangle Patterns in Forex Trading
Published on Mar 28, 2023
Updated on Mar 7, 2026

-
Triangle patterns are continuation patterns that form a triangle shape on the chart
-
There are three basic types of triangle patterns: ascending, descending and symmetrical
-
These triangles can be used to predict how the price will move next
Introduction to triangle patterns
Predicting prices ahead of time helps traders make more informed decisions on whether they should buy or sell an asset. Charts often start to form shapes such as triangles or head and shoulder patterns. Triangle patterns are particularly popular, as they have historically been successful in using past data to accurately predict future price movements.
Triangles are like a coiled spring ready to release its energy in one direction or another, making them a valuable pattern to watch for in forex trading
The triangle pattern is also referred to as a continuation pattern. Continuation patterns indicate that the sideways price action on the chart indicates a momentary pause in the current trend, and that the next move will be in the same direction as the trend that preceded the formation. This means if you can keep your trade open with sufficient funding over a longer period of time, a periodic drop in prices might rebound to rising prices again.
Triangle patterns will have their widest point at the beginning of their formation, and then the trading range will narrow to form a triangle point when the market starts to trade sideways. Triangle patterns need at least two upside points and two downside points to be formed.
It is important to know if a market is following a continuation pattern (like triangles) or a reversal pattern. Another factor you can look for to distinguish these patterns is duration.
Reversal patterns usually take longer to build and represent major trend changes. Continuation patterns are usually shorter in duration and are more accurately classified as near-term or intermediate patterns, due to their momentary nature.
However, we intentionally use the word “usually” because there will always be exceptions that break these rules due to the volatile nature of markets. Even the grouping of price patterns into different categories can sometimes become tenuous, as although triangles are usually continuation patterns – they can sometimes form reversal patterns as well. It always pays to keep a close eye on market movements that may impact open trades and to maintain a healthy risk appetite for your investments.
Ascending, descending and asymmetrical triangle patterns
There are three basic types of triangle patterns that can be formed on the chart based on the price movements of an asset:
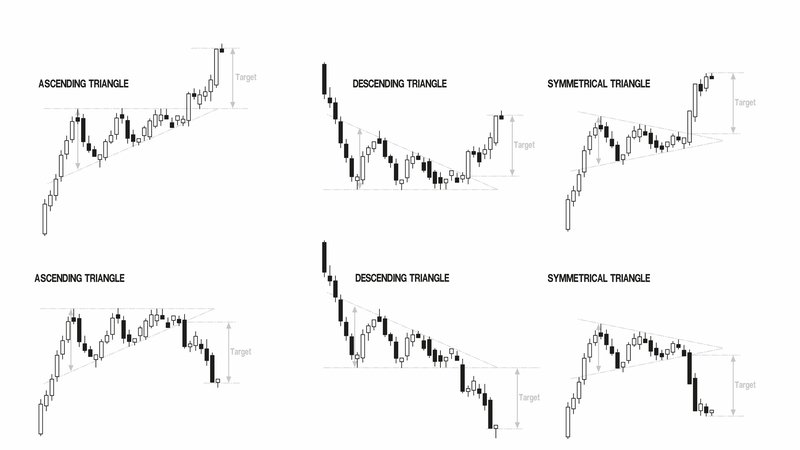
- Ascending triangle: The ascending triangle pattern will appear in an uptrend. The lower line of the triangle is drawn by an upward trend line on the bottoms, while the upper line of the triangle is on equal peaks. The ascending triangle indicates an increase in the number of buyers, which may push the price up.
- Descending triangle: The descending triangle pattern appears in a downtrend. The upper line of the pattern is drawn to form a descending trend line, while the lower border of the triangle is on equal bottoms. The descending triangle suggests an increase in the number of sellers and that may lead to the price declining.
- Symmetrical triangle: The symmetrical triangle pattern indicates a state of indecision in the market and the lack of control by buyers or sellers over the price. The breakout of the triangle pattern is often associated with the previous price trend.
How to use triangle patterns
As the triangle patterns are used to predict price movements, they can be helpful tools for traders to decide whether to enter or exit the market. Usually, traders will buy or sell the asset when the price of it breaks above or below the triangle pattern.
When the price breaks out of the triangle pattern, the distance between the widest points in the triangle can be measured to determine the future target for the price.
A stop loss order can also be placed below or above the triangle pattern to encourage risk management, because the price return to the triangle zone would indicate a failure of the predicted continuation pattern.
Author, Ahmed Azzam, Regional Financial Market Analyst, Equti.com
Ahmed is an accomplished and highly respected professional in the financial industry, with a proven track record as a successful trader, trainer, and market analyst. Leveraging his extensive knowledge and expertise in both fundamental and technical analysis, Ahmed has accumulated over 14 years of experience conducting in-depth research and analysis within the financial markets.
As a chartist and fundamentalist, Ahmed has held critical market analyst positions in some of the most reputable firms, including Capital Investments, Noor Al-mal, Falcon Brokers, Fx River, and Borsaat. His exceptional analytical skills and market insights have enabled him to consistently provide valuable recommendations and insights to clients.
Throughout his distinguished career, Ahmed has made significant contributions to the success of numerous educational and analytical initiatives. His ability to provide actionable insights and strategic advice has resulted in his recognition as a thought leader in the industry. Ahmed's unwavering commitment to excellence and his dedication to driving value for clients make him an invaluable asset to any organization.
Share this article
Comments
Most Recent
Find The Right Partners for
Your Trading Business
Sign up and join over 5,000 professional members who receive personalized news alerts, curated professional connections, and more for free!
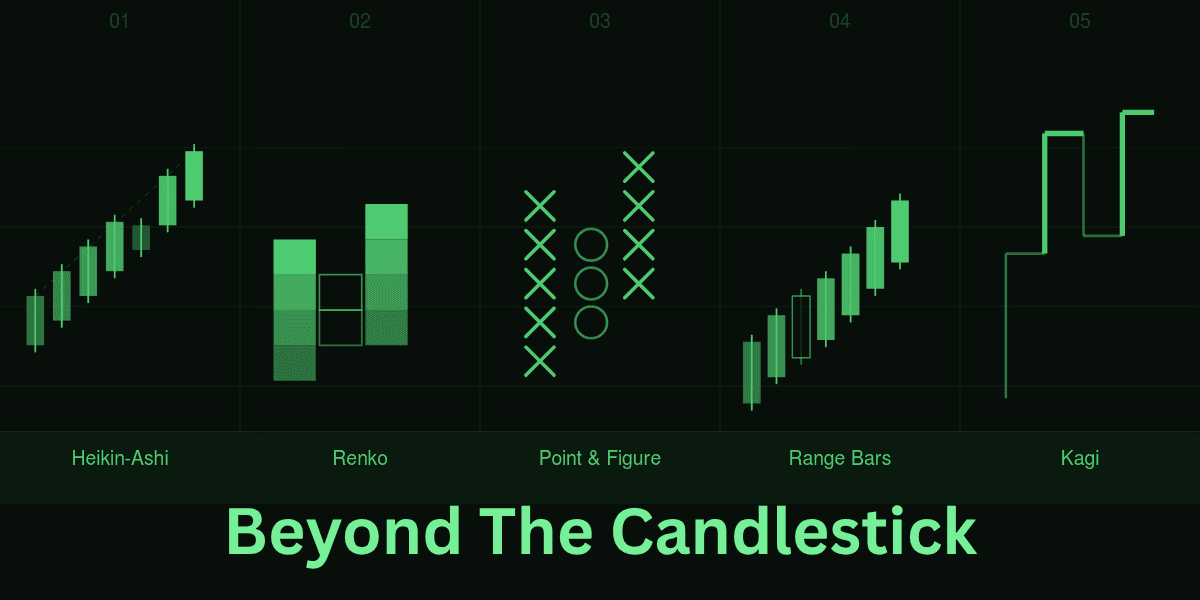
Candlestick charts dominate trading screens worldwide — but they are not always the sharpest tool available. This guide explores five proven alternatives: Heikin-Ashi, Renko, Point and Figure, Range Bars and Kagi. Learn how each works, what it reveals that candles can obscure, and how to integrate any of them into your existing workflow without disruption.

A comprehensive look at SEBI regulations, permitted currency pairs, broker options, and what the institutional landscape looks like.

At the top of the FX liquidity hierarchy sit Tier 1 banks, the institutions that set interbank rates and define the depth of the global forex market. This article explains how they operate, how their pricing flows down to retail brokers, and what it means for execution quality at every level.

GCC Brokers’ Youssef Bouz exposes how unrealistic leverage, bonuses and rebates distort the FX/CFD market – and why true A-Book, transparent brokerage is the only sustainable model.

The definitive list of genuine prop trading firms and funded account challenges for 2026.

We examine Plus500's spreads, regulatory standing, platform capabilities, and who it actually makes sense for in 2026.

Keep an eye on key upcoming economic events, announcements, and news. Plus, set up filters in a few clicks, selecting for event importance and affected currencies.

Over-the-counter (OTC) trading refers to transactions conducted directly between two parties, outside of centralized exchanges. This guide explains how OTC markets work in forex, crypto, and equities, including the role of dealers, pricing mechanics, and why institutional players often prefer OTC execution.
Create Your FREE Account
Get access to latest news, updates, real-time data, brokerage and trading firm insights and customized information feeds.

Ondo Perps has launched a permissionless perpetual futures platform allowing tokenised equity holdings and stablecoins as collateral, offering 24/7 trading with up to 20x leverage on US stocks, ETFs, and commodities. Built on Ondo Finance's technology, it targets non-US investors seeking leveraged market access.

M1X Global has closed an oversubscribed Seed round led by Paradigm, with Breed VC participating, taking total funding to $8.5 million. The sovereign infrastructure firm, behind the Marshall Islands' USDM1 bond, aims to expand institutional adoption of programmable, blockchain-based sovereign debt instruments.

Master the best beginner technical trading systems using simple price action principles. Learn how to trade Gold, Forex, Crypto, and Indices with confidence.

Coinbase has secured UK authorisation to provide investment services, allowing the exchange to offer derivatives and equities trading alongside crypto. UK CEO Keith Grose says the licence gives users regulated access to traditional investments ahead of the UK's full crypto regime, due in October 2027.

This guide explains how to use technical indicators to track market trends and volatility so you can make smarter, more reliable trading decisions.

Weekly outlook for the DAX and summary for the first half of year 2026.

Looking for a reliable EUR/USD price action forecast? Read our EUR/USD technical analysis to see if the 1.14150 resistance triggers a drop to 1.13500.

Want to stop losing money on false breakouts? Learn how to spot trading fakeouts, wait for price action confirmation, and trade much smarter.

Looking at today's Gold XAU/USD price action, traders are watching the $4200 resistance.

Bitget Wallet has surpassed 100 million users globally, with daily payment users now outnumbering traders for the first time. Card spend in emerging markets grew 416% in H1 2026, driven by currency instability in Nigeria and Argentina and demand for low-cost, stablecoin-based cross-border accounts.
Feed