just now


Liquidity Finder Ltd is incorporated in England and Wales, company number 10610740, registered address 167-169 Great Portland Street, Fifth Floor, London W1W 5PF, United Kingdom.
Published: just now

Gold has reversed sharply after attempting to recover toward $4,070. The precious metal had been consolidating around the $4,000 level before staging a strong upward move yesterday. However, the recovery failed to hold near the $4,070–$4,075 resistance zone, triggering a fresh wave of selling.
The moving averages are beginning to reflect the renewed selling pressure. The current price is below all three averages, MA5, MA10, and MA20.
On the downside, immediate support lies around $4,023, followed by $4,000 and the recent low at $3,975. A sustained break below $4,023 could expose the psychological $4,000 level, while a move below $3,975 would reinforce the broader bearish structure. On the upside, resistance is located around $4,037–$4,048, followed by $4,051 and $4,070. A recovery above $4,048 would ease the immediate selling pressure, but a sustained move above $4,070 would be required to signal a stronger bullish reversal. For now, the short-term outlook remains bearish, with the $4,023 and $4,000 support levels particularly important.
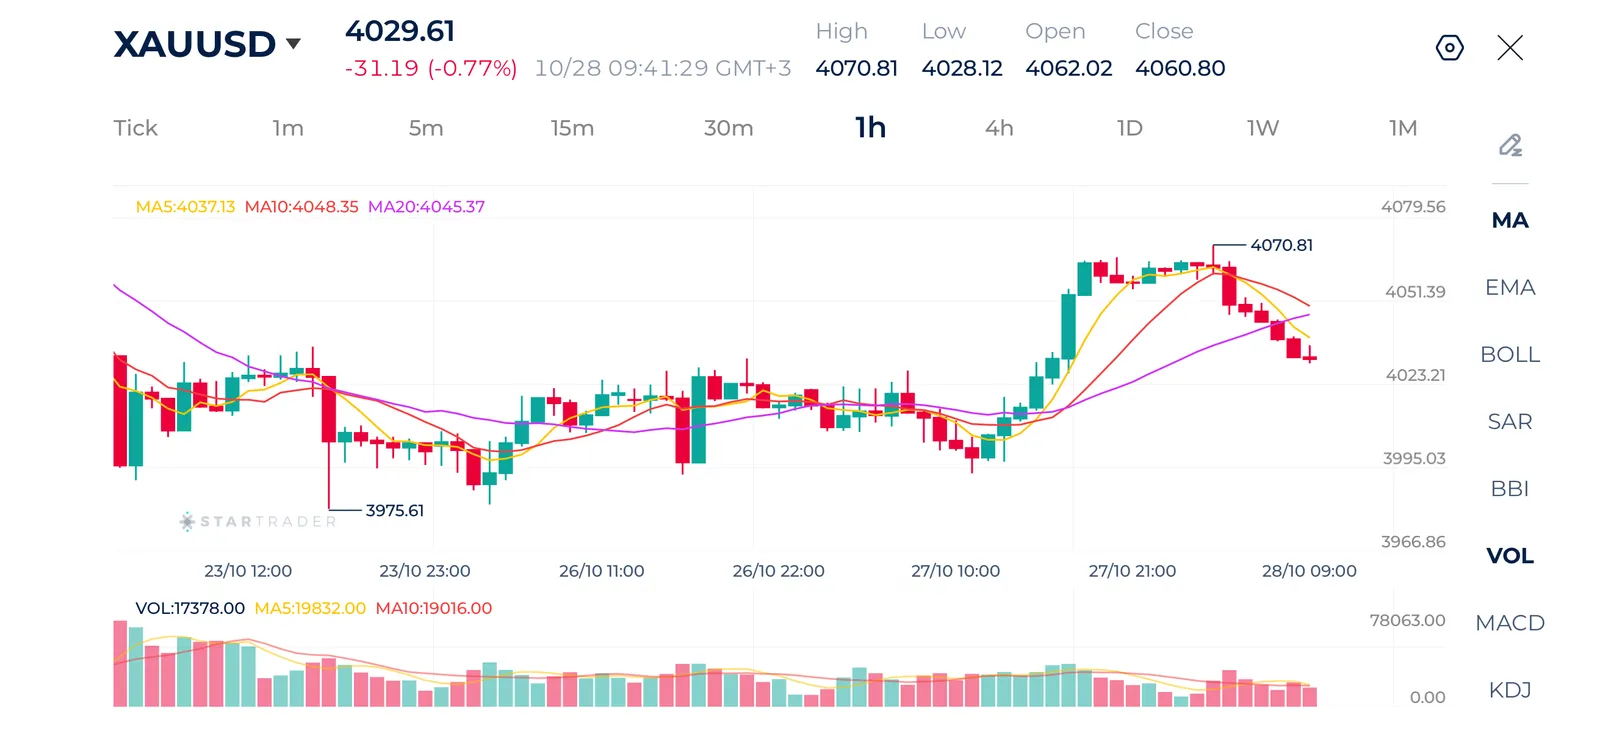
Source: STARTRADER app | Gold faces strong resistance at the $4,070 level after the recent recovery
| Resistance | $4,070 | $4,100 | $4,155 |
| Support | $4,000 | $3,975 | $3,945 |
Nasdaq 100 has staged a strong recovery, advancing from the recent support area around 28,838 toward 29,830. The index has broken above the previous consolidation zone around 29,400 and 29,600, establishing a sequence of higher highs and higher lows on the 1-hour chart. Recent candles show continued buying interest, with the index trading close to its session high.
The moving averages confirm the positive momentum. The current price is above all three averages, MA5, MA10 and MA20. This bullish alignment supports the continuation of the recovery.
On the upside, immediate resistance is located around 29,830–29,850, followed by the psychological 30,000 level and the chart resistance region near 30,060. A sustained break above 29,850 could open the way toward 30,000. On the downside, initial support lies around 29,780–29,745, followed by 29,650 and 29,600. A pullback that holds above the moving-average cluster would be consistent with a healthy bullish consolidation. However, a sustained move below 29,600 would weaken the current recovery. The short-term outlook is bullish, although a confirmed breakout above the latest high is needed to strengthen the case for further gains.
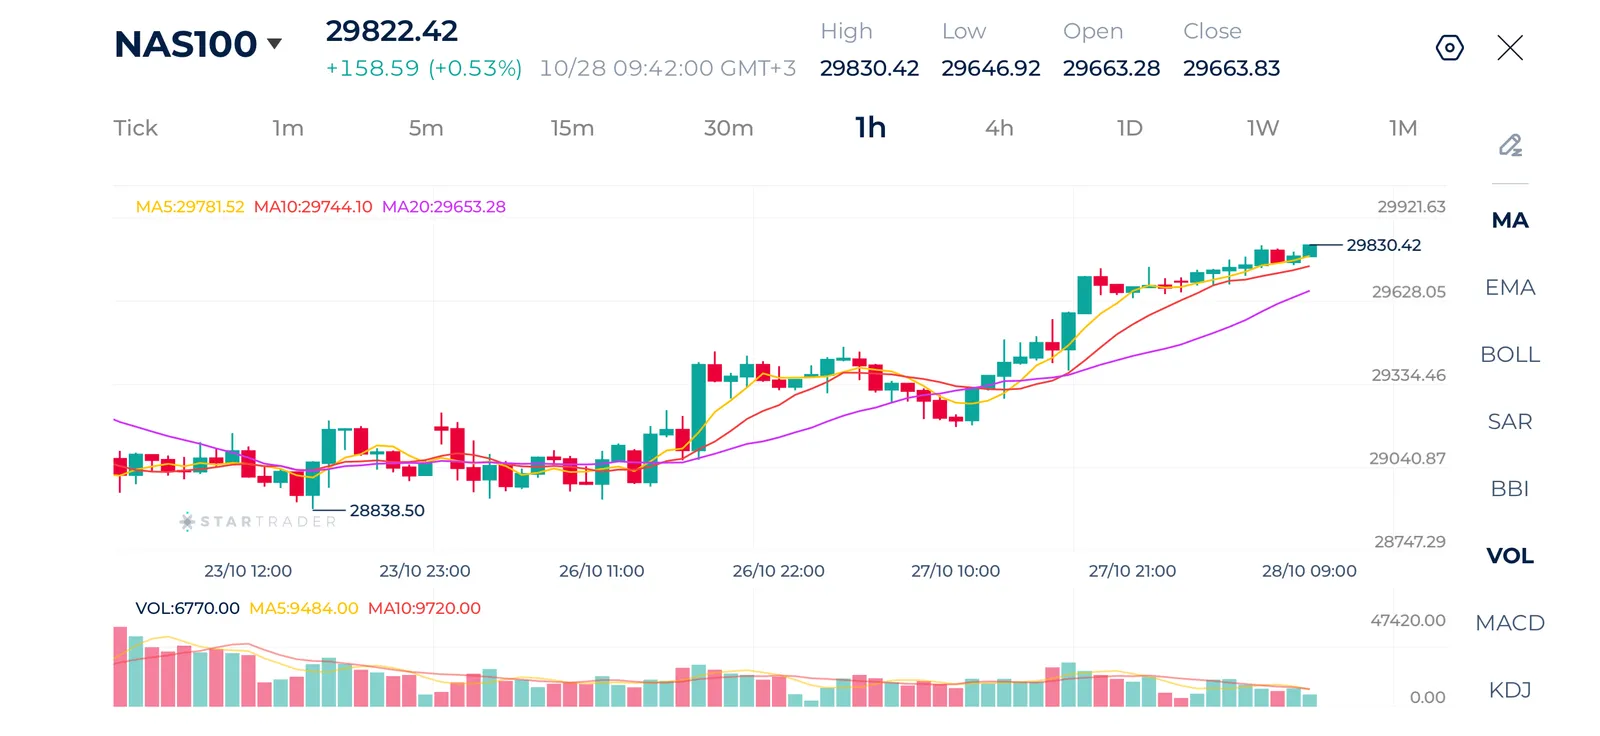
Source: STARTRADER app | Nasdaq advances higher on strong AI demand and investments
| Resistance | 29,920 | 30,000 | 30,154 |
| Support | 29,745 | 29,650 | 29,500 |
Brent crude has rebounded from the recent correction and is recovering toward the $116.00 area. The recovery suggests that buyers are regaining control in the short term, although the market has yet to reclaim its previous high.
The moving averages are supportive of this recovery. The current price is above all three averages, MA5, MA10, and MA20. This alignment signals improving bullish momentum and suggests that the recent rebound could extend if prices remain above the moving-average cluster.
Immediate resistance lies around $116.30, followed by $117.08 and the previous high at $118.23. A sustained break above $116.30 would strengthen the recovery and could open the way toward $117.00. On the downside, initial support is located around $115.80–$115.40, followed by $115.20 and the broader $114.50 area. A move below $115.20 would weaken the current bullish structure, while a break below $114.50 would suggest that the recovery is losing traction. Overall, the short-term outlook is bullish, with $116.30 representing the key level to watch for further upside confirmation.
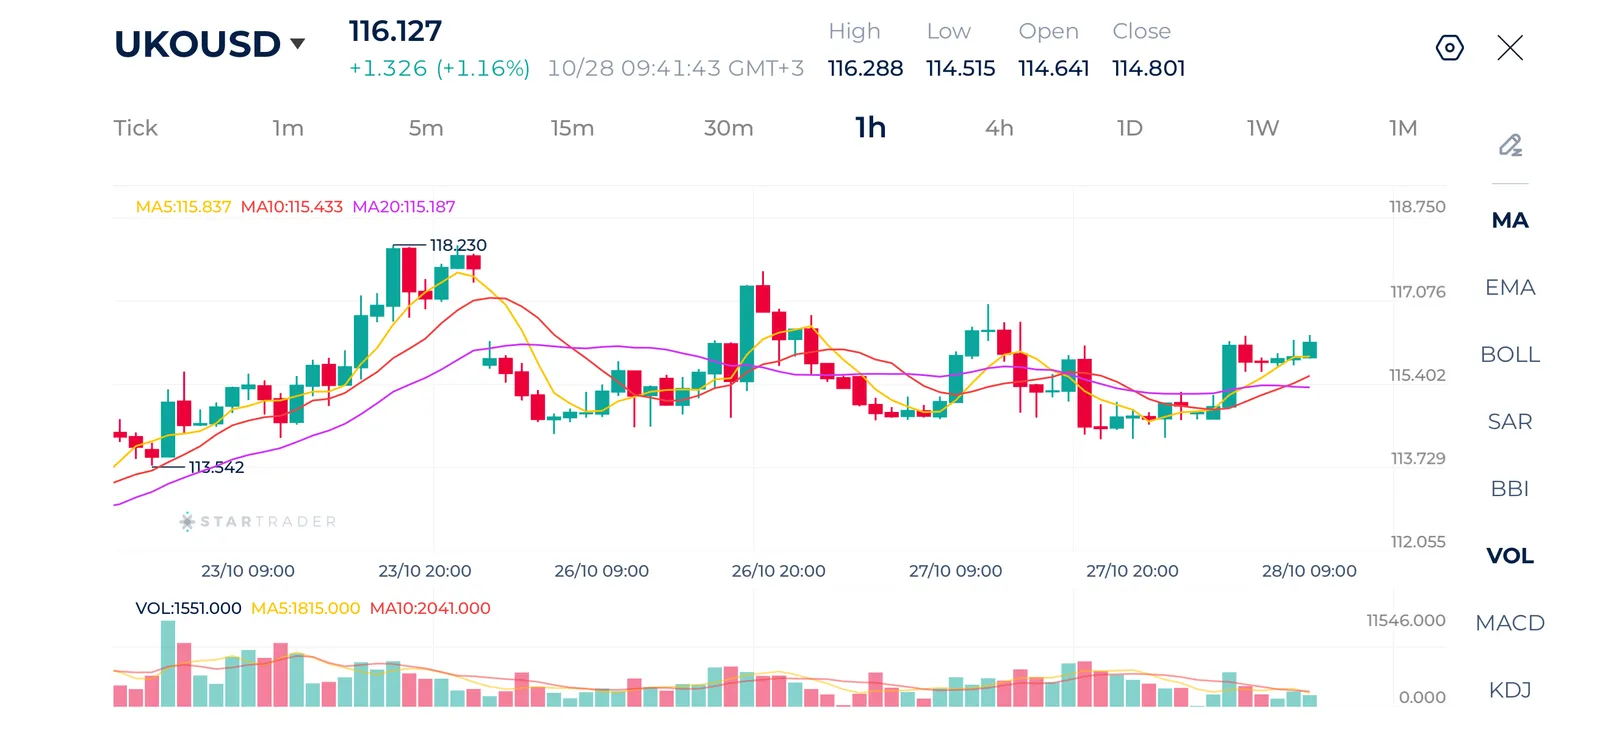
Source: STARTRADER app | Crude brent rises again following attacks on oil refineries
| Resistance | $117.08 | $118.23 | $119.33 |
| Support | $115.20 | $114.50 | $113.00 |
Risk Disclaimer: This material is provided for informational purposes only and does not constitute a recommendation or investment advice. Trading financial instruments on margin involves substantial risk and may not be appropriate for all investors.
STARTRADER is a global multi-asset broker empowering retail and institutional partners to access global markets through a range of platforms, including MetaTrader, STAR-APP, and STAR-COPY.

Select the categories and companies you wish to follow directly to your person rss feed.
Create Custom RSS FeedSign up and join over 5,000 professional members who receive personalized news alerts, curated professional connections, and more for free!
Brokers can offer LMAX perpetual futures alongside FX and CFDs through a single trading account. LMAX says brokers with existing credentials can go live in under five days.
24X National Exchange has filed a proposed rule change with the SEC to launch 24X Options, a general options market trading from 9:30 a.m. to 4:00 p.m. ET. The filing also covers binary KPI options on quarterly revenue, earnings per share and other metrics for 23 of the most actively traded U.S. companies.
cTrader Mobile 5.11 introduces Signals, a new app where traders can browse signals from leading providers and act on them directly in the platform.
ATFX Group has partnered with South Africa-based payment and digital asset infrastructure provider FiveWest to support institutional fund movements for ATFX Connect and add a cryptocurrency funding option for eligible retail clients. Both firms hold FSCA Over-the-Counter Derivative Provider licences.
UK inflation rose to 3.6% in October, keeping a December Bank of England rate rise likely, while the euro hit a fresh one-year low against the dollar ahead of tonight’s Fed minutes. Daily FX analysis from Equals.
GBPUSD has shifted decisively lower. After reaching 1.3228, the pair reversed and initially consolidated around the moving averages before breaking sharply below the 1.3180 area. It is now trading near 1.3169.
Nvidia shares jumped around 4% after hours after beating earnings and revenue expectations and raising its outlook for 75% year on year revenue growth through January 2028. The positive Nvidia results also lifted AI-related stocks, with CoreWeave up 8% and Nebius 10%.
Deutsche Börse Group has appointed Maximilian Weissenrieder as Head of Cash Market from 1 January 2027, succeeding Eric Leupold, who becomes CEO of Eurex. Weissenrieder has led Group M&A and Venture Investments since October 2024 and will retain those duties until a successor is named by the Group.
DEXA, the AI-powered risk management and analytics platform developed by TFB (Tools for Brokers), has connected with Match-Trader, bringing real-time trader analysis and toxic flow detection to brokers on the platform. DEXA classifies trader behaviour from as early as the third trade, with no change to execution systems.
Poland's financial markets regulator, the Polish Financial Supervision Authority (Komisja Nadzoru Finansowego, KNF), is preparing a new product intervention on contracts for difference (CFDs)