just now


Liquidity Finder Ltd is incorporated in England and Wales, company number 10610740, registered address 167-169 Great Portland Street, Fifth Floor, London W1W 5PF, United Kingdom.
Published: just now

Few weekly events cause as much excitement as energy reports. Traders eagerly await the new data. They want to see exactly how many barrels of commercial crude are sitting in storage across the country. The numbers matter.
This specific metric is called the EIA crude oil inventories it stands for the U.S. Energy Information Administration.
The United States is a large oil consumer. Because of this massive appetite, the U.S. market balance provides a very clear signal about global energy demand. Oil acts as a fundamental input for almost every part of the worldwide economy.
These reports perfectly capture the delicate dance between production and usage. The agency measures exactly how much oil is imported versus how much fuel gets refined. When inventories fall consistently, it proves that factories are humming and consumers are traveling.
West Texas Intermediate (WTI) serves as the main benchmark for American oil. While predictable reports keep the market completely calm, sudden surprises in the data will always cause immediate and chaotic price volatility. Traders prepare for massive swings right before the release and the stakes are high.
When the EIA crude oil inventories report show an increase in storage, it indicates or tells that supply is currently exceeding demand and this oversupply exerts downward pressure on West Texas Intermediate trading, creating a bearish signal for investors and as prices usually drop.
And declining supplies trigger the exact opposite reaction in the financial markets. So, if the report provides decrease in inventories then it suggests that supply is really tightening or that overall demand is rapidly strengthening. With this scenario generally drives prices higher, producing a strong bullish signal in short the scarcity of this good creates value.
Oil prices directly influence or impact the transportation and manufacturing sectors. A sharp rise in WTI price level signals rising production costs, which can quickly push overall inflation much higher across the economy. Central banks like the Federal Reserve might keep interest rates elevated or remain higher for longer to combat this trend which makes almost everything become expensive.
Currency markets also react violently. Because international trade depends heavily on energy, oil-linked currencies are incredibly sensitive to the EIA crude oil inventories. The Canadian Dollar (CAD) often strengthens when oil rises. Major importers suffer.
Major oil importers face different challenges. These nations may see their own currencies weaken dramatically if global energy costs suddenly spike while some struggling countries lose immense purchasing power during these inventory shocks gives negative impact.
Focusing only on raw numbers is mostly a mistake. New traders often assume the weekly data tells the whole story. But trading the EIA report requires a much deeper understanding of market psychology.
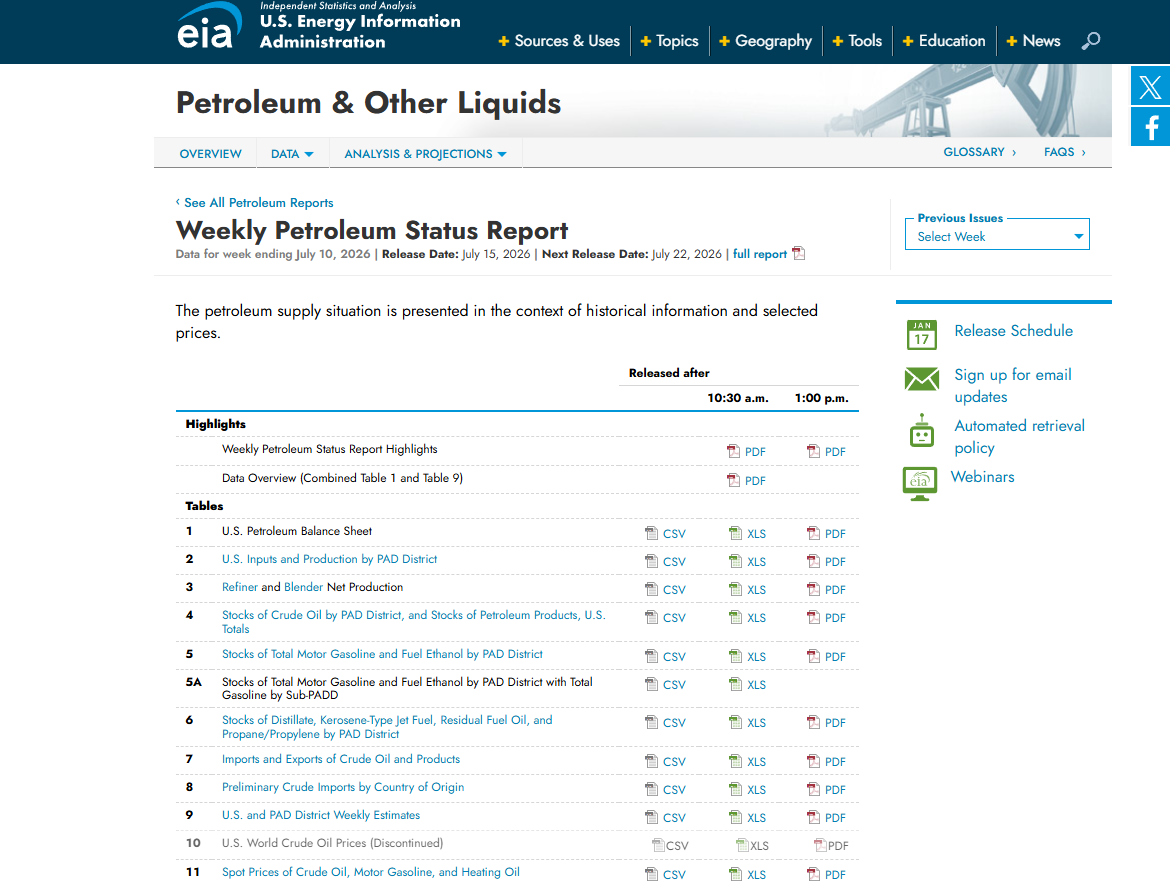
Source: EIA
When checking the data, you must realize that price movement thrives on unexpected surprises. The absolute number rarely matters as much as the deviation from the established market consensus.
Ignoring this reality will cause extreme volatility to completely wreck your current trading account. With professional investors never take these data releases at face value. They always wait to see how the crowd reacts to the fundamental shifts as you have to protect your capital from sudden whipsaw movements.
Professionals know that this event is rarely about the raw change in oil stocks. Instead, the real focus is always on the deviation from market expectations. As an example, if analysts might expect a massive 2.0-million-barrel inventory draw then you must closely monitor the surprises. If the data shows only a 0.5-million-barrel draw, the price of West Texas Intermediate may actually fall. This downward drop happens even though total inventories successfully declined. The financial market was simply priced for a much larger overall drop.
To get this right, professional traders monitor consensus estimates very closely. They use financial news terminals before the release. Your trading bias should always rely heavily on this crucial surprise factor. Waiting for the confirmation.
Relying strictly on fundamental reports can easily trigger nasty whipsaw losses. Because of this extreme short-term volatility, many traders use a specific confirmation strategy. This logical method helps filter out the market chaos. It saves your account.
Consolidation Filtering: Look for a tight price consolidation in the 1 to 3 hours leading up to the EIA release. This narrow trading range represents deep market indecision.
Breakout Execution: Do not trade the first 60 seconds after the numbers hit the wire. This initial flurry of activity is mostly just noise. Wait for a 15-minute candle to close clearly outside of that pre-release consolidation range.
Momentum Validation: Pair your breakout with technical indicator like the Moving Average Convergence Divergence (MACD) or Relative Strength Index (RSI). If the price breaks out but the RSI is already near 70 (overbought) or 30 (oversold), the move may lack sustainable momentum. This signals a potential fade or false breakout.
A common mistake is focusing exclusively on crude oil while ignoring the rest of the picture. You must also track gasoline and distillate stocks like diesel or heating oil. Refiners constantly turn crude oil into these everyday consumer products.
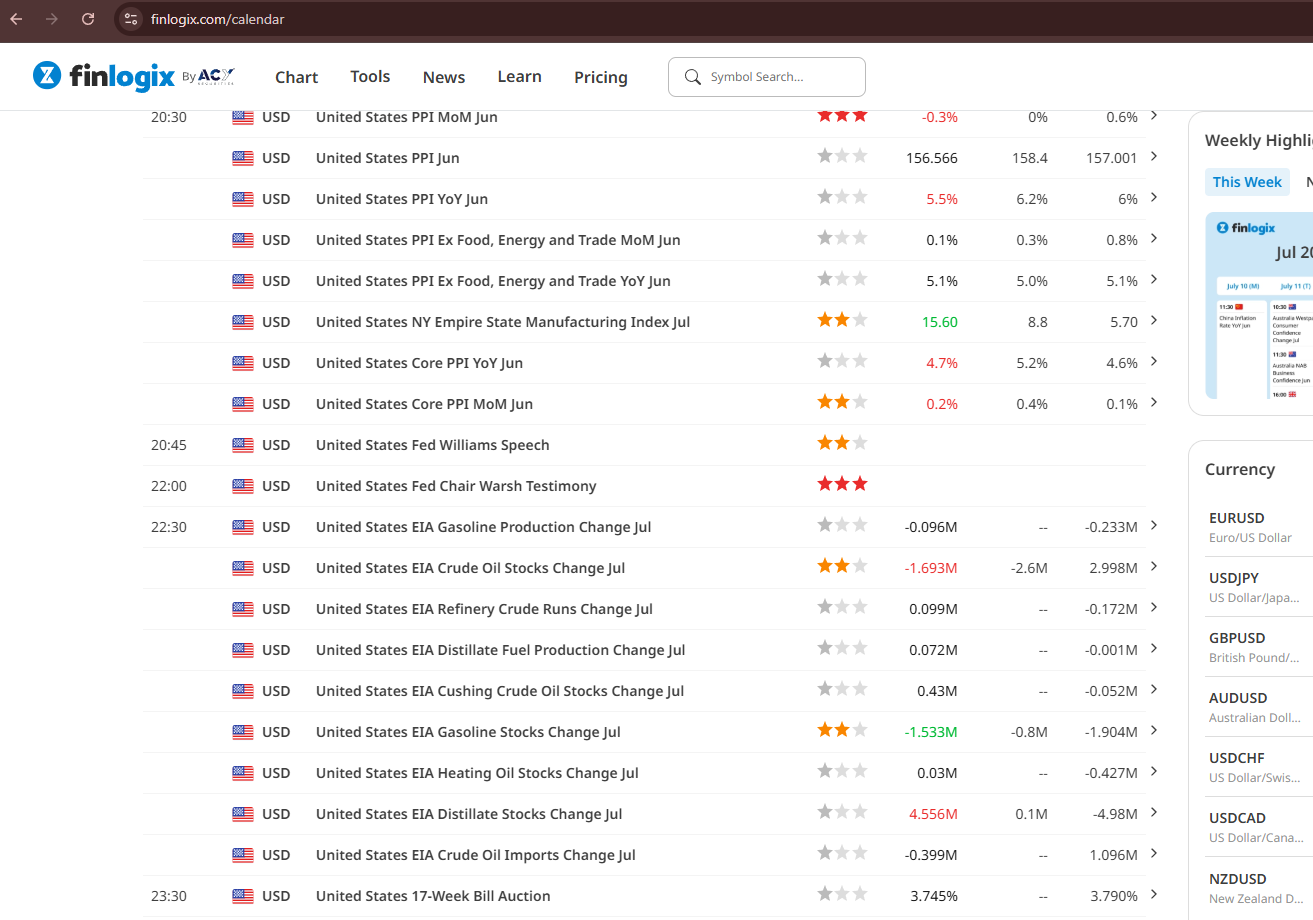
Source: Finlogix
If crude supplies fall or decline but gasoline builds up massively, refiners are struggling to sell end products. This hidden weakness can quickly dampen the bullish effect of a major crude draw. It clearly signals weaker downstream demand across the entire energy sector. Watch the supply chain.
You must always view these inventory numbers through a very strict seasonal lens. Context changes everything in this particular commodities market. For example, a massive build in gasoline stocks during the middle of summer is highly important. Timing or season also changes the facts.
Summer is the peak driving season for everyday consumers. Therefore, a summer inventory build is a much stronger bearish signal than the exact same build during the winter.
When the data drops, it frequently causes massive spikes in the Average True Range (ATR). This extreme market turbulence makes standard risk management highly unreliable. Regular Stop-Losses are frequently triggered by wild, unpredictable spike noise.
You have to adjust your trading parameters to survive these brutal price swings. Trading the EIA report correctly means waiting for a confirmed setup before risking a dollar. The market will eventually reveal its true direction.
News events can be incredibly wild and EIA release trading requires a very specific plan so that you can easily survive the sudden chaos. You must learn how to control your risk before the numbers actually drop.
The unpredictable nature of news-driven volatility will quickly shake out unprepared day traders. When the market starts jumping around, a quick and temporary price swing can ruin a perfectly good setup and can be frustrating.
The smartest move is swapping out fixed dollar limits for smarter buffers. Instead of just guessing a random number, you should rely on mathematical market data to protect your active positions.
You must always use ATR-based dynamic stops rather than setting a strict, fixed dollar amount for your safety net. This specific tool measures current market energy to build a reliable buffer.
Using this flexible barrier allows your trade to actually breathe through the initial volatility. You will no longer get stopped out by a quick, temporary price swing just before the market goes your way. Give trades room.
Institutional traders are famous for cutting back their overall position size right before a major news event hits the wire. This smart habit is known as exposure reduction, and it saves money.
Many people typically trade a standard model that risks about two percent per setup. If you follow a 2% risk-per-trade model, you should consider halving your total exposure during the exact release window. Drop it to one percent.
Slashing your risk accounts for the wildly unpredictable nature of breaking news-driven volatility across the financial boards. Combining this smaller size with dynamic safety nets creates an incredibly strong strategy. Trade with confidence.
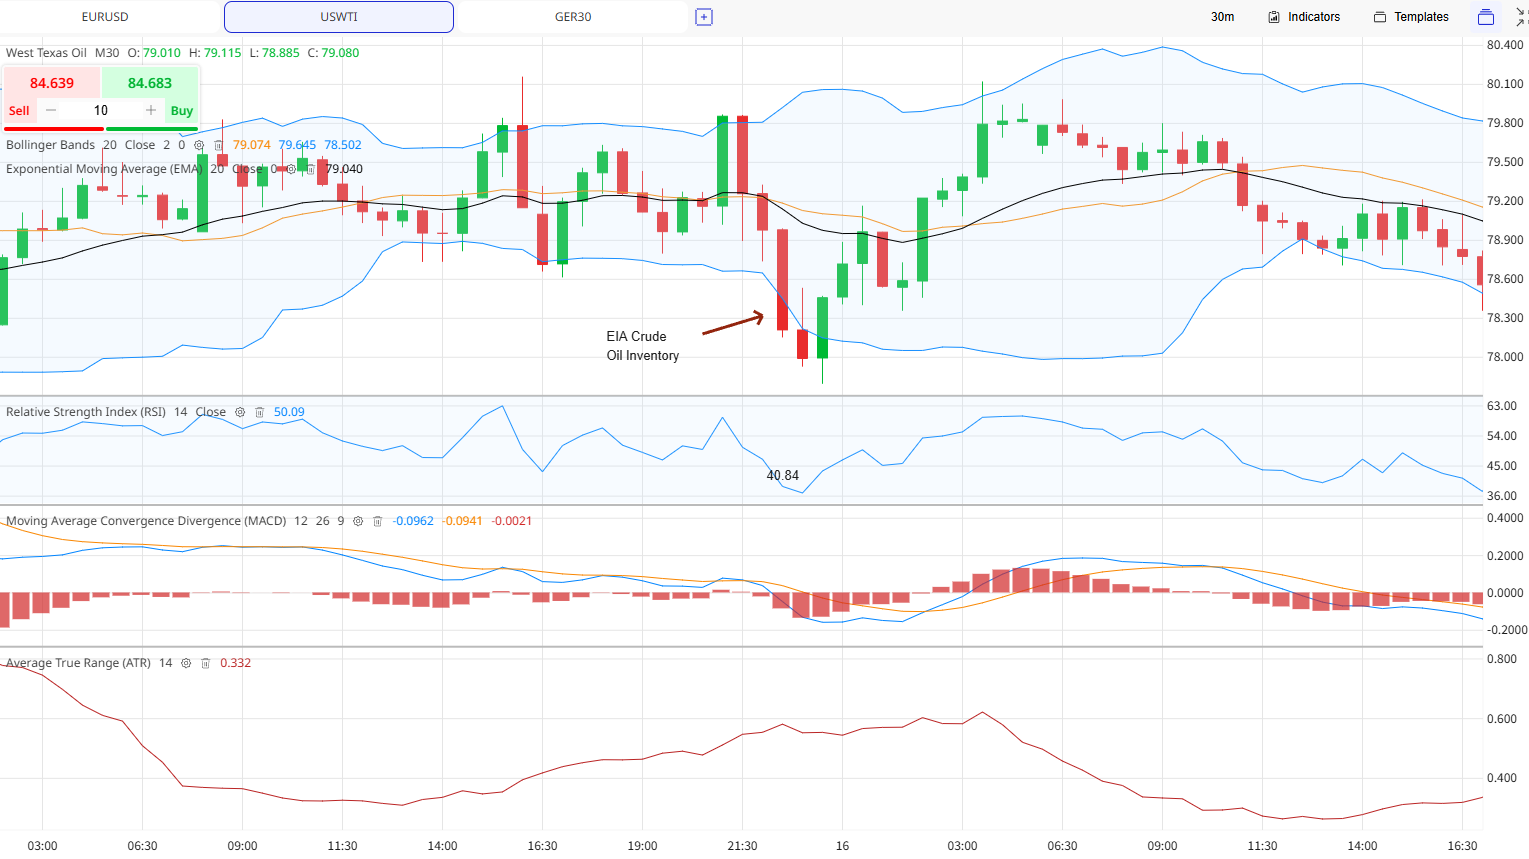
Source: ACY
Trading crude oil during the weekly inventory report can feel like a rollercoaster. Wild price swings trap many traders. You need a solid EIA release trading strategy to survive and profit from this chaos. Without a plan, you are just guessing. You must understand the market state before the news hits.
And to mitigate risk, we may utilize core technical indicators such as the 20-period Exponential Moving Average (EMA), the Relative Strength Index (RSI), and the Average True Range (ATR).
Before the report, you want to identify the current market state. Check also the trend of the market preferably both in lower time frames.
The Bollinger Bands Squeeze: A tight Bollinger Bands squeeze means the market is waiting for direction. Low volatility right before the morning release signals an explosive move is imminent. Get ready.
The 20-period EMA Anchor: The 20-period EMA acts as a moving trend line. If the price trades far away from the EMA before the report, the trend is quite strong. Sometimes, unexpected report data will make the price snap back toward this moving average. Mean reversion happens.
Never trade the very first violent price spike. The initial noise during the first 5 to 15 minutes presents significant risk for beginners. Wait for the market to calm down or the digest the release.
Fibonacci Retracement: If the report causes a massive price move, wait for the momentum to slow down completely. Draw your Fibonacci retracement tool on the impulse wave to find strong support levels. Look for a pullback to the level that shows rejection signs like a long wick. You may trade the trend.
RSI Confirmation: Use the Relative Strength Index (RSI) on a 5-minute or 15-minute chart to avoid chasing bad entries. If WTI oil spikes while the RSI reaches 70 or above, avoid entering a long position on the breakout, as the bullish momentum is likely overextended. Instead, wait for a pullback before trading.
EIA reports cause unpredictable whipsaws on the price chart. You must use the Average True Range (ATR) to guard your total risk. Stop-losses save accounts.
Look closely at the current 14-period ATR. If it currently reads as an example $0.40, your stop-loss must be wider than that specific number. A tight stop will easily get hit during the volatile post-release chop. Give it a space for it.
Big news weeks require extra caution from traders. If major geopolitical headlines drop alongside the report, you must widen your Stop-Loss buffer immediately. To keep your risk normal, reduce your overall position size.
Crude oil markets get absolutely have volatility during major news events. You need a solid plan for trading an EIA surprise to survive the chaos with a sudden shift in oil inventories, it can trigger massive, unpredictable price swings that wipe out unprepared accounts.
When trading an EIA surprise, you can instead rely on a strict WTI crude oil workflow to guide your positions. This technical analysis strategy keeps you fully grounded when the charts go volatile. Walk you through a hypothetical setup that shows exactly how this workflow functions. We will look at how to observe the Bollinger Bands, wait out the noise, and execute a flawless entry.
Explore my portfolio for further insights:
Will WTI Break $80? Key Levels and Market Drivers
WTI OUTLOOK: Is the War Premium Finally Fading?
Disclaimer: This content may have been written by a third party. ACY makes no representation or warranty and assumes no liability as to the accuracy or completeness of the information provided, nor any loss arising from any investment based on a recommendation, forecast or other information supplies by any third-party. This content is information only, and does not constitute financial, investment or other advice on which you can rely.
ACY Securities is one of Australia's fastest growing multi-asset online trading providers, offering ultra-low-cost trading, rock-solid execution, technologically superior account management and premium market analysis.

Select the categories and companies you wish to follow directly to your person rss feed.
Create Custom RSS FeedSign up and join over 5,000 professional members who receive personalized news alerts, curated professional connections, and more for free!
Theorem has integrated Symbiotic’s Liquid Lane RFQ network, letting holders of tokenised real-world assets trade against on-chain pool liquidity and market-maker quotes. The integration is live on Ethereum, with Midas’s yield-bearing mHYPER fund as the first supported asset. Holders can trade for the USDC stablecoin.
US equities were volatile with technology selloff erasing much of the earlier rebound.
FM Summit London 2026 returns to Old Billingsgate on 24 November for its 15th edition, with LMAX Group, Plus500 and oneZero among confirmed exhibitors. The one-day event adds Business Connect meetings and roundtables, and opens with a networking evening at The Folly on 23 November.
Finance Magnates Summit London returns to Old Billingsgate on 24 November 2026 for its 15th edition. The one-day event brings together brokers, liquidity providers, institutional firms, trading technology vendors, payments businesses and digital asset firms.
iSAM Securities Apex has integrated with Match-Prime, giving brokers access to liquidity across more than 2,000 instruments, with tailored pricing and up to 10 levels of market depth.
propfunding.com's free-entry instant funding changes the order of prop funding. Start trading first. Its free-entry instant funding model offers two qualification attempts without an upfront activation fee.
US stocks closed higher on Wednesday, with the Nasdaq gaining 1%, the S&P 500 rising 0.6%, and the Dow advancing 0.7%, as renewed enthusiasm for AI-related stocks lifted market sentiment.
SpaceX went public in June as a rocket company. On October 20 it reported as something else entirely: an AI infrastructure business, financed by a satellite broadband network, with a launch division attached. Rockets generated 12% of third quarter revenue and lost money. The AI segment generated 52% of revenue and consumed 84% of capital expenditure. Starlink generated 85% of operating profit.
Standard Chartered has signed definitive agreements to acquire 100% of Zodia Custody UK Limited, folding its regulated digital asset custody business into Securities Services. Zodia Solutions will be set up under SC Ventures with bank investors including Northern Trust, NAB Ventures, Emirates NBD and Investcorp.
Bybit Fintech FZE has secured a Virtual Asset Service Provider licence from Dubai’s Virtual Assets Regulatory Authority for Exchange Services, covering spot trading. Bybit’s Peter Loo said the firm hopes to add derivatives, subject to regulatory approvals. Its international Dubai headquarters opened in 2022.