Explore Companies BySectors & Categories
Explore Companies ByUse Cases
Explore Companies ByProducts & Services
Explore Companies ByRankings & Reviews
Featured NewsCompaniesMarketsCryptoTechRegulatoryCommentaryUKUSWorldMore

    Latest Wires

      Daily Newsletter

      LF Daily News

      Daily industry focused newsletter giving you an overview for the financial & finTech industry.

      See All Newsletters
      By clicking "Sign Up" you are agreeing to our Terms of Service and Privacy Policy

      Trading Journal Strategy Metrics: How to Measure Setup Quality & System Edge

      Published: just now

      Trading Journal Strategy Metrics: How to Measure Setup Quality & System Edge

      A Trading Journal has three major layers:


      1. 1. Execution Metrics – Did you follow your rules?
      2. 2. Behavior Metrics – Did your mindset help or sabotage you?
      3. 3. System Metrics – Does your strategy actually have an edge?

      Parts 1 to 4 focused on you - your clarity, your emotions, your biases, your actions.


      But Part 5 shifts attention to something equally important:


      Is your strategy statistically profitable?


      Most traders unknowingly blame themselves for problems that come from one source:


      Their system doesn’t have a measurable edge.


      They think:


      • “Maybe I need more discipline.”
      • “Maybe I need better entries.”
      • “Maybe I need to stop hesitating.”


      But the truth is often simpler:


      The system itself is flawed or incomplete - and they never measured it.


      To avoid this trap, your Trading Journal must track System Metrics, helping you evaluate:


      • Which setups work?
      • Which setups fail?
      • Which market conditions they work best in?
      • How much R each setup produces?
      • The consistency of each pattern over time
      • Which parts of your strategy need refinement


      Think of this part as a strategy audit - similar to what institutional desks do before risking large capital.


      To help reinforce these concepts, revisit the following foundational lessons:


      These concepts form the technical backbone of a measurable system.


      Let’s begin the deep dive.


      1. Setup Quality Scoring - Grading Your Entries Like a Professional Desk


      Visual content


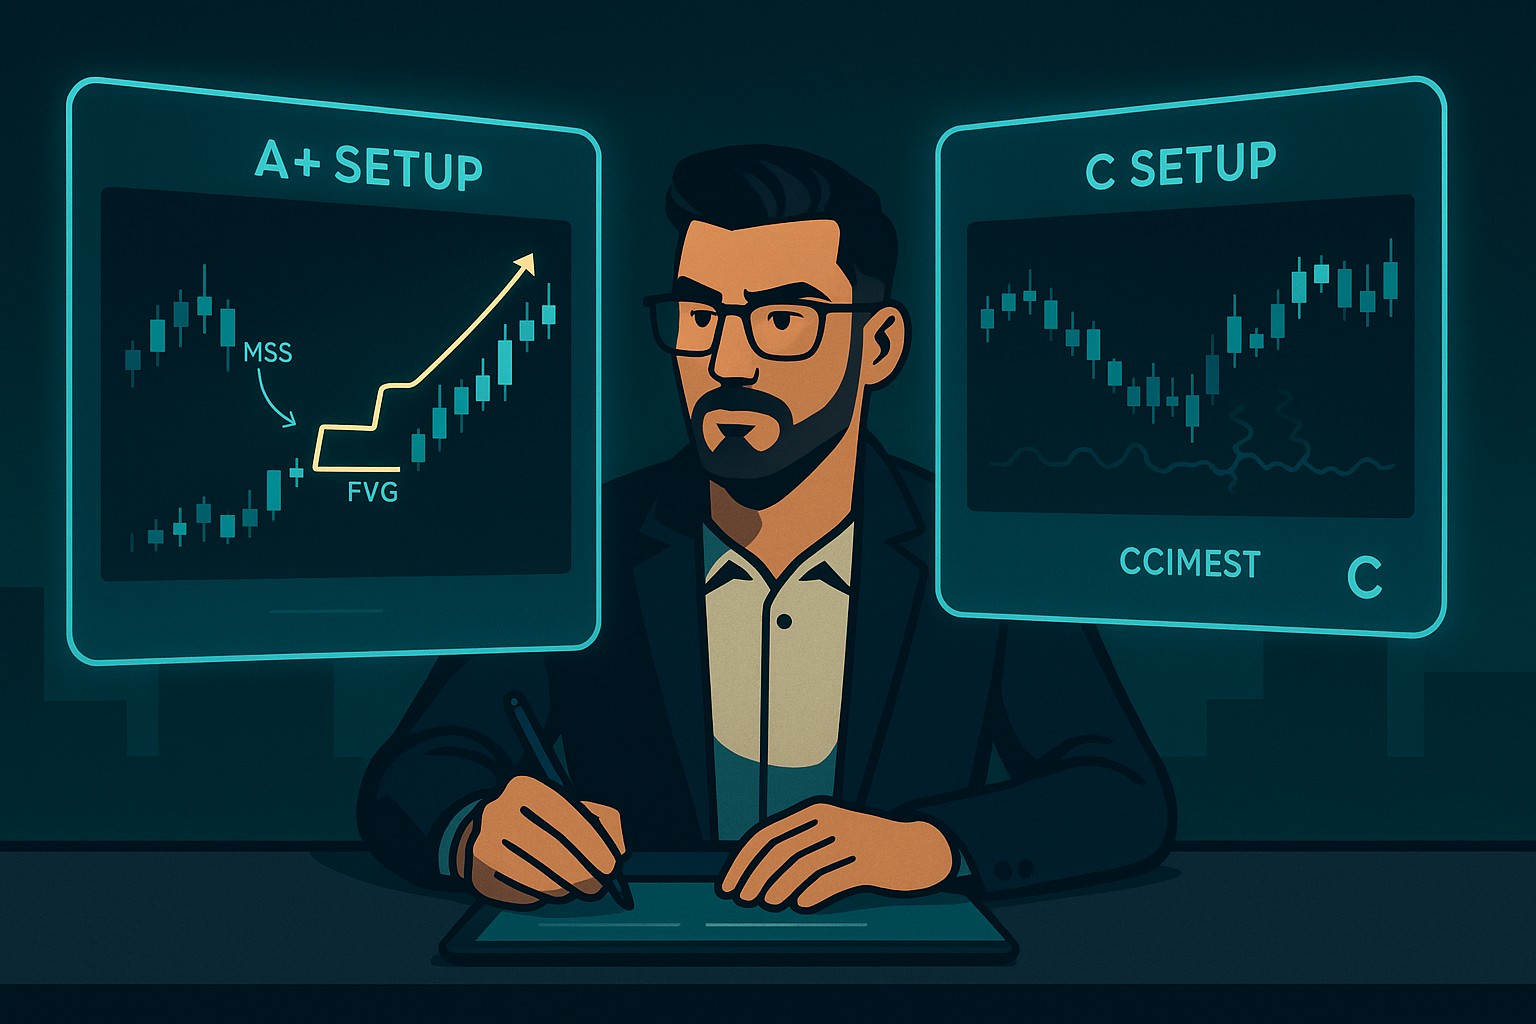
      Before taking a trade, you rank the setup from A+ to C using criteria such as:


      • HTF alignment
      • Liquidity taken
      • Fair Value Gap present
      • Structure shift confirmed
      • Session timing
      • Market volatility condition
      • Clean POI


      Your Trading Journal must record:


      Setup Grade (Before Entry)

      How clean the setup appears.


      Setup Outcome (After Trade)

      How clean the setup really was.


      Over 20–50 trades, you will discover:

      • A+ trades carry most of your profit
      • C setups are responsible for most drawdowns
      • Poor-quality trades drain mental capital
      • Higher-quality setups have smoother R-distributions


      This is the first step in reducing noise from your strategy.


      2. Setup Performance Breakdown - Which Patterns Actually Deliver?

      Visual content


      Your strategy likely includes several types of entries:


      • OB + FVG + Liquidity Sweep
      • MSS with FVG retracement
      • Asian liquidity grab + NY continuation
      • Break-and-retest at key level
      • Range deviation reversal
      • Trend continuation using dynamic support/resistance


      Each setup must be tracked separately with:


      • Win rate
      • Average R
      • Profit factor
      • Expectancy
      • Best market conditions
      • Worst market conditions


      After tracking, you often see surprising truths:


      • Setup A works only in trending markets
      • Setup B works only during specific sessions
      • Setup C provides high R but low win rate
      • Setup D works best after news
      • Setup E fails completely during high volatility periods


      This is how professional traders refine their edge - not by guessing, but by measuring.


      3. Market Condition Metrics - When Your System Performs Best

      Visual content


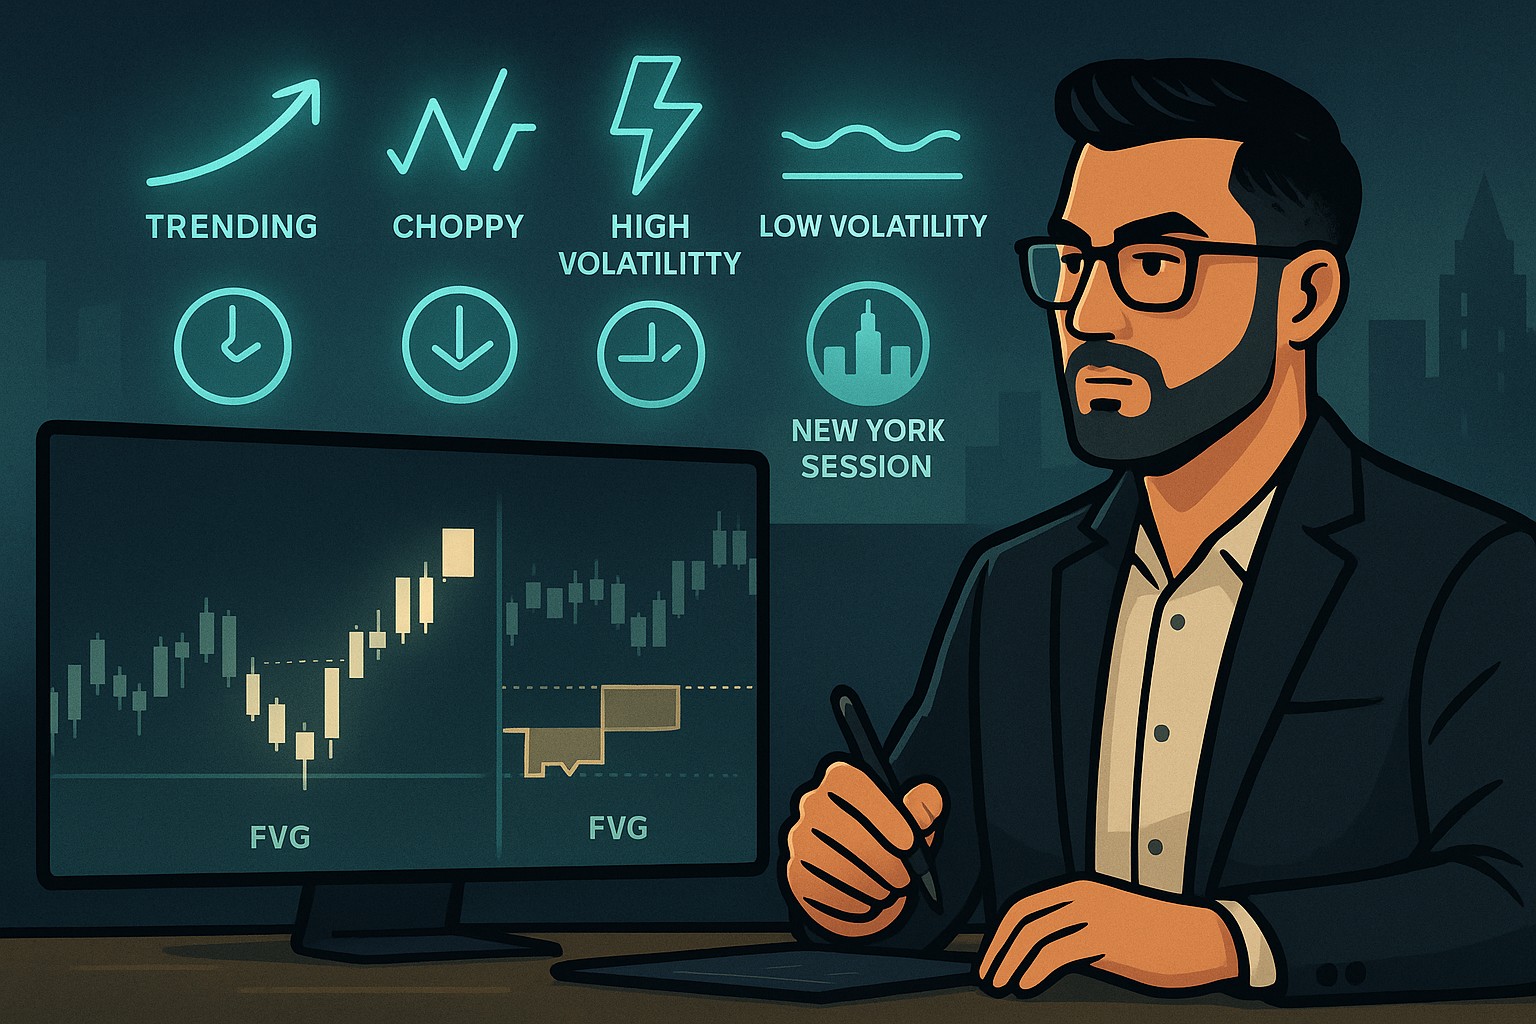
      Your setup may not work in all conditions.


      Your Trading Journal should include a toggle or tag for:


      15

      • Trending
      • Choppy
      • High volatility
      • Low volatility
      • Session type (London, NY, Asia)
      • Pre-news vs post-news
      • HTF premium/discount context


      You will soon discover:


      • Most strategies fail in chop
      • Strong setups work best after liquidity grabs
      • Certain pairs behave differently at each session
      • NY open favors volatility-based setups
      • London favors sweep-and-reverse setups


      This aligns with SMC-based session guides such as:


      Market conditions matter more than most traders realize.


      4. Entry Confirmation Metrics - The Precision Layer

      Visual content


      This part tracks whether your setup includes all required confirmations:


      Key confirmations to log:


      • FVG tap or mitigation
      • BOS or MSS
      • Liquidity sweep
      • Clean order block formation
      • Breaker or change of delivery
      • Rejection wick confirmation
      • Volume spike (optional)
      • Session timing alignment


      Your Trading Journal should answer:


      • Did the setup have all confirmations?
      • If not - which ones were missing?
      • What is the win rate when confirmations are incomplete?


      You will soon find:


      Lack of confirmation is the #1 cause of unnecessary losses.


      5. Stop-Loss Quality Metrics - Was the SL Placed at a Valid Invalidational Point?

      Visual content


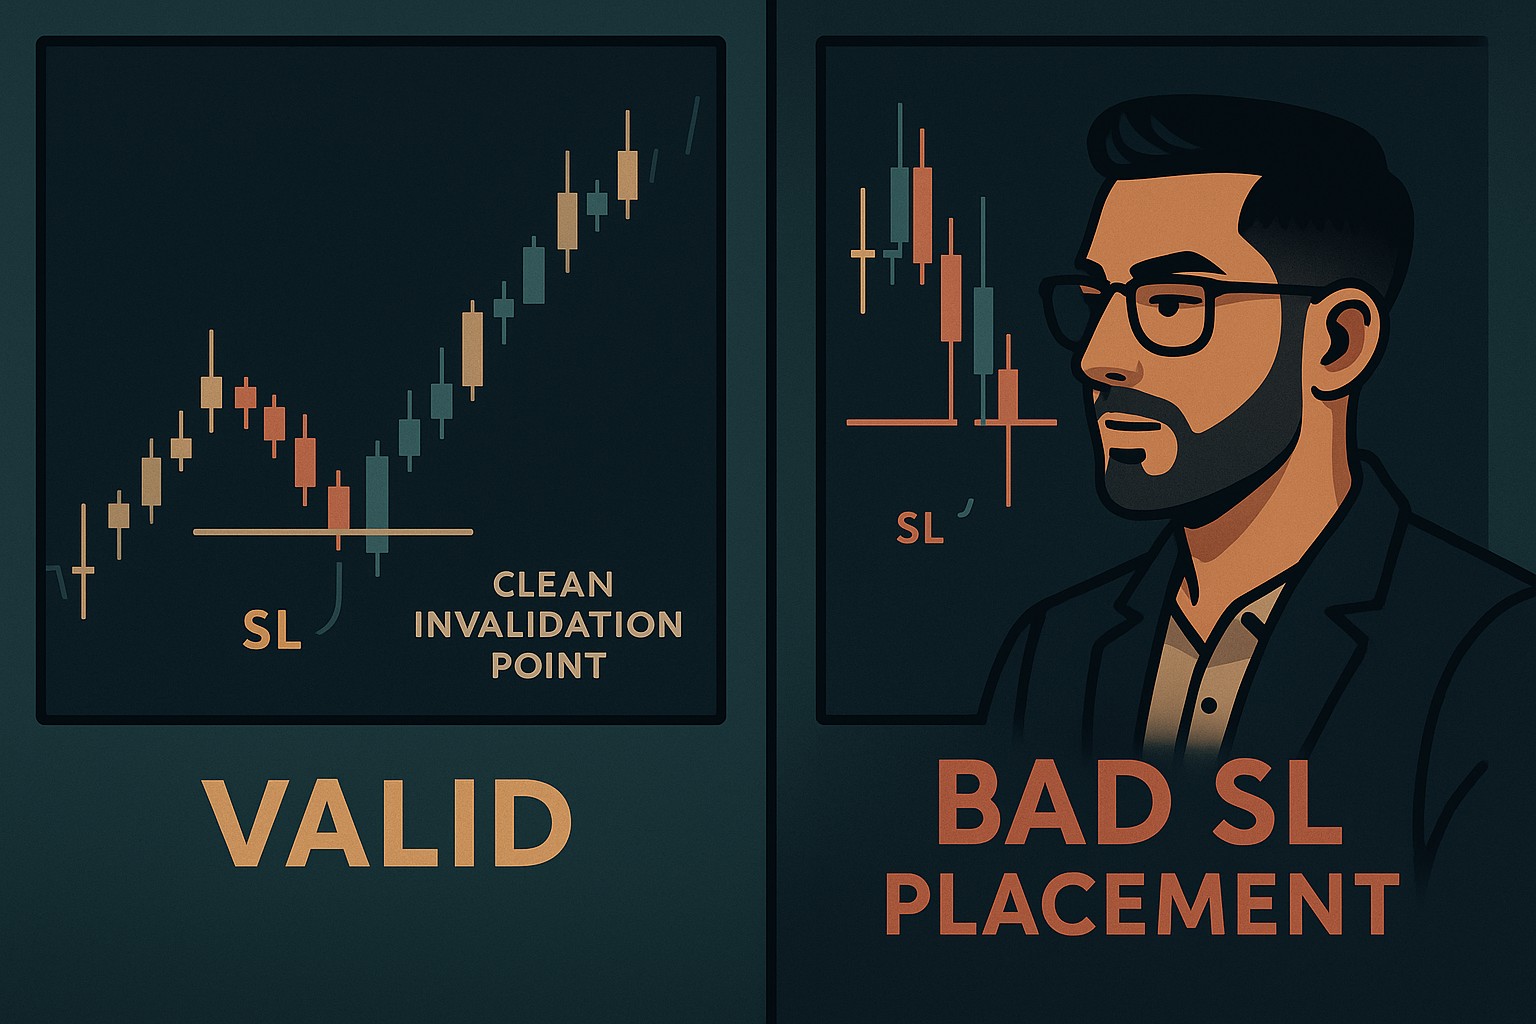
      Professionals distinguish between a bad loss and a valid loss.


      A valid loss happens when:


      • SL was placed at a logical invalidation zone
      • System structure was respected
      • Market simply didn’t continue


      A bad loss happens when:


      • SL was too tight
      • SL was placed inside the wick zone
      • SL wasn’t adjusted to market structure
      • The entry itself wasn’t clean


      Tracking stop-loss behavior helps you improve R-multiples without changing your strategy.


      6. Take-Profit Consistency - Are You Capturing the System’s True Edge?

      Visual content


      Some traders have a profitable system but never realize it because:


      • They take profits too early
      • They ignore structural TP zones
      • They get spooked after a loss
      • They fail to use HTF target alignment


      Your Trading Journal must log:


      • TP type (fixed R, HTF level, range deviation, liquidity pool)
      • TP consistency score
      • Favorable excursion (MFE) vs actual exit
      • Whether premature exit reduced profitability


      After 30–50 logs, you’ll see the truth:


      Your system might be capable of 2R–4R, but you are only capturing 0.8R.


      This is where you recover lost edge.


      7. System Error Metrics - Failures of the Strategy Itself

      Visual content


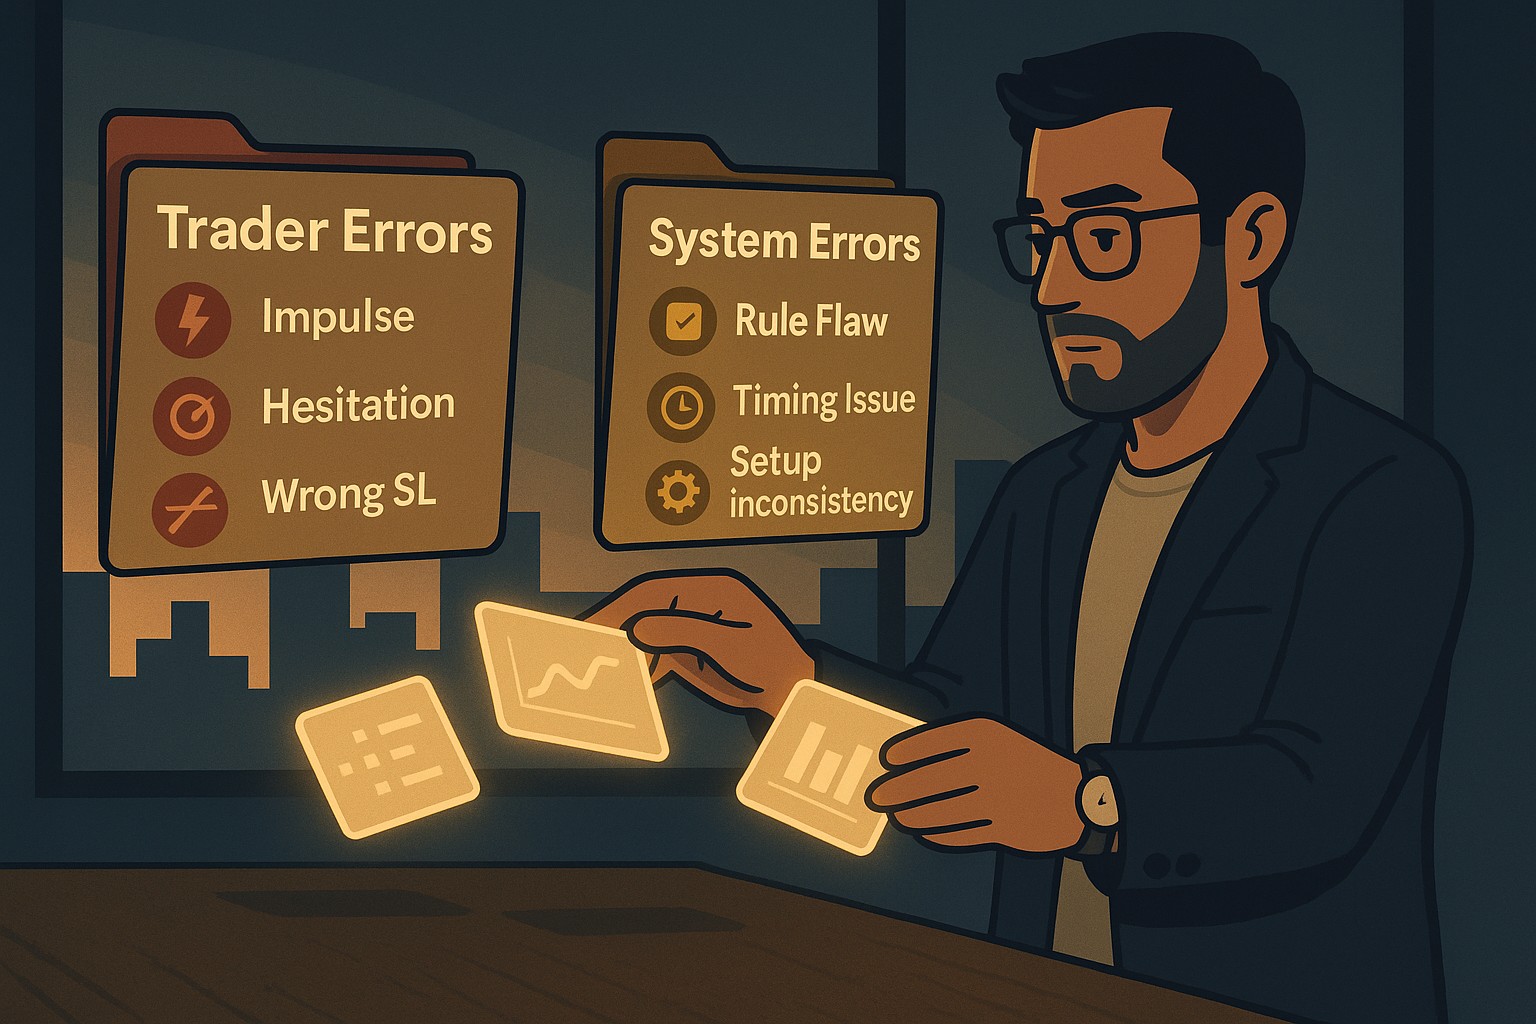
      A system error is different from a trader error.


      System Error:


      The setup met all rules but still fails consistently.

      This means the rule itself needs revision.

      Examples of system errors:

      • FVG retracement fails during high volatility
      • OB taps work only when liquidity is taken
      • MSS entries fail without time-of-day alignment
      • Trend continuation setups fail in discount/premium zones
      • Breakouts fail without internal range liquidity sweep


      Your Trading Journal must isolate these failures so you can update your rulebook.


      This aligns with professional iteration frameworks like:


      Refining Your Trading Edge


      8. System Evolution Matrix - How Your Strategy Improves Over Time

      Visual content


      Every month, your Trading Journal should generate:


      System Strengths:

      What the data proves is working.


      System Weaknesses:

      Setups or rules that consistently fail.


      System Refinements:

      New rules, filters, or confirmations to add.


      System Eliminations:

      Setups or conditions you will stop trading.


      System Enhancements:

      Add-ons such as Fibonacci alignment, HTF bias filters, or time-based restrictions.


      The goal:


      Turn your system into something tight, clean, predictable, and high-probability.


      The result:


      A trading strategy that grows sharper with each month of journaling.


      Real-Life Analogy - The Chef That Refines His Recipe

      Visual content


      A chef doesn’t ask,


      “Did I cook well today?”


      He asks:


      • Which ingredients worked?
      • Which made the dish weaker?
      • Was the timing perfect?
      • Did the conditions change?
      • Which techniques improved the flavor?


      Over time, the recipe becomes world-class - not because he cooked more,


      but because he measured every detail.


      Your strategy works the same way.


      The more data you track, the sharper your edge becomes.


      Final Thoughts

      Visual content


      You cannot improve a system you do not measure.


      System metrics turn your journal into a strategy laboratory -


      a place where ideas evolve, rules tighten, and your edge becomes something you can trust.


      Once your system is measurable, your confidence increases.


      Once it becomes repeatable, your consistency increases.


      Once it becomes predictable, your profits increase.


      This is how professional traders grow.


      FAQs


      How many trades do I need to measure system performance?

      50 is ideal, 20 is the minimum for early insights.


      Should I remove setups that don’t perform?

      If the data consistently proves they fail - yes.


      How do I know if I should adjust the system or my behavior?

      If setups fail even when executed perfectly, it’s a system issue - not a behavior issue.


      Should system metrics be reviewed daily or weekly?

      Weekly for micro-adjustments, monthly for structural updates.


      Start Trading Live!

      • Trade forex, indices, gold, and more
      • Access ACY, MT4, MT5, & Copy Trading Platforms


      It’s time to go from theory to execution!

      Create an Account. Start Your Live Trading Now!


      Check Out My Contents:


      Beginners Path


      Strategies That You Can Use

      Looking for step-by-step approaches you can plug straight into the charts? Start here:


      Indicators / Tools for Trading

      Sharpen your edge with proven tools and frameworks:


      How To Trade News

      News moves markets fast. Learn how to keep pace with SMC-based playbooks:


      Learn How to Trade US Indices

      From NASDAQ opens to DAX trends, here’s how to approach indices like a pro:


      How to Start Trading Gold

      Gold remains one of the most traded assets - here’s how to approach it with confidence:


      How to Trade Japanese Candlesticks

      Candlesticks are the building blocks of price action. Master the most powerful ones:


      How to Start Day Trading

      Ready to go intraday? Here’s how to build consistency step by step:


      Swing Trading 101


      Learn how to navigate yourself in times of turmoil

      Markets swing between calm and chaos. Learn to read risk-on vs risk-off like a pro:


      Want to learn how to trade like the Smart Money?

      Step inside the playbook of institutional traders with SMC concepts explained:


      Master the World’s Most Popular Forex Pairs

      Forex pairs aren’t created equal - some are stable, some are volatile, others tied to commodities or sessions.


      Metals Trading


      Stop Hunting 101

      If you’ve ever been stopped out right before the market reverses - this is why:


      Trading Psychology

      Mindset is the deciding factor between growth and blowups. Explore these essentials:


      Market Drivers


      Risk Management

      The real edge in trading isn’t strategy - it’s how you protect your capital:


      Suggested Learning Path

      If you’re not sure where to start, follow this roadmap:


      1. 1. Start with Trading Psychology → Build the mindset first.
      2. 2. Move into Risk Management → Learn how to protect capital.
      3. 3. Explore Strategies & Tools → Candlesticks, Fibonacci, MAs, Indicators.
      4. 4. Apply to Assets → Gold, Indices, Forex sessions.
      5. 5. Advance to Smart Money Concepts (SMC) → Learn how institutions trade.
      6. 6. Specialize → Stop Hunts, News Trading, Turmoil Navigation.


      This way, you’ll grow from foundation → application → mastery, instead of jumping around randomly.


      Follow me for more daily market insights!

      Jasper Osita - LinkedIn - FXStreet - YouTube


      This content may have been written by a third party. ACY makes no representation or warranty and assumes no liability as to the accuracy or completeness of the information provided, nor any loss arising from any investment based on a recommendation, forecast or other information supplies by any third-party. This content is information only, and does not constitute financial, investment or other advice on which you can rely.

      ACY Securities is one of Australia's fastest growing multi-asset online trading providers, offering ultra-low-cost trading, rock-solid execution, technologically superior account management and premium market analysis.

      This content may have been written by a third party. LiquidityFinder makes no representation or warranty and assumes no liability as to the accuracy or completeness of the information provided, nor any loss arising from any investment based on a recommendation, forecast or other information supplies by any third-party. This content is information only, and does not constitute financial, investment or other advice on which you can rely.
      Comments
      Most Recent
      Written By
      Daily Newsletter

      LF Daily News

      Daily industry focused newsletter giving you an overview for the financial & finTech industry.

      See All Newsletters
      By clicking "Sign Up" you are agreeing to our Terms of Service and Privacy Policy
      RSS Feeds

      Create a custom RSS Feed

      Select the categories and companies you wish to follow directly to your person rss feed.

      Create Custom RSS Feed

      Related Categories:

      Related Tags:

      #TradingJournal#SystemMetrics#SetupQuality#TradingEdge#PriceAction#RiskManagement#StrategyAudit

      Related Articles:

      Find The Right Partners for
      Your Trading Business

      Sign up and join over 5,000 professional members who receive personalized news alerts, curated professional connections, and more for free!

      Sign Up with LinkedIn
      Create Your FREE Account
      Get access to latest news, updates, real-time data, brokerage and trading firm insights and customized information feeds.

      XTB Group has rebranded its B2B liquidity and execution division, formerly known as X Open Hub, to XTB Institutional. The change brings the institutional arm into closer alignment with the wider XTB brand.

      just now

      HKEX has confirmed the 3 August 2026 launch of 5-year China Government Bond Futures in Hong Kong, following SFC approval. The contract adds to HKEX's China-related risk management tools, complementing Bond Connect and Swap Connect, and supports growth of Hong Kong's offshore RMB product ecosystem.

      just now

      The Fed held rates but the dots flipped to hikes, inflation forecasts blew out, and the chair is dismantling the very tool that just moved markets — here's what that means for the dollar.

      just now

      XS.com held a partner seminar at the Hyatt Regency Casablanca, Morocco, bringing together affiliates and partners. Senior executives Simon-Peter Massabni, Omar Alaa, Wael Hammad and Mohamad Ibrahim addressed the company's global strategy, marketing initiatives, and the future of trading partnerships during presentations and a panel discussion.

      just now

      Axi has been granted a licence by the Financial Services Commission of Mauritius, extending its regulated trading platform to high-growth markets. Chief Risk Officer Simon Hodgkiss says the move reinforces Axi's commitment to strong regulatory standards as the broker continues its international expansion.

      just now

      CME Group has announced that Terry Duffy, its longest-serving Chairman and Chief Executive Officer, will transition to the role of Executive Chairman on 1 March 2027, with President and Chief Financial Officer Lynne Fitzpatrick set to succeed him as Chief Executive Officer on the same date.

      just now

      StarCompliance and Kalshi have launched a partnership to deliver an enterprise-grade global compliance solution monitoring employee activity on prediction markets, covering both on-chain and off-chain environments to address growing MNPI risk for financial institutions.

      just now

      Wondering about the latest AUD/CHF price action? Explore current Forex trading setups, weekly chart patterns, and key levels to watch in this market analysis.

      just now

      This explains how to master the market cycles and timeframes to align trades with trends.

      just now

      Devexperts has announced a new dedicated cryptocurrency front-end for its DXtrade white-label platform, offering crypto-specific tools including order book visualisation, fee estimation, and multi-account support, alongside enhanced DXtrade functionalities for brokers seeking faster time to market and full branding customisation.

      just now
      Feed