
Last week, we were watching one relationship in particular for gold: the spread between the U.S. 2-year and 30-year Treasury yields.
Our thesis was simple. When the 2-year rises faster than the 30-year, the spread moves higher and near-term Fed pressure becomes more restrictive. Gold has historically struggled in that environment.
When the spread trends lower, conditions tend to become more supportive.
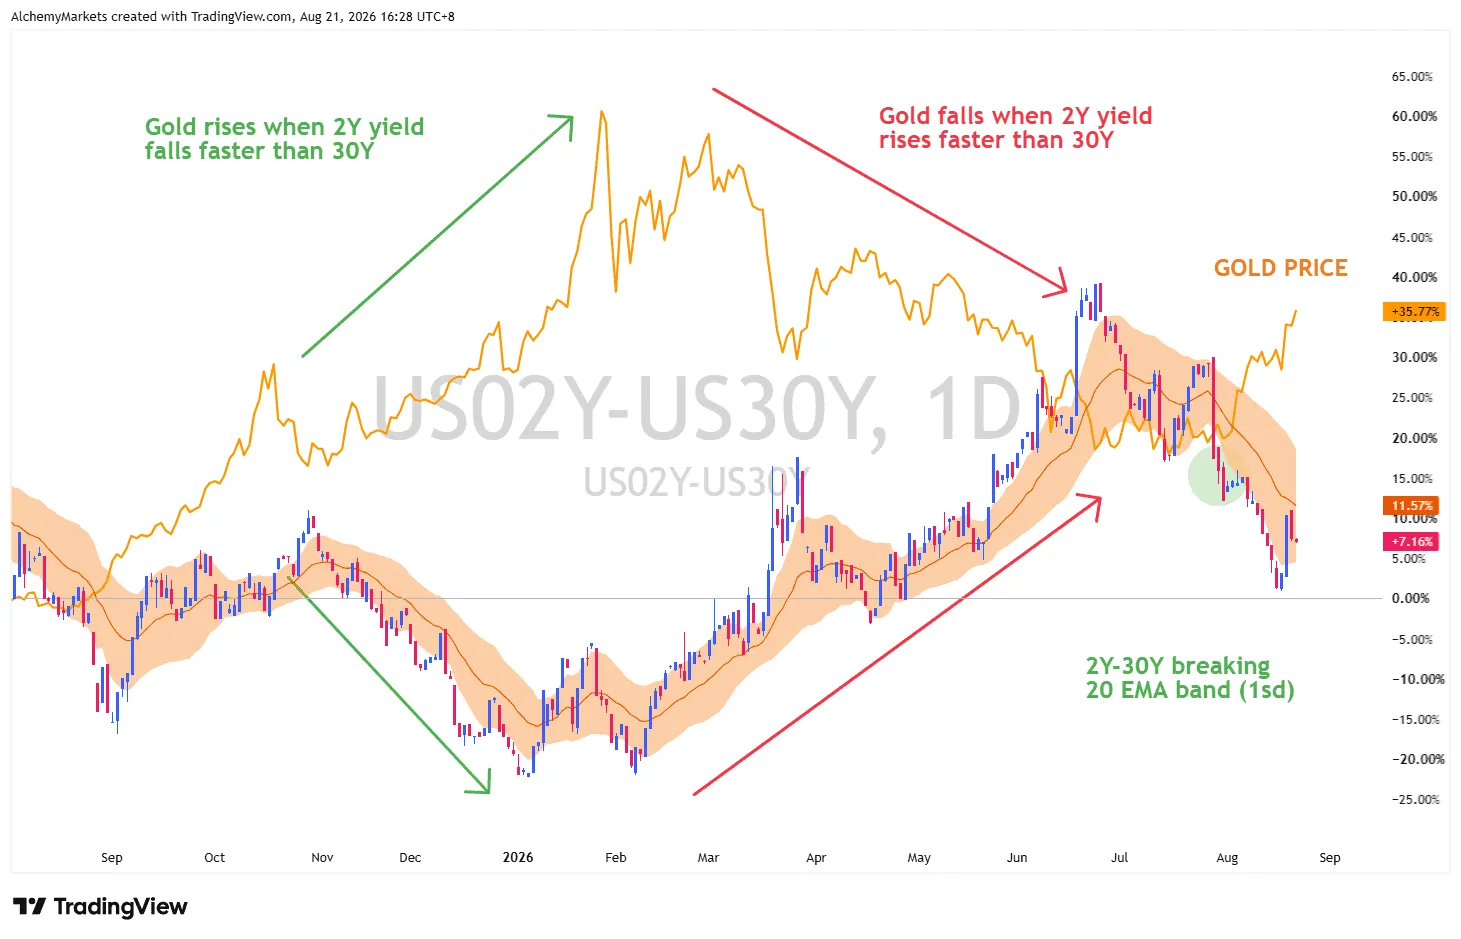
| The 2Y–30Y spread remains below its 20-day EMA band while gold has continued higher. |
Earlier this month, the spread broke below its 20-day EMA trend band, measured with Bollinger Bands set at one standard deviation. Gold subsequently rallied towards $4,560, while silver climbed towards $70.
So the signal worked. The question now is whether it is still valid after Treasury stepped into the long end.
Treasury Has Entered the Picture
After the 30-year yield reached roughly 5.3%, Treasury announced that long-end liquidity-support buybacks would increase from $2 billion to at least $4 billion per operation from September 9.
Yields initially fell, but much of that move was quickly recovered. The 30-year dropped sharply on Wednesday, then bounced back on Thursday and is still grinding around its rising 20-day EMA band.
For context, the 30Y yield was 5.30% during the intervention. Now it's back at 5.248%.